
As the BTC price once again stumbles over the $24k mark, the short term trend provides little information as to future price movements. While we wait for the market to make its decision, let’s establish the support/resistance levels to which the price could react, both up and down. On-chain analysis of the situation
Bitcoin is staggering on its pivot point
BTC price stumbles a third time through the $24k level, without making a clean break, while holding above the EMA21.
While the market is testing a key pivot point, the short-term price trend has yet to define a clear medium/long-term bias.
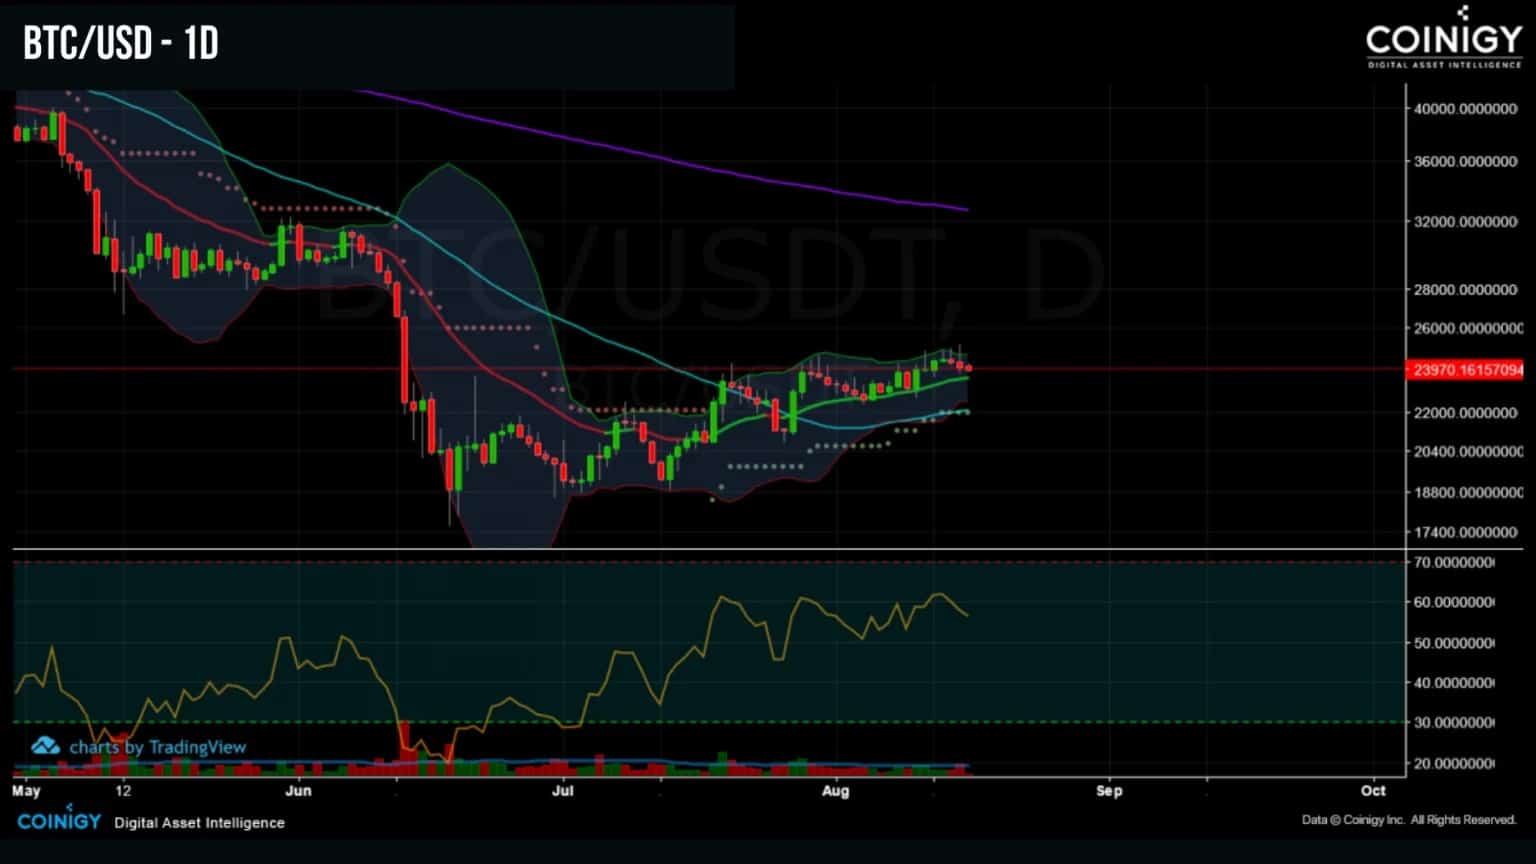
Figure 1: Daily BTC price
This week, in order to identify support/resistance levels to which the price could react, both upwards and downwards, we will analyse:
- the base costs of different cohorts of entities;
- the distribution of realised prices of newly created UTXOs.
The onchain base costs
In order to establish support/resilience levels based on participant behaviour, onchain analysis has metrics derived from the “realised price”.
Introduced by CoinMetrics in 2018 through ‘realised capitalisation’, the realised price of a coin represents the price of a UTXO – in other words, a fraction of BTC – at the time of its last movement on the chain.
Whether it is a change of ownership or a transfer between portfolios of the same entity, this indicator measures the spot price of BTC at the time of creation of a UTXO and serves as a proxy for determining the cost base of a coin.
It can take several forms which we will develop below.
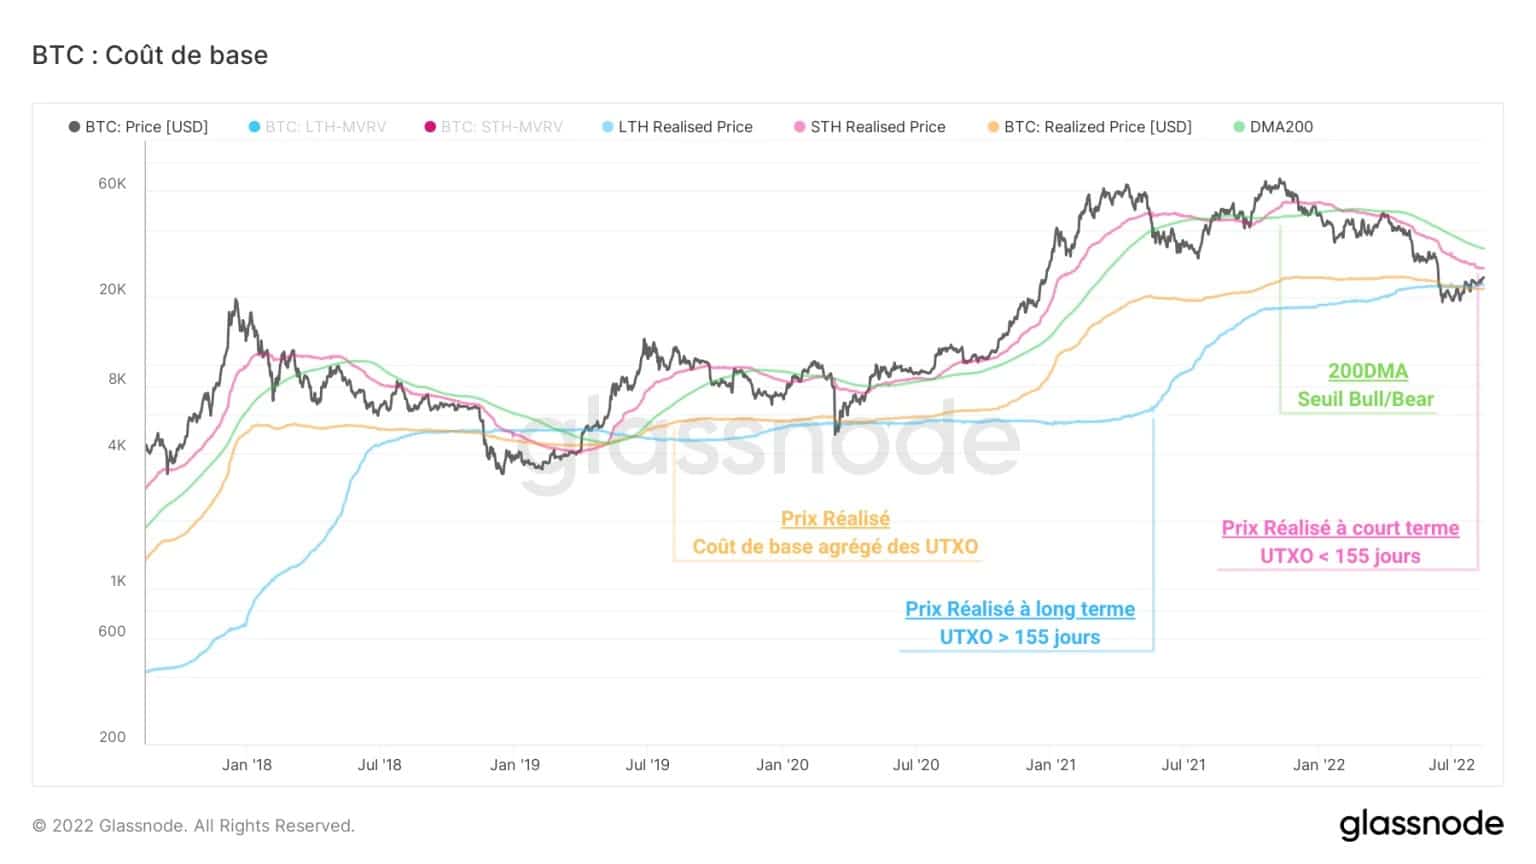
Figure 2: Various short, medium and long term trend indicators
Here, the realised market price aggregates the realised prices of all existing UTXOs to form an aggregate cost base, which serves as an indicator of market profitability.
- When the realised price is lower than the spot price, the cost base of coin holders is lower than the market price. The average investor is therefore in a profit position.
- Inversely, when the realised price is higher than the spot price, the aggregate cost base is higher than the market price. The average investor is therefore in a loss-making state, signalling a rare buying opportunity.
Currently, the realised price is around 9% below the spot price: the market is returning to profitability after spending almost a month below this key level between June and July.
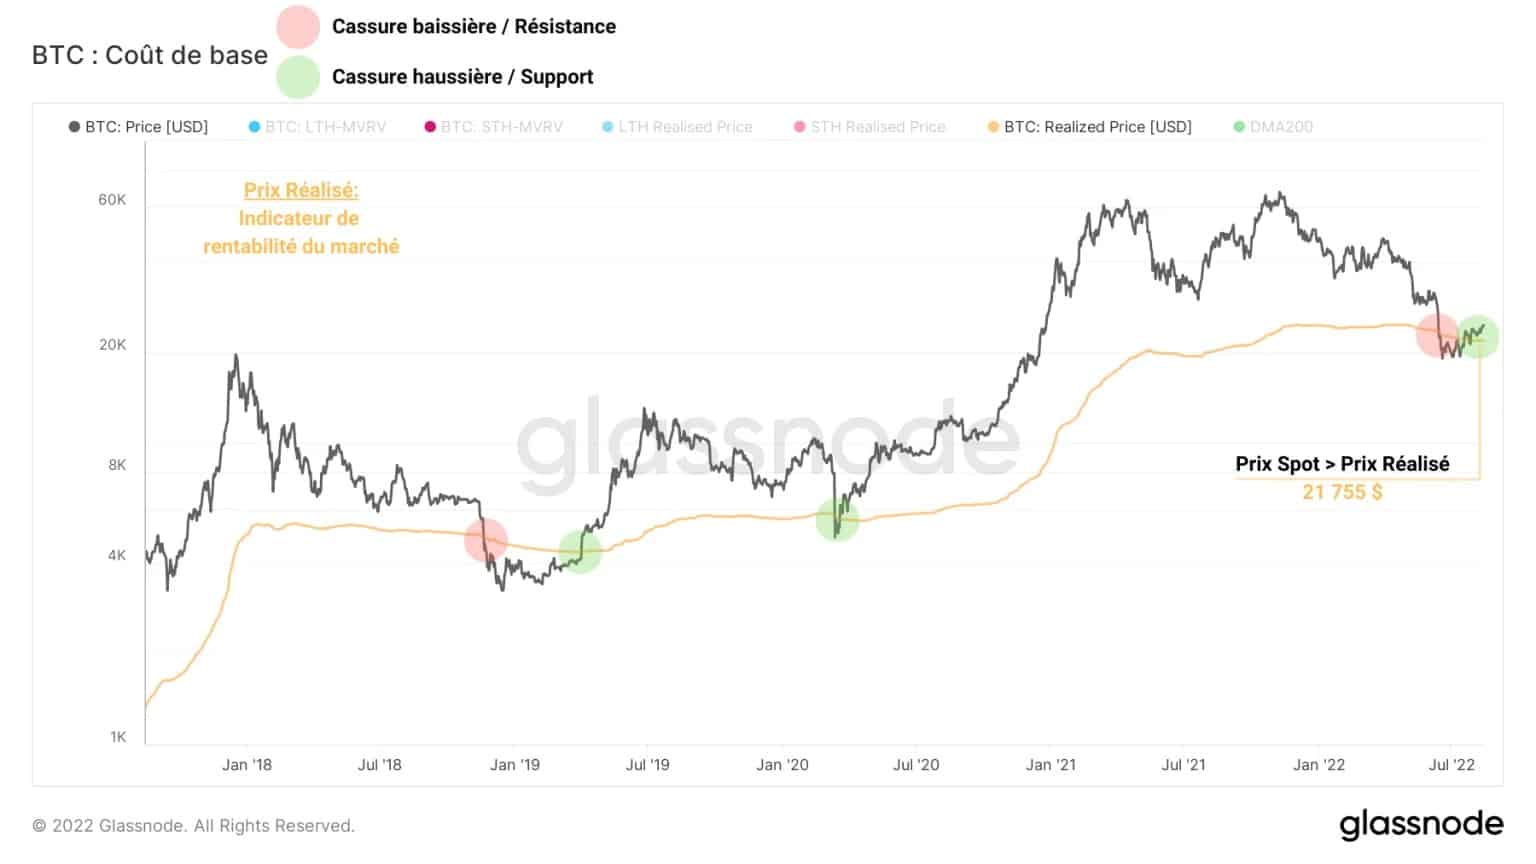
Figure 3: Realised price of bitcoin (BTC)
The realised price of long-term holders/investors (LTH) is a variant of the realised price based on the LTH/STH dichotomy, separating UTXOs into two cohorts: those older than 155 days and those younger than 155 days.
Since UTXO passing the 155-day age threshold are statistically less likely to be spent, holders of such coins are considered high conviction entities with HODLing behaviour and a long-term view.
As an indicator of the long-term profitability of the market, the LTH cost base makes it possible to identify periods of strong underpricing.
At 8% above the spot price, it indicates that the LTH cohort is profitable again and that a period of severe financial pain has recently ended.
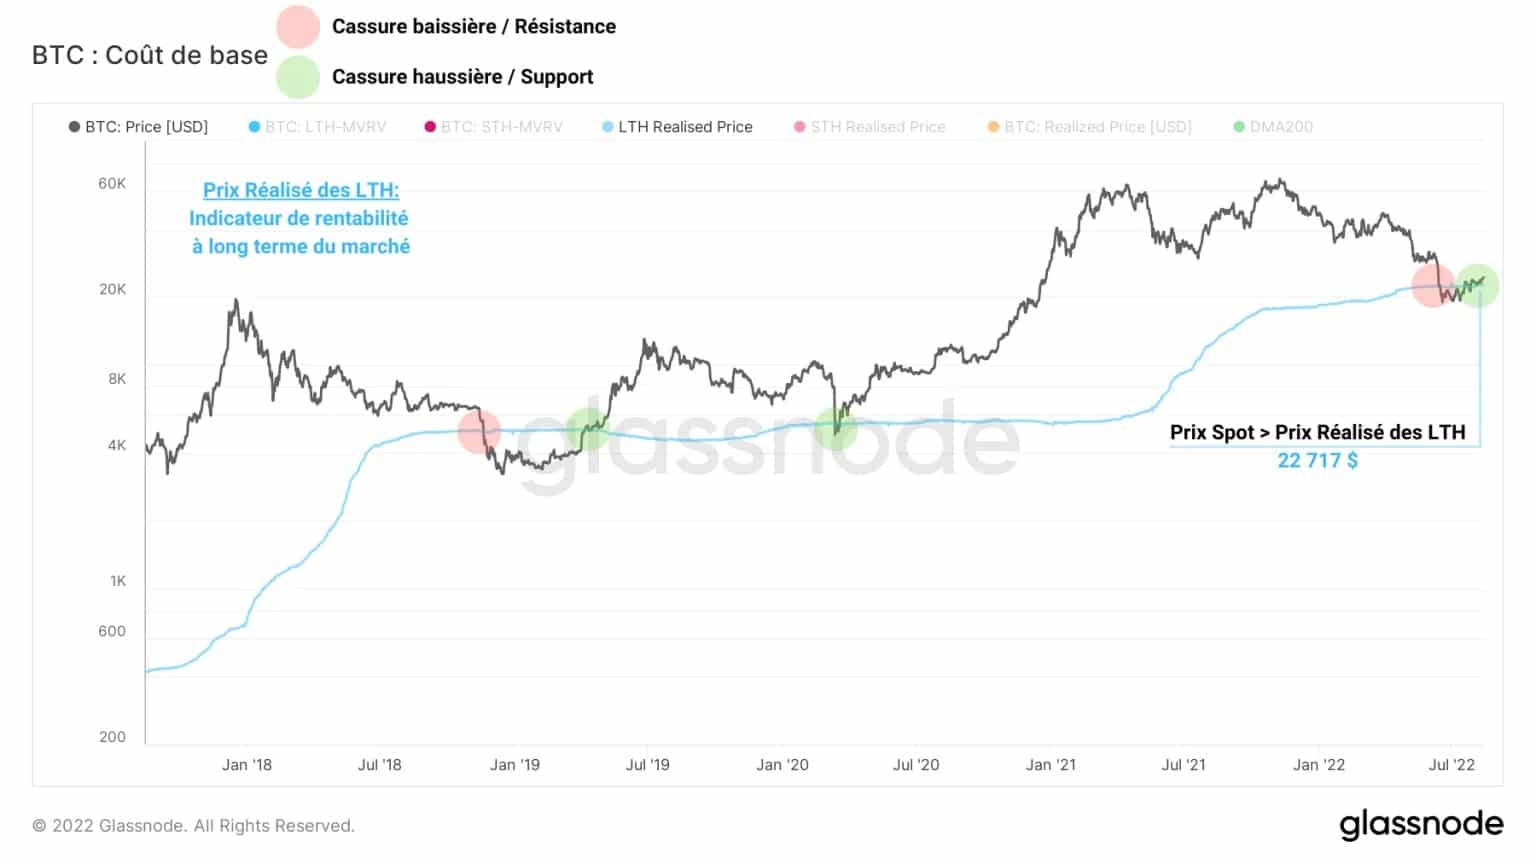
Figure 4: Realised price of long-term investors (LTH)
The realised price of short-term holders/investors (STH) is the nemesis of the realised price of LTHs and takes into account UTXOs less than 155 days old. It serves as a short-term trend indicator and acts as a support/resistance to market fluctuations.
- The realised price of STH acts as a support to the spot price and supports an uptrend, indicating that investors are taking advantage of a correction to buy close to their cost base (confidence).
- The realised price of STH serving as resistance to the spot price and supporting a downtrend indicates that investors are taking advantage of a rise to sell close to their cost base (distrust).
At around $26.8k, it is currently an on-chain resistance level that needs to be breached to confirm a constructive uptrend.
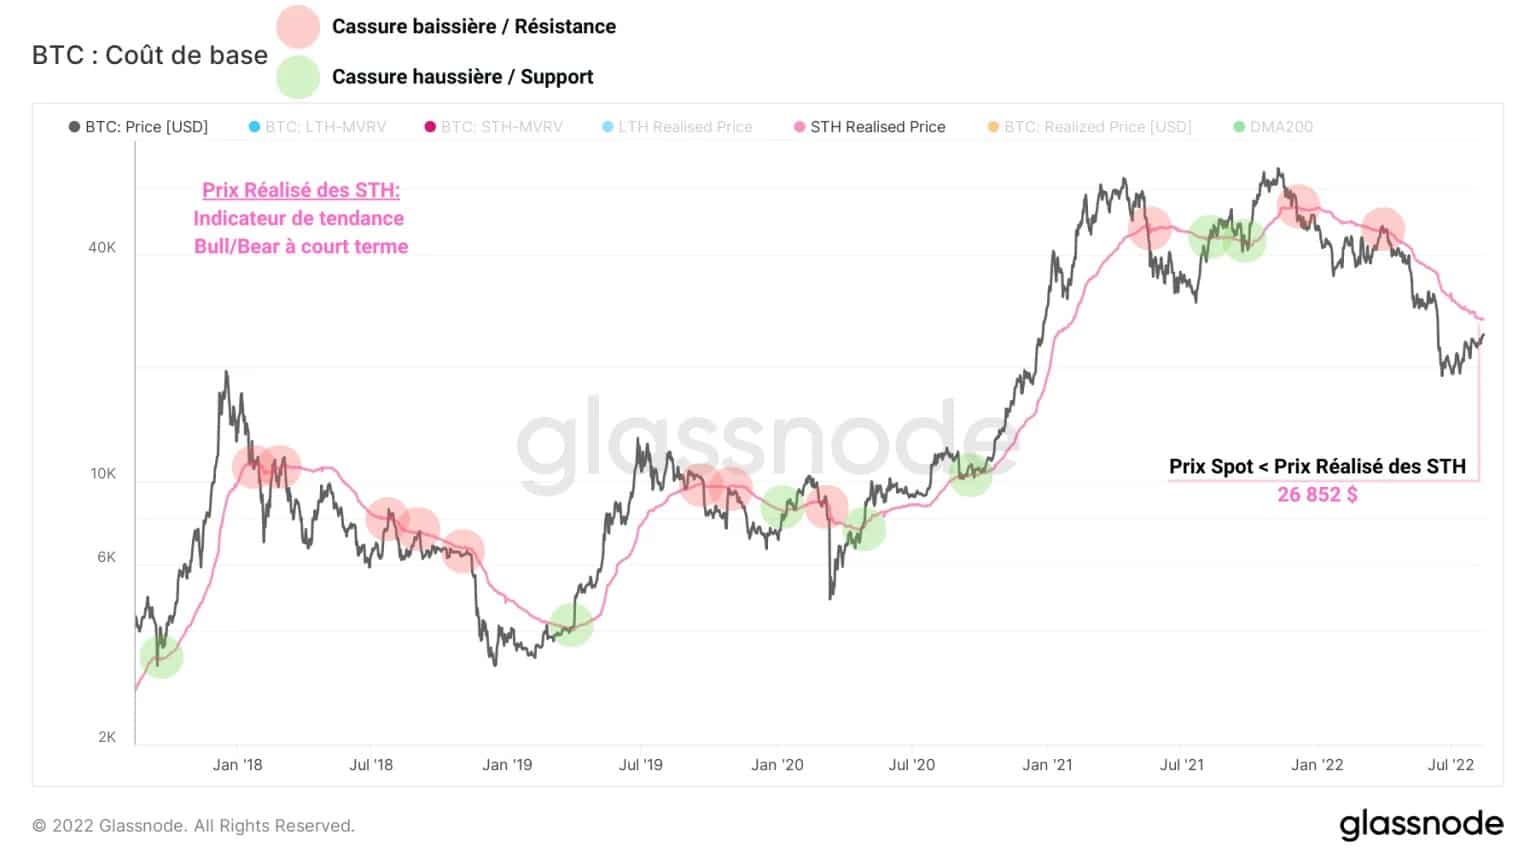
Figure 5: Short-term investors’ realised price (STH)
Distribution of realised prices
Another way to identify levels of support/resilience other than via Bitcoin blockchain data is to look at URPD (UTXO Realized Price Distribution)
This rather unusual metric is the equivalent of the “volume profile” traditionally used in technical analysis. The chart shows at what prices the current set of UTXO’s were created.
Thus, we can detect a high volume of prices realized between $17.8k and $24k. It represents the area where the most coins have changed ownership and signals an area of high demand that can act as support.
Furthermore, a lack of volume between $24k and $26.7k indicates that very little BTC has been traded at these price levels, which could create a bullish call if the $24k – $25k is breached.
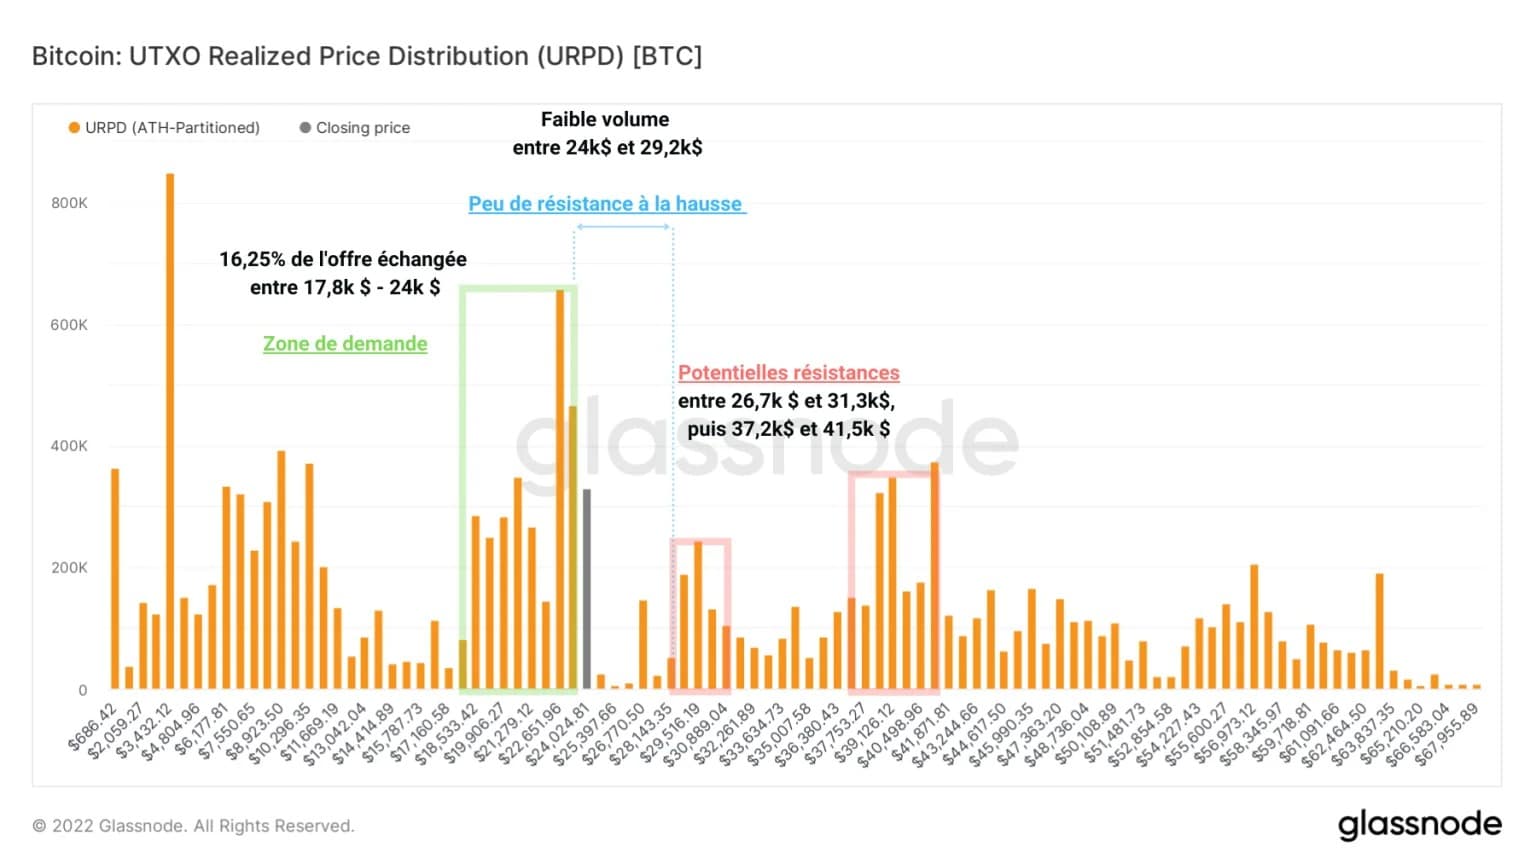
Figure 6: URPD – UTXO realised price distribution
After identifying different levels of on-chain support/resistance, this is what their distribution looks like on the BTC price chart:
- $18k – $24k: Demand zone, which can act as support. That said, if the price were to break the realised price and the LTH realised price to the downside, a panic phase is quite possible.
- $29k – $32k : Once the price of STHs has been breached, this supply zone represents, along with the 200DMA, a level that can serve as resistance. Its break above would be a very constructive signal for a recovery.
- $37k – $44k: Offer zone, which can act as resistance. The strength of this level will need to be reassessed if a recovery is confirmed.
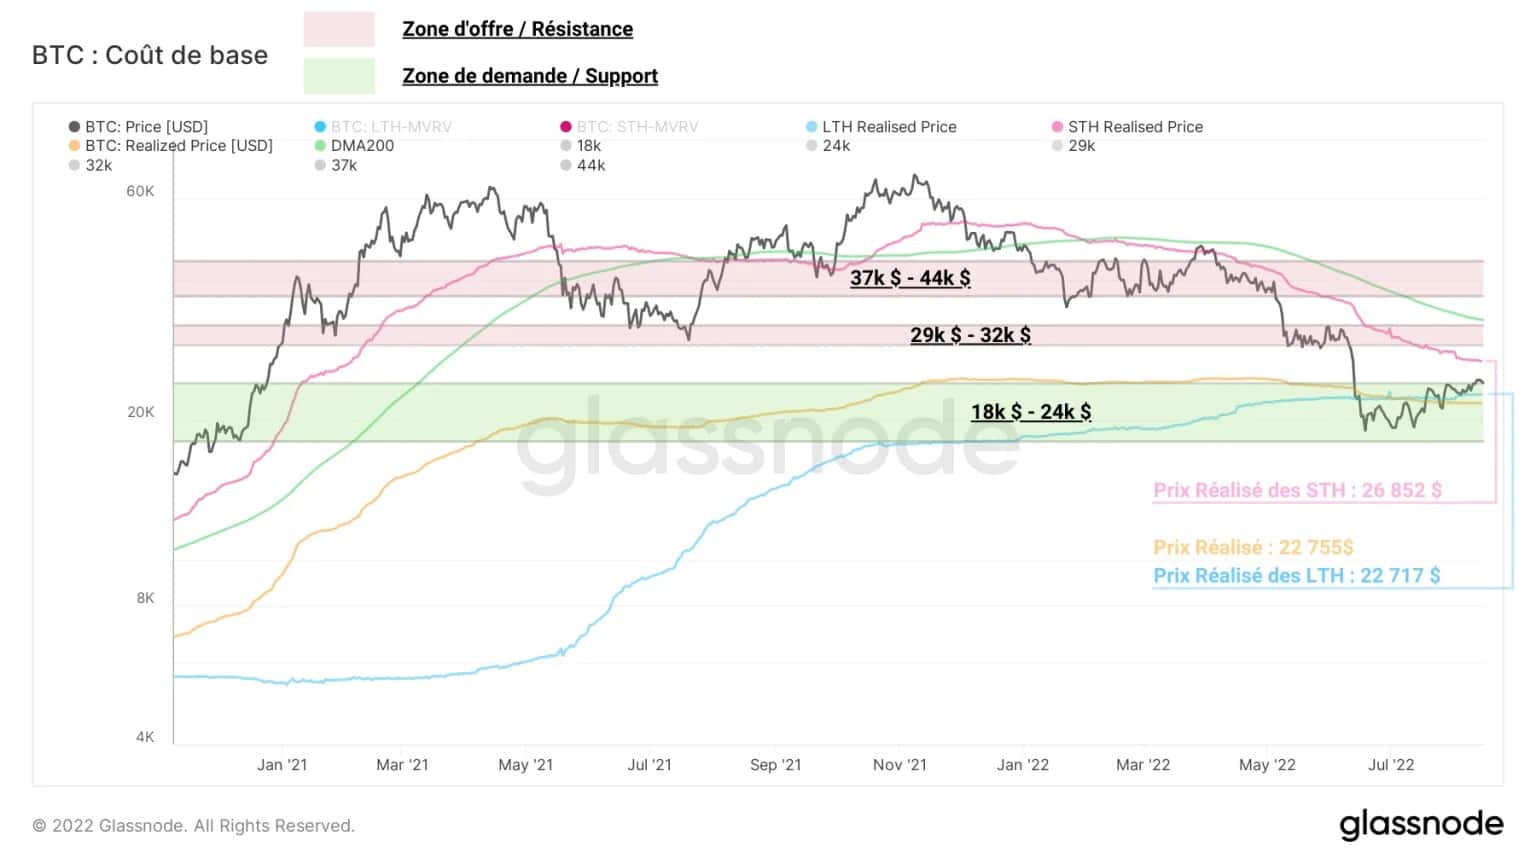
Figure 7: Various levels of support/on-chain resistance
Summary of this on-chain analysis
In sum, this week’s data indicates that bitcoin (BTC) is currently sitting on the upper resistance of a demand zone ($18k to $24k), which can act as support on the downside.
The realised price and the realised price of LTH, which is around $22,700, are the two key levels to watch. If these levels are breached from below, the likelihood of strong downward pressure is non-negligible.
We will then see a potential redistribution of BTC in circulation between participants giving in to selling pressure and opportunists seeing these price levels as a rare buying opportunity.
Conversely, if the price were to break through $24k, a lack of realised price volume would encourage a bullish call that could push the price towards $26.5k, where the realised price of STH is currently located.
This indicator is the resistance to be breached and then tested as support to confirm a constructive trend reversal, allowing to go for the next short/medium term resistance zone, located between $29k and $32k.