
While constructive dynamics are forming in terms of participant engagement, the invalidation of an important pivot point portends a new wave of loss taking and negative profitability in the near term. On-chain analysis of the situation
Bitcoin aborts reversal attempt
Bitcoin (BTC) price invalidates $24k resistance and returns to visit the demand zone identified last week, causing the price to fall about 10% over the past seven days.
In response to this drop, the market is once again in an undervalued state, while onchain activity among participants indicates renewed interest.
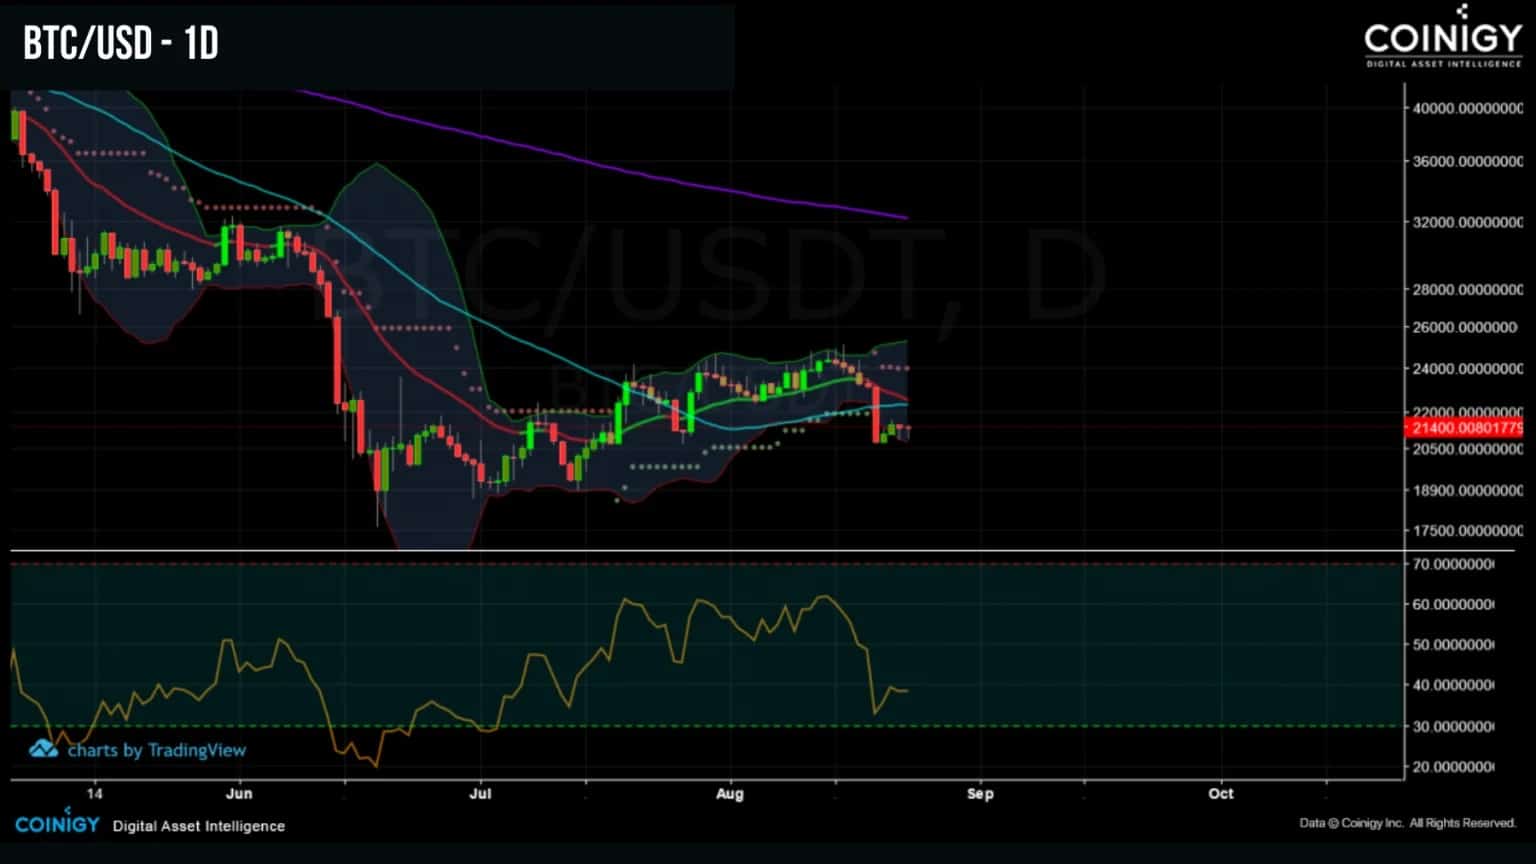
Figure 1: Daily BTC price
This week we will be evaluating:
- the on-chain activity of participants on the Bitcoin chain;
- the state of market profitability and investor spending;
- the maturation of coins accumulated over the past three months.
Get a month’s discount with 40% off to test our service at a discounted price with the code PROF when you sign up
A slight upturn in activity
A month ago, we identified a significant lack of on-chain activity on the Bitcoin chain. Indicating a noticeable lack of interest and engagement from participants in response to the falling price, this trend has reversed since July to provide a mixed but constructive signal.
Indeed, since July 15, the number of active entities on the Bitcoin network has begun to rise slightly, reaching 254,843 active entities today, an increase of 8% over the past 38 days.
Indicating a slight but noticeable uptick in interest, this indicator highlights the fact that participants have identified the recent price recovery as a potential investment opportunity.
That said, the short-term trend seems to favour a further decline, so it remains to be seen whether this activity will continue despite a return of the price to the lower $18k-$24k demand zone.
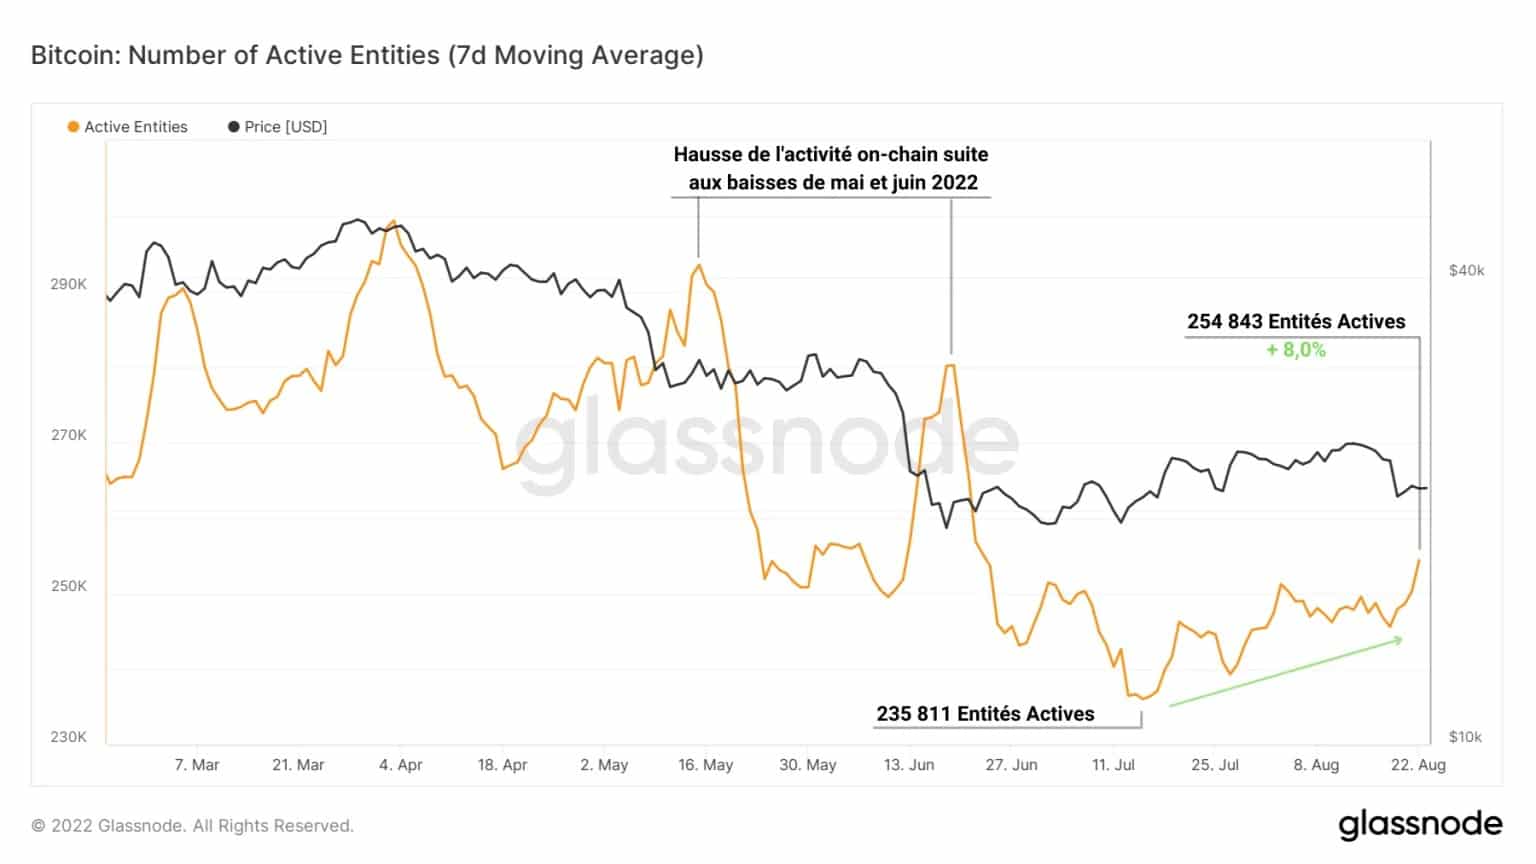
Figure 2: Active Entities
Another indicator that supports this observation is the number of transactions carried out daily on the network. Similar to the number of active entities, the graph below shows that participants have been more active since the end of June.
From 203,415 to 216,282 transactions (Tx) per day, the daily Tx metric is up 6.3% over the past 58 days, while the BTC price has fallen -1.7%.
This upward trend in on-chain activity metrics signals a noticeable increase in confidence over the past two months, which is very constructive in terms of fundamental value and use of the chain.
That said, these indicators are still in bear market territory and will need time to form a new bullish momentum reflecting a serious return of user and investor engagement.
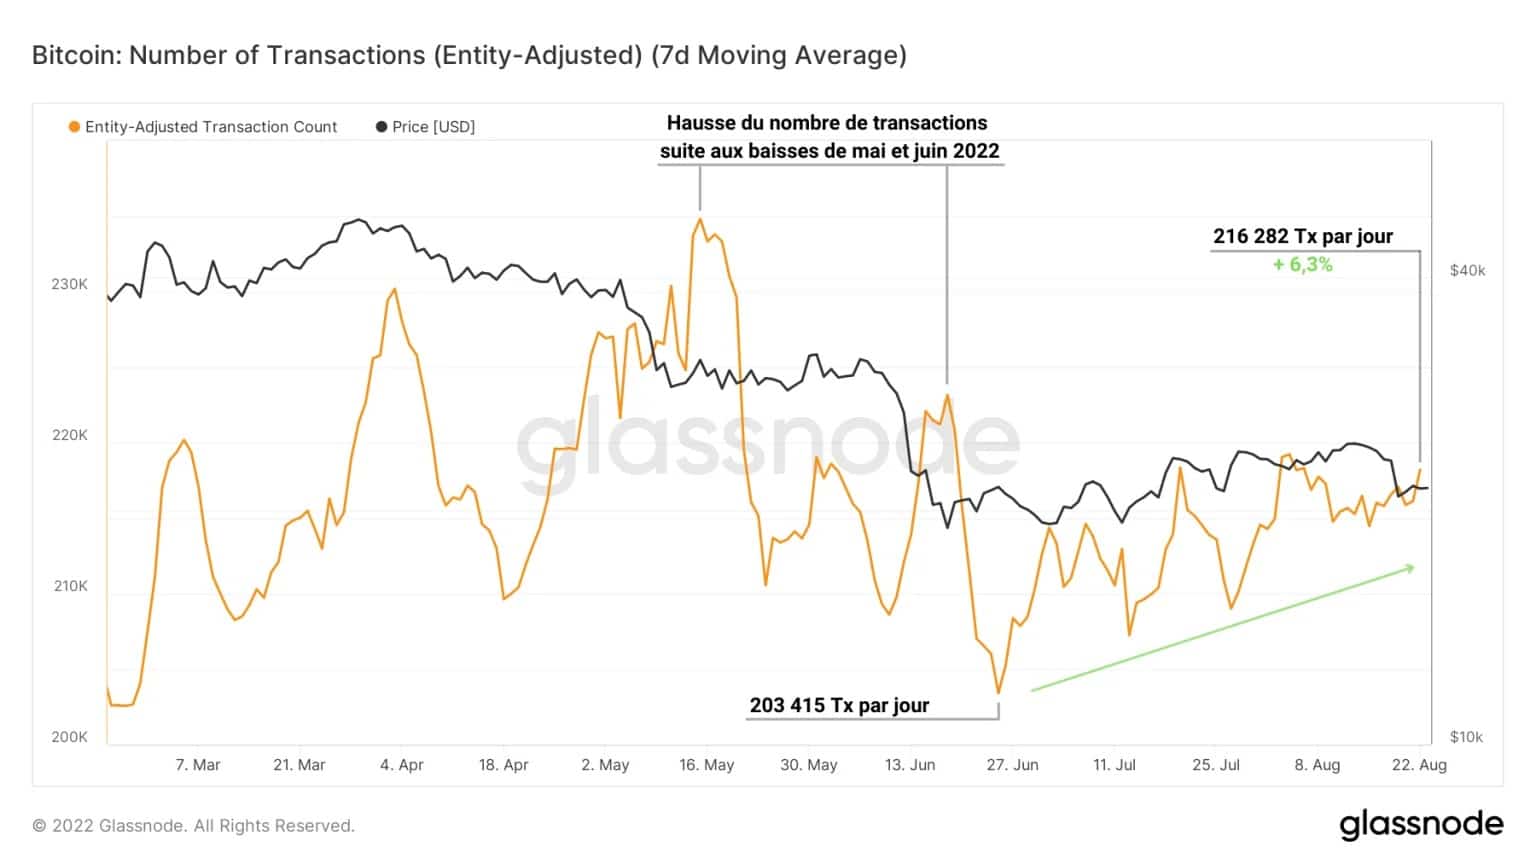
Figure 3: New Entities
These findings are corroborated by an increase in transfer volume on the channel since the end of April.
Although the two volume peaks in May and June were caused by sharp price declines, resulting in a significant transfer of coins from loss holders to new buyers, this trend maintained its momentum during July and August.
With an increase of over 122% in almost three months, there are now nearly 280K BTC circulating on the Bitcoin network.
However, this increase in volume is partly fueled by coin transfers in profit, which were intended to make small gains during August in anticipation of the recent price weakness.
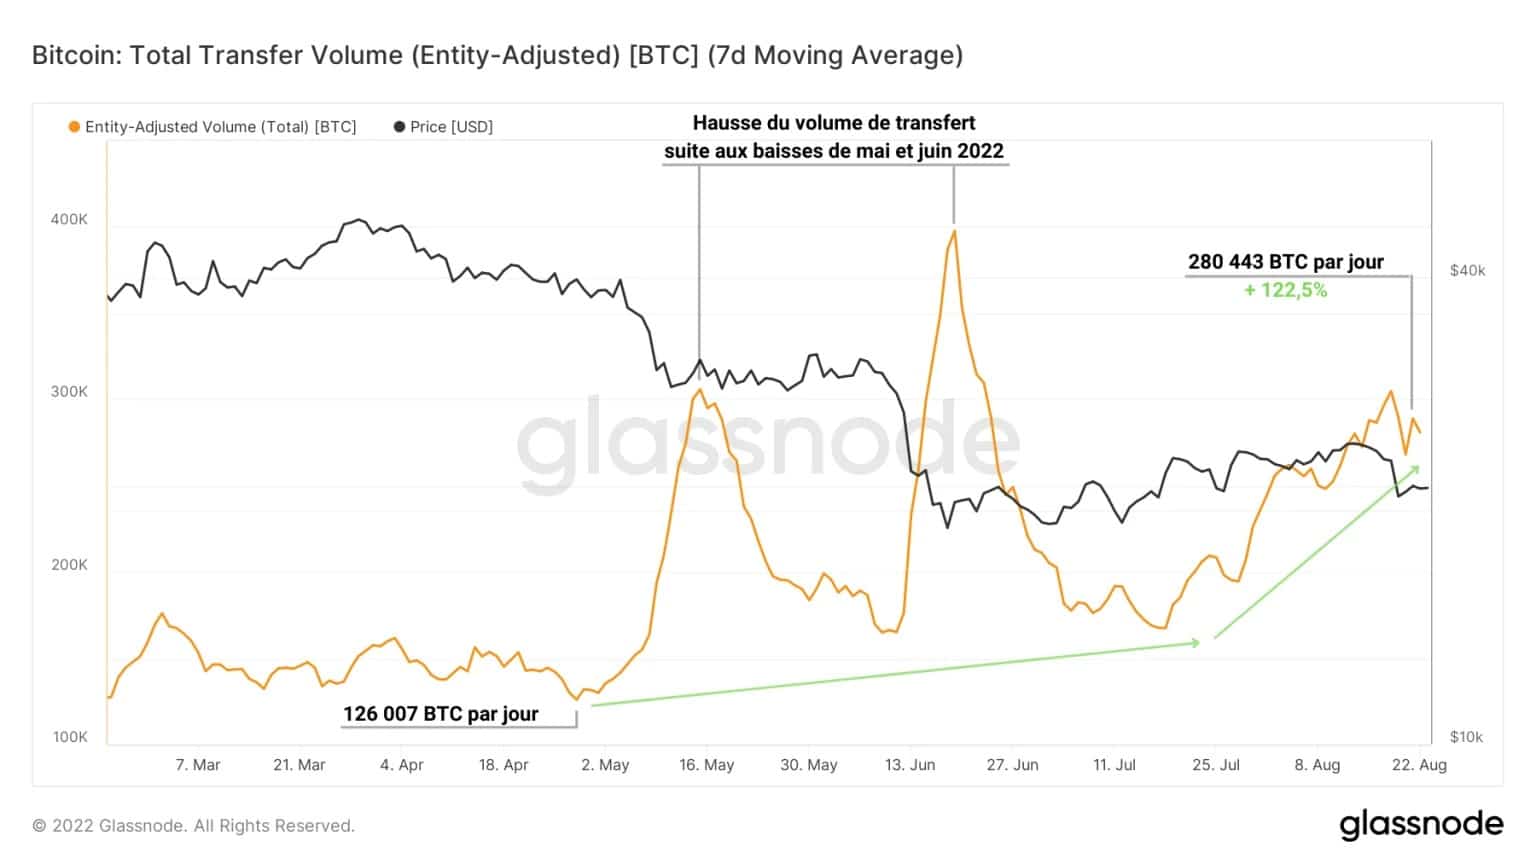
Figure 4: Transfer Volume
Pivot point rejection
Indeed, the pivot point test identified a fortnight ago against the profitability of spending on the channel has so far failed, pointing to a resumption of loss making in the coming days/weeks.
The following chart shows us that the aSOPR has finally invalidated on testing the neutral zone (aSOPR = 1) as resistance, indicating that expenses remain in a negative profitability state.
This rejection is one of the most deleterious elements in the short term, which leads me to favour caution regarding price movements for August and potentially September.
This invalidation of the neutral zone confirms the thesis of our previous analysis that young coins, less than three months old, have been spent throughout the recent rally, showing negative profitability although close to their cost basis.
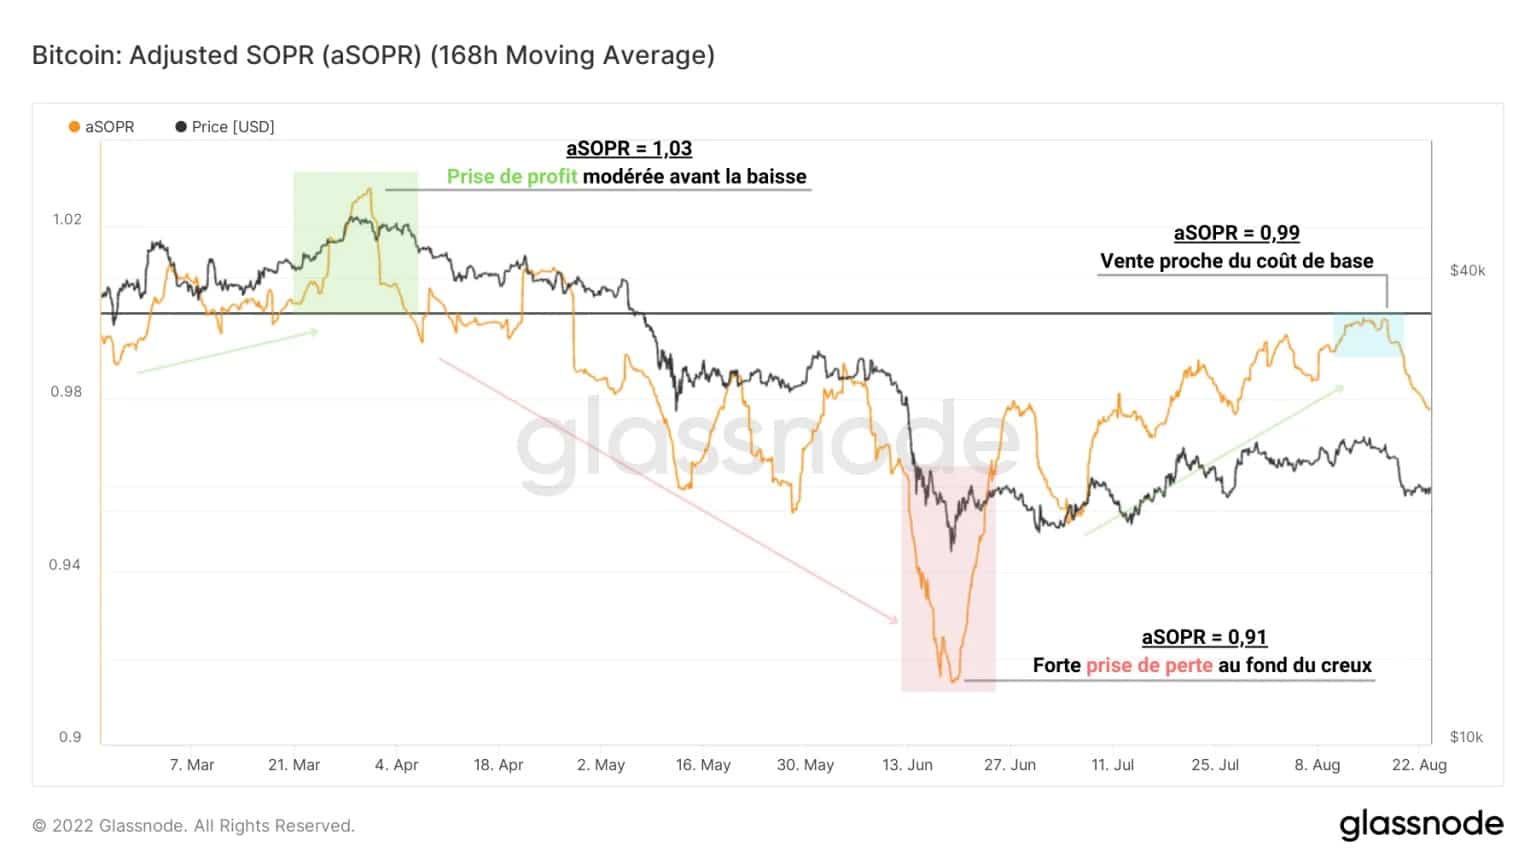
Figure 5: Expense Profitability Ratio
This finding is reinforced by the study of net profits/losses on the channel and supports the fact that some participants took advantage of the July-August rally to close out positions and limit the losses.
Reinforcing the possibility that the $24k test was actually leading us into a dead cat bounce scenario, the profits made since August have resulted in minimal losses and even some profits, but not exceeding the $1 million per day level.
This is very low compared to a similar pattern at the end of March, when nearly $35 million in profits were made before the market visited the current price zone.
While a realization of losses similar to the one in early June (in red) is unlikely in terms of scale, we can expect to see some participants (especially short term holders) succumb to selling pressure over the next few days.
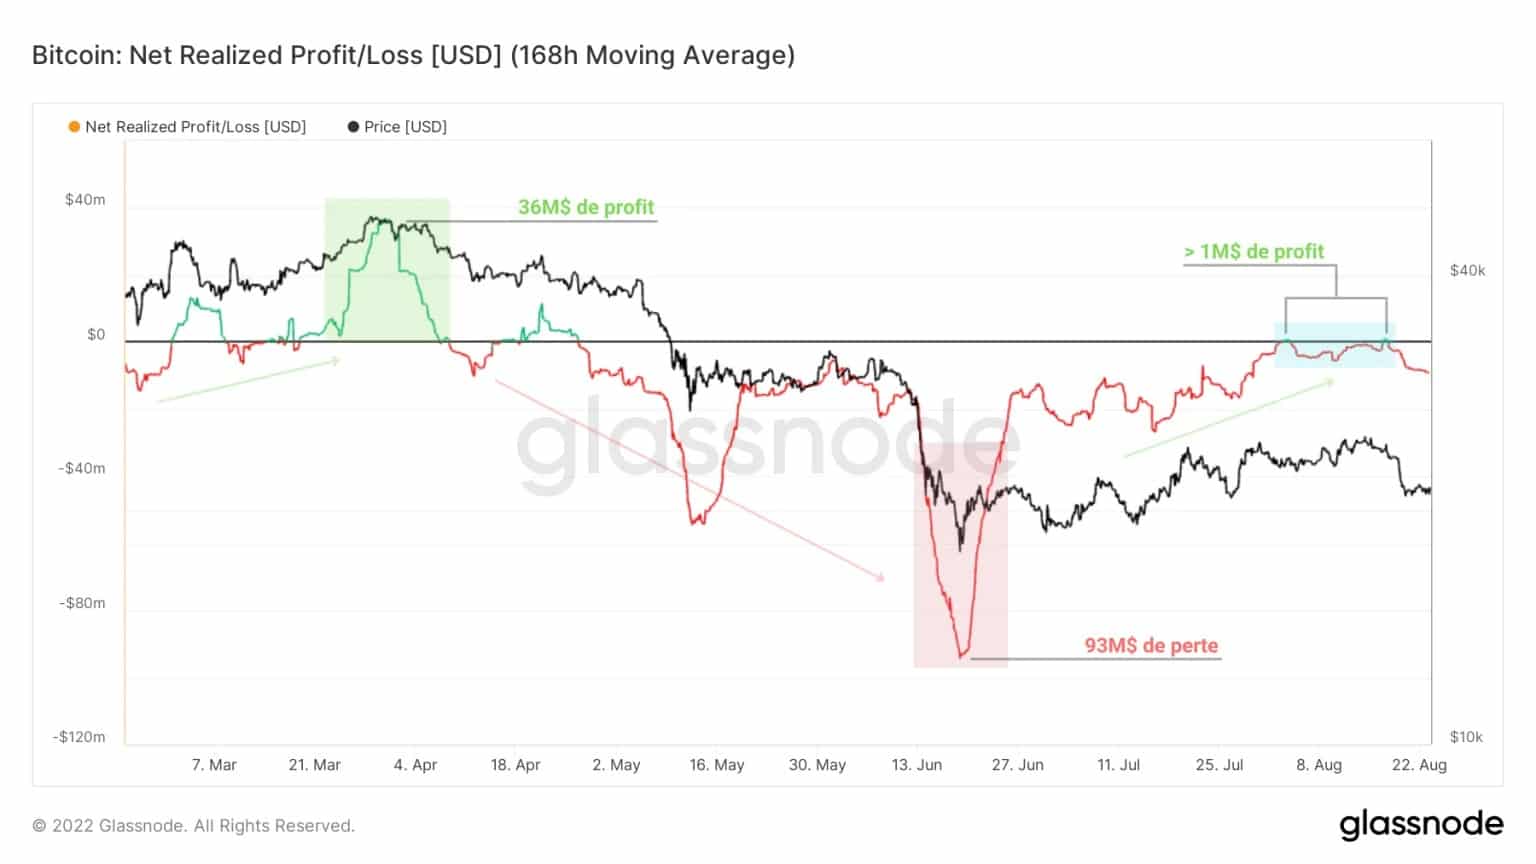
Figure 6: Net Profits/Losses
In response to the recent price drop, the spot price of BTC has once again crossed the realised market price downwards. As explained in last week’s on-chain analysis, the failure of the realised price to provide support for the BTC price increases the likelihood that strong downward pressure will occur as the overall investor cost base is again higher than the spot price.
A potential redistribution of outstanding BTC between participants giving in to selling pressure and opportunists seeing these price levels as a buying opportunity is therefore to be expected if the price continues to fall.
Although buying BTC below this psychological support level is a bullish bet with asymmetrical expectations of gains, no one knows how much longer the price of BTC can move below the realised price.
Furthermore, the realised price of long-term holders (LTH) has also been breached on the downside, inducing strong selling pressure on this cohort which has so far released very few sales compared to its unrealized losses.
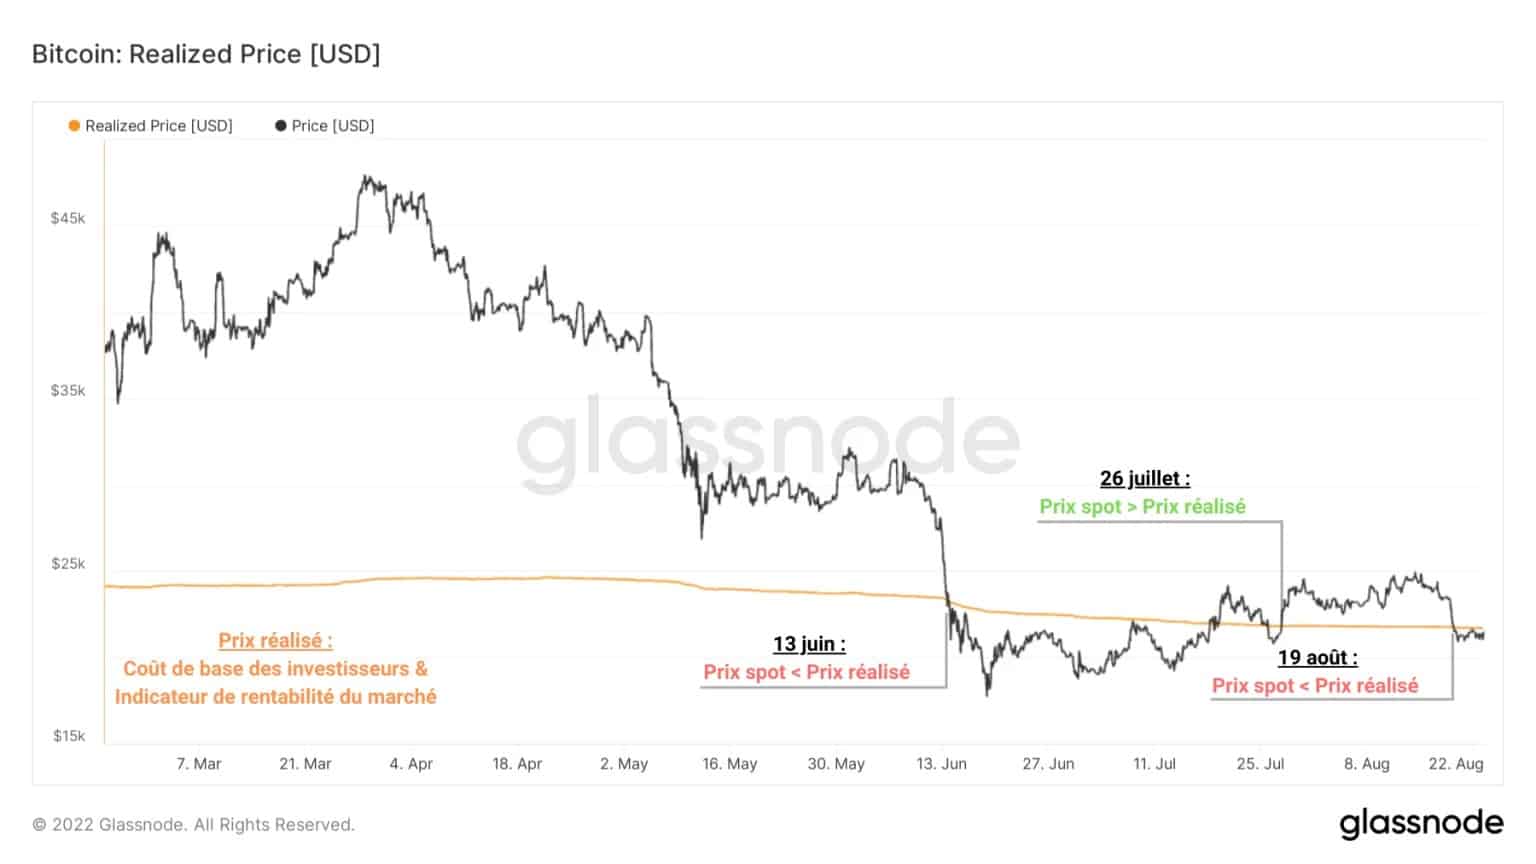
Figure 7: Realised price
Summary of this onchain analysis
In sum, this week’s data indicates that while constructive dynamics are forming in terms of participant engagement, the downtrend prevails now that price has invalidated the test of an important pivot point.
A modest but noticeable increase in on-chain activity indicates that participant engagement is gradually returning, while channel usage is showing encouraging signs of recovery.
However, the failure of the aSOPR test as resistance and the return of the spot price below the realised price augurs a new wave of loss-taking and negative profitability in the near term, which could allow the price to test the strength of the $18k-$24k demand zone.
Sources – Figures 2 to 7: Glassnode
Access Prof. Chain’s full analysis via our private group: The Grille-Pain
Take advantage of one month with 40% discount to test our service at a reduced price with the code PROF when you sign up