
Participant engagement on the Ethereum blockchain is lacking and new entrants are missing out. In addition, the study of the profitability of ETH deposits on the ETH 2.0 contract highlights the fact that the majority of depositories are making losses on their locked positions. Onchain analysis of the situation
Ether hits $2000
The price of Ether (ETH) is stumbling over $2k resistance and resting on the 50-period moving average (50DMA), around $1.5k, showing a drop of about 20% over the past seven days.
As the Merge, scheduled for September 15, approaches, activity on the Ethereum blockchain is showing a noticeable drop in commitment, as the ETH price sails below the ETH 2.0 custodian cost base.
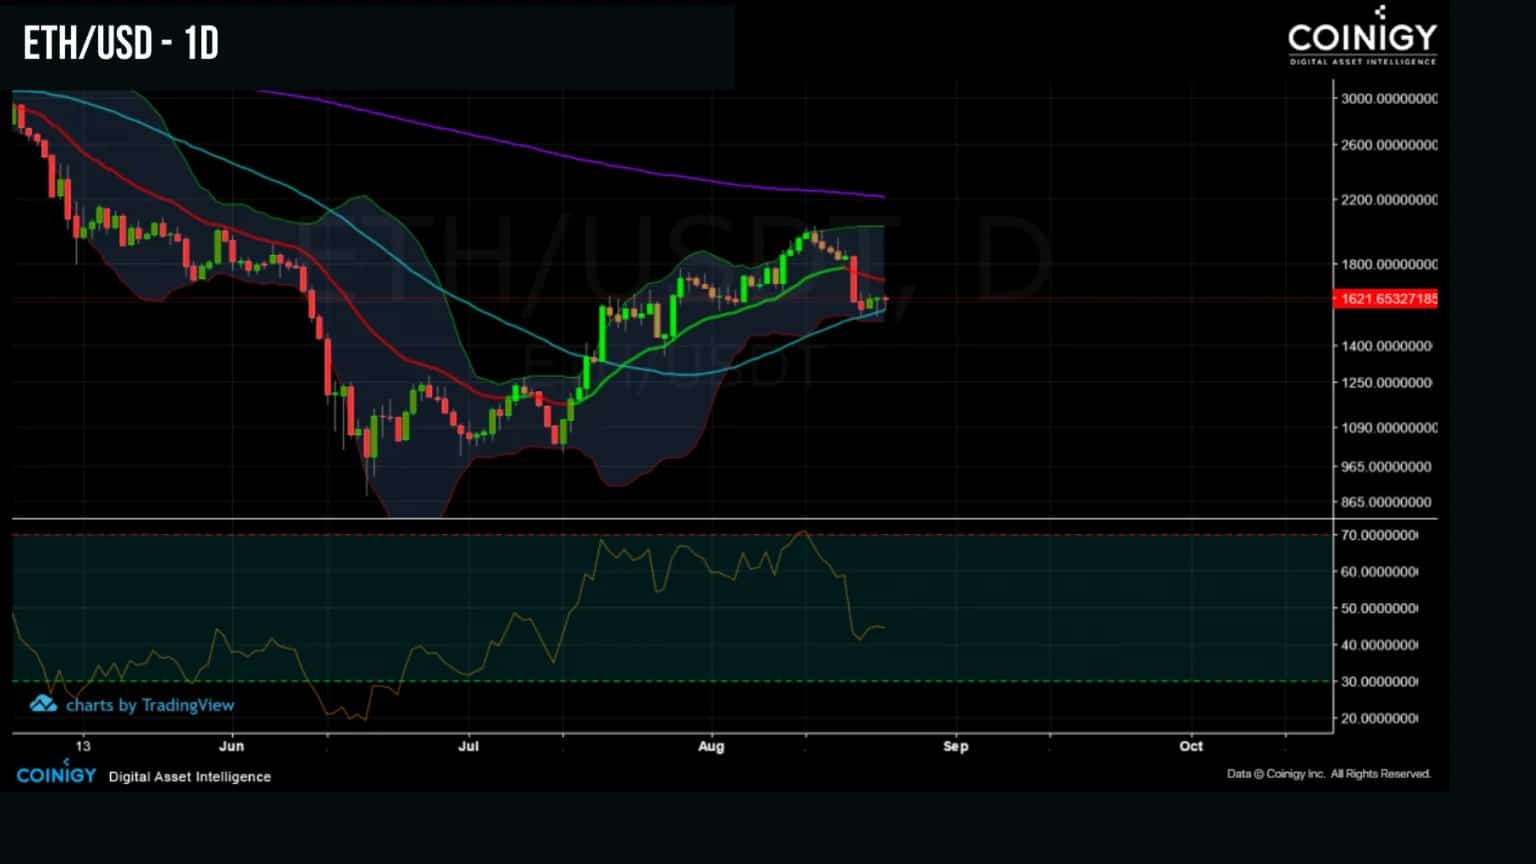
Figure 1: Daily ETH price
This week we will be evaluating:
- on-chain activity of participants on the Ethereum blockchain;
- the financial condition of ETH 2.0 custodians.
Get one month with 40% discount to test our service at a reduced price with the code PROF when you sign up
Weakness in onchain activity
With three weeks to go before Ethereum transitions from Proof-of-Work to Proof-of-Stake, on-chain activity among participants is showing a worrying weakness, with users seemingly ceasing their activity, which has been increasing throughout July.
The number of active addresses is an excellent proxy for participant engagement on the channel and shows that, following a 27% increase in address activity in July, this measure has dropped by 21% since 1 August.
With nearly 30k addresses using the Ethereum blockchain on a daily basis today, the sharp loss of activity we have just identified is a remarkable development with at least two possible interpretations:
- Participants leave the chain and favour – as in Bitcoin – a dead cat bounce scenario;
- Participants slow down their activity in anticipation of the Merge and the potential benefits/drawbacks that this event may bring.
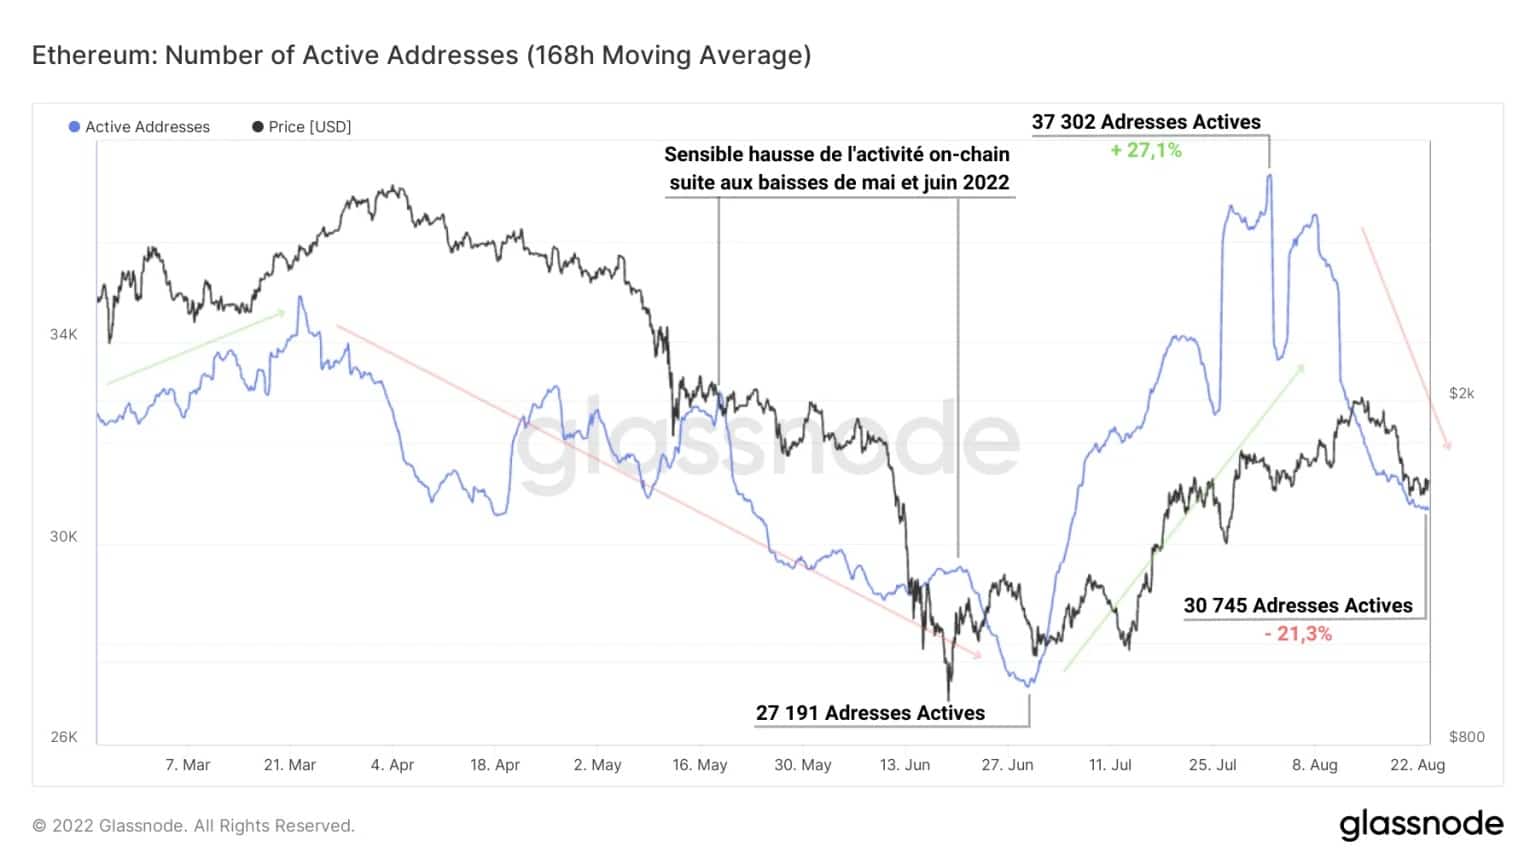
Figure 2: Active addresses
Supporting this observation, the number of new addresses appearing on the network carries an even less charming signal. Indeed, the growth of new addresses on the Ethereum network, partly symbolising the arrival of new participants, is close to a low point over the last six months.
While price drops in May and June caused the metric to rise slightly, signalling the opportunism of newcomers attracted by sales, the new address count remains on an overall downward trend.
What is also surprising is the recent drop of more than 30% in the number of new addresses after having increased by more than 25% during July.
New participants are clearly missing, even though the recent rise in the price of Ether seemed to attract capital from both sides of the market.
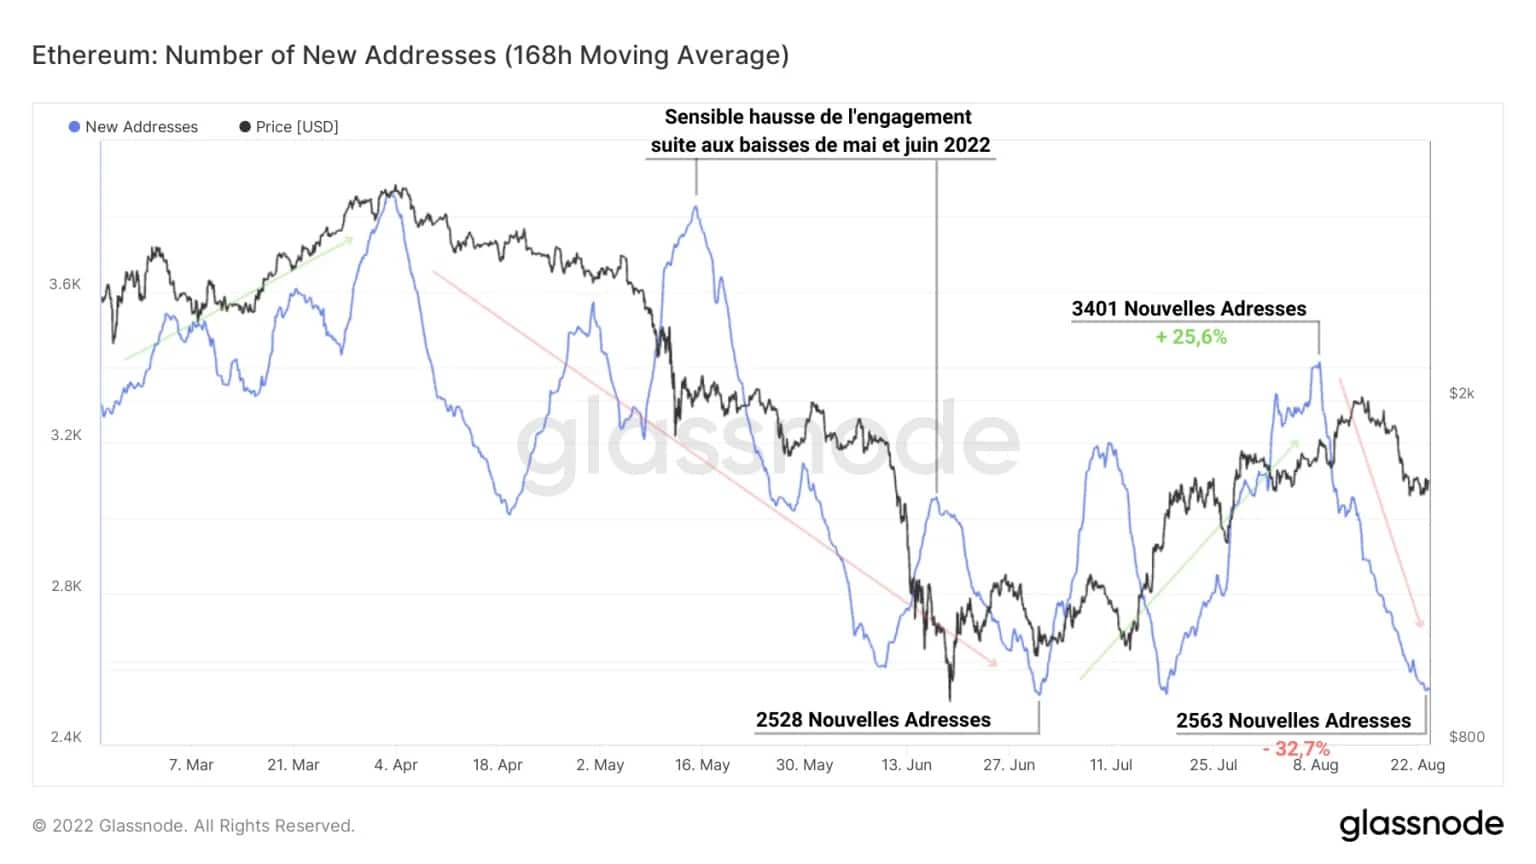
Figure 3: New addresses
In addition, the number of transactions per second, also known as the transaction rate, closely follows the trend of the active address measure, showing a sharp drop since August.
From 10.7 transactions per second (TPS) to 14.4 TPS in July, this metric now registers a rate of 12.1 TPS, a 19% drop since 1 August.
This decrease in user engagement on the channel signals a clear lack of interest, in stark contrast to the bullish narrative conveyed via the media and social networks.
While this is a cautionary tale in the short term, the psychology of holders, just weeks away from a structural change in Ethereum consensus, is difficult to predict and interpret. We will know more about the situation shortly. Until then, let’s be on our guard.
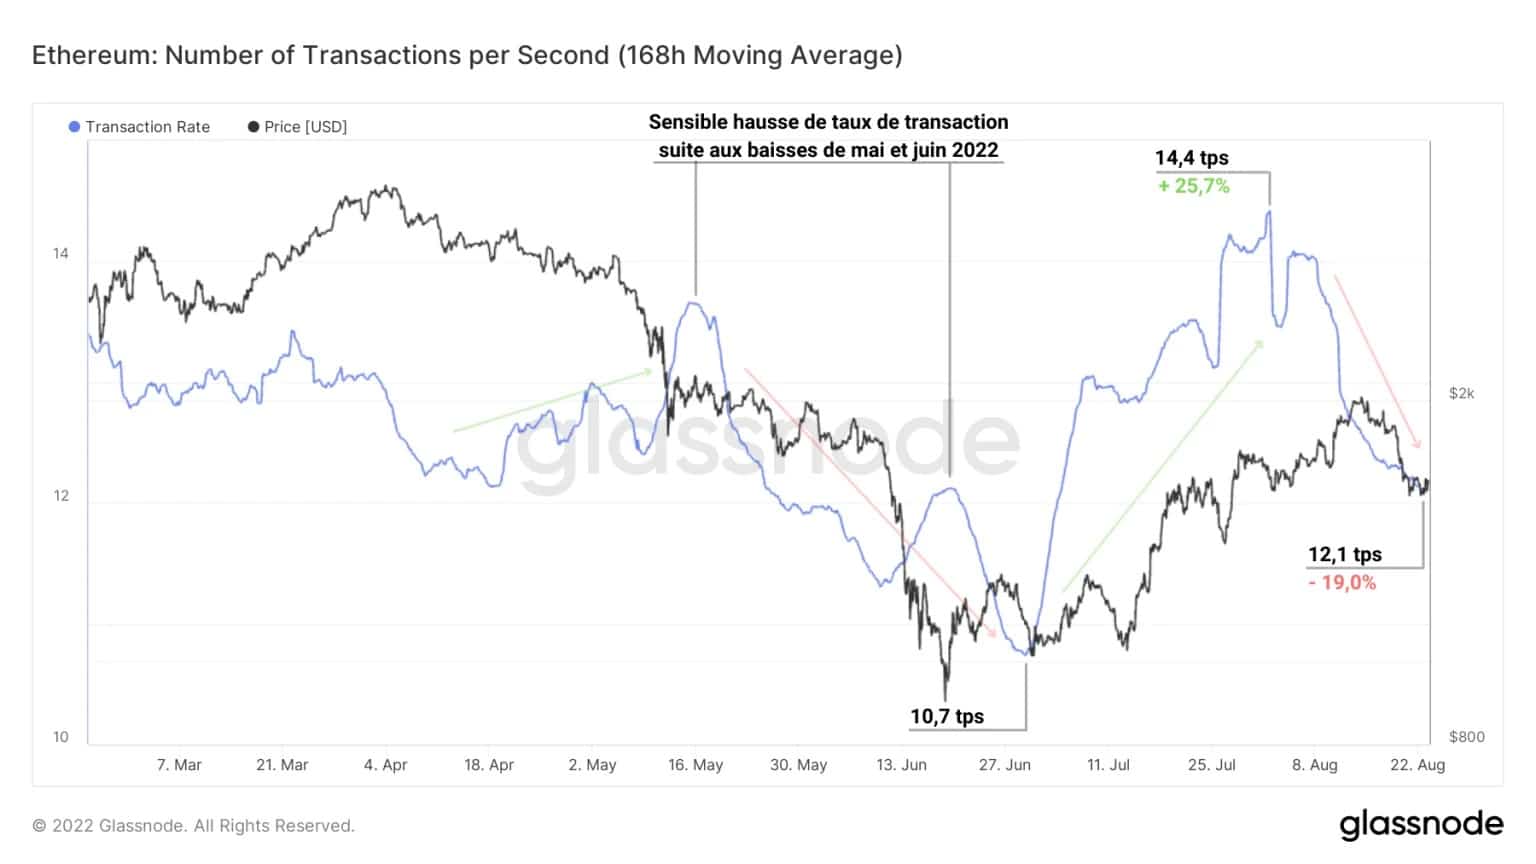
Figure 4: Transaction Rates
ETH 2.0 stakeholders under water
In anticipation of the Merge, Ether holders were given the opportunity to lock their coins into the ETH 2.0 depository agreement or with ETH 2.0 staking service providers such as Lido, Binance or Coinbase.
As a result, almost 13.3k ETH have already been locked up, representing more than 11% of the total outstanding supply, with a value of around USD 21 billion.
However, since a significant number of these deposits were made between 2021 and 2022, a significant portion of these ETH are now sitting on an unrealized and unrealizable loss, as the payout of locked-in ETH after the Merge will be gradual and controlled.
Although the potential selling pressure is reduced by locking in some of the coins held at a loss, it is still rewarding to assess the financial position of ETH 2.0 custodians.
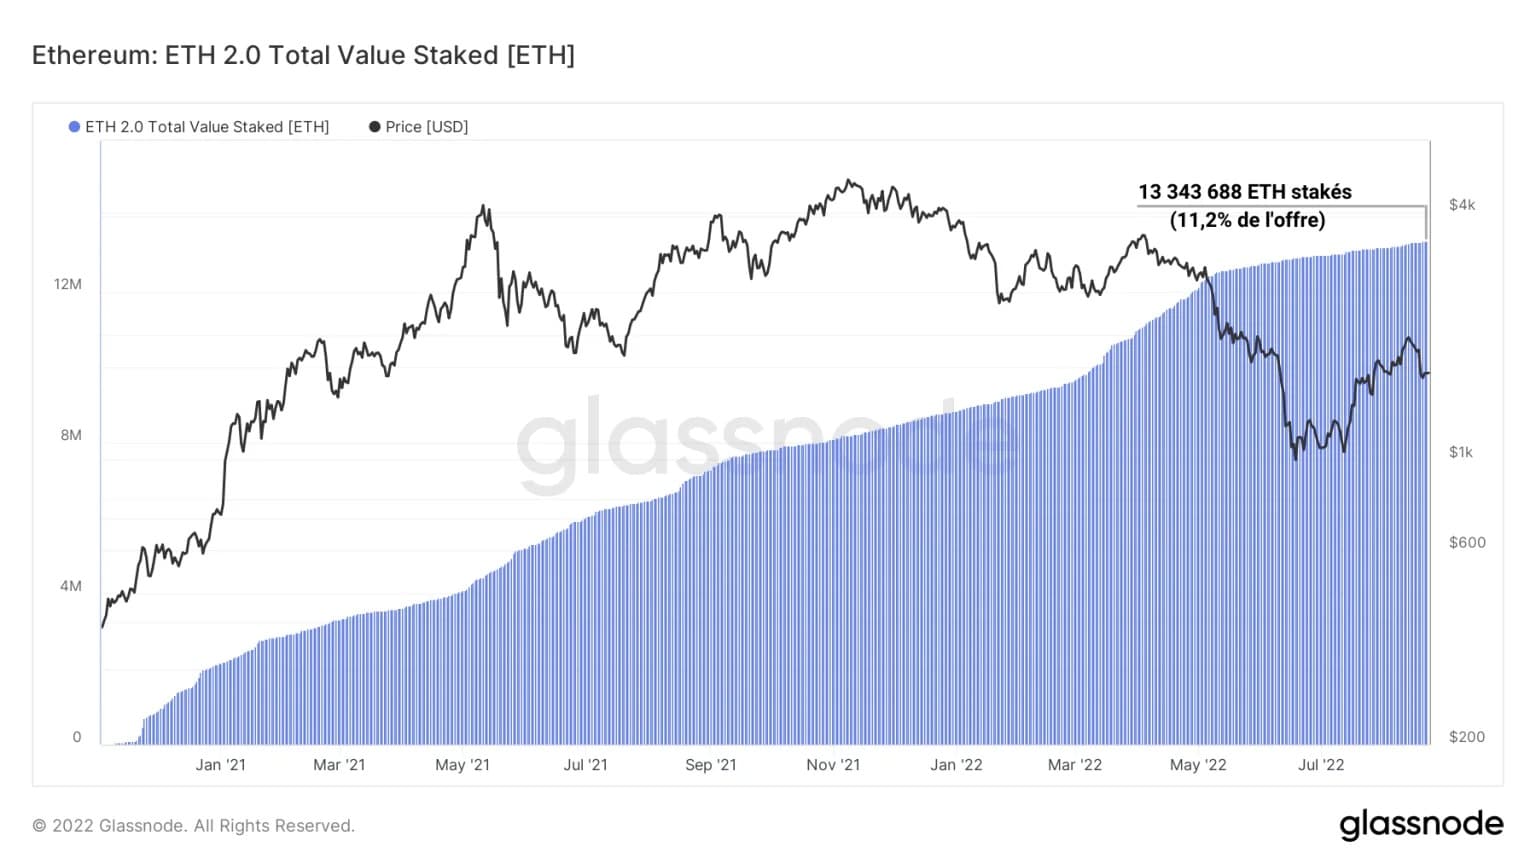
Figure 5: Locked-in offer in ETH 2.0 contract
Taking into account the price of an ETH at the time of its deposit into the ETH 2.0 contract, it is possible to calculate the realised price for ETH 2.0 (in purple). This measure represents the base cost of all ETH locked into the contract and serves as a proxy for assessing the profitability of deposits based on the spot price of Ether.
Looking at the chart below, it appears that since May 9, the ETH spot price has crossed the ETH 2.0 realised price from below. This indicates that the average custodian is now making a loss on their locked-in positions. While this is not selling pressure to worry about at the moment, it is something to keep in mind for the near future.
At $2,368, the realized price of ETH 2.0 tells us that the average custodian is taking a latent loss of about -30% on these stalled ETHs.
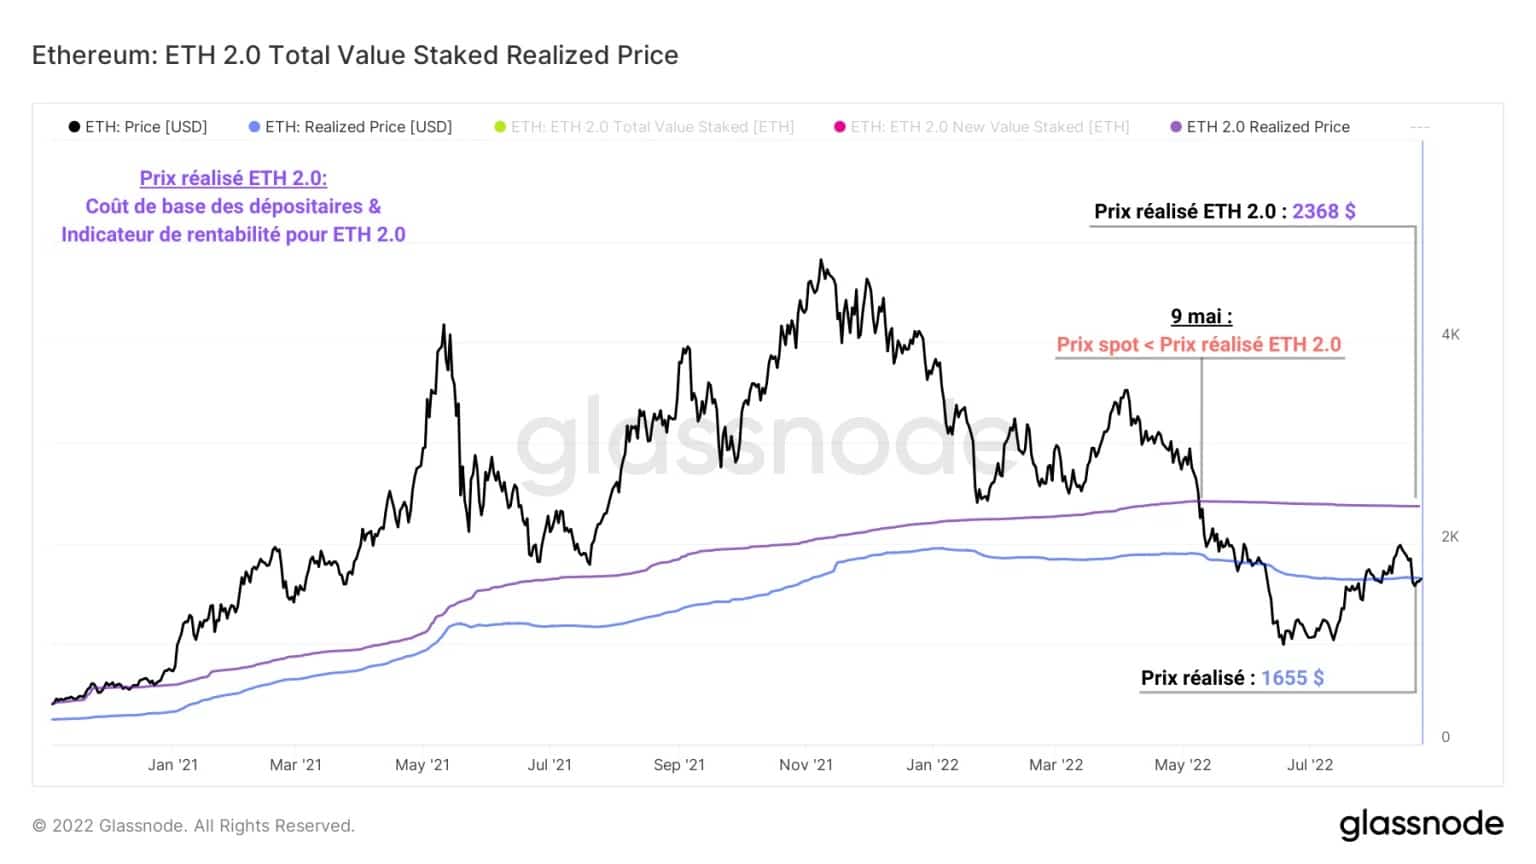
Figure 6: Realised price for ETH 2.0
Finally, by assessing the profitability – or otherwise – of ETH 2.0 filings, it is possible to see the periods when filings are made at a loss or profit.
What emerges from the study of the following graph is that from April 2021 to June 2022, the majority of the ETH sent on the contract have incubated a latent loss.
Indeed, it will be necessary to wait for the ETH price to visit the $1000 mark before participants buy back low-priced ETH and deposit them with an unrealised gain.
Currently, only a quarter (25.7%) of the Ethers deposited on the ETH 2.0 contract are in profit, signaling that a vast majority of depositors are underwater and have latent losses locked into the protocol.
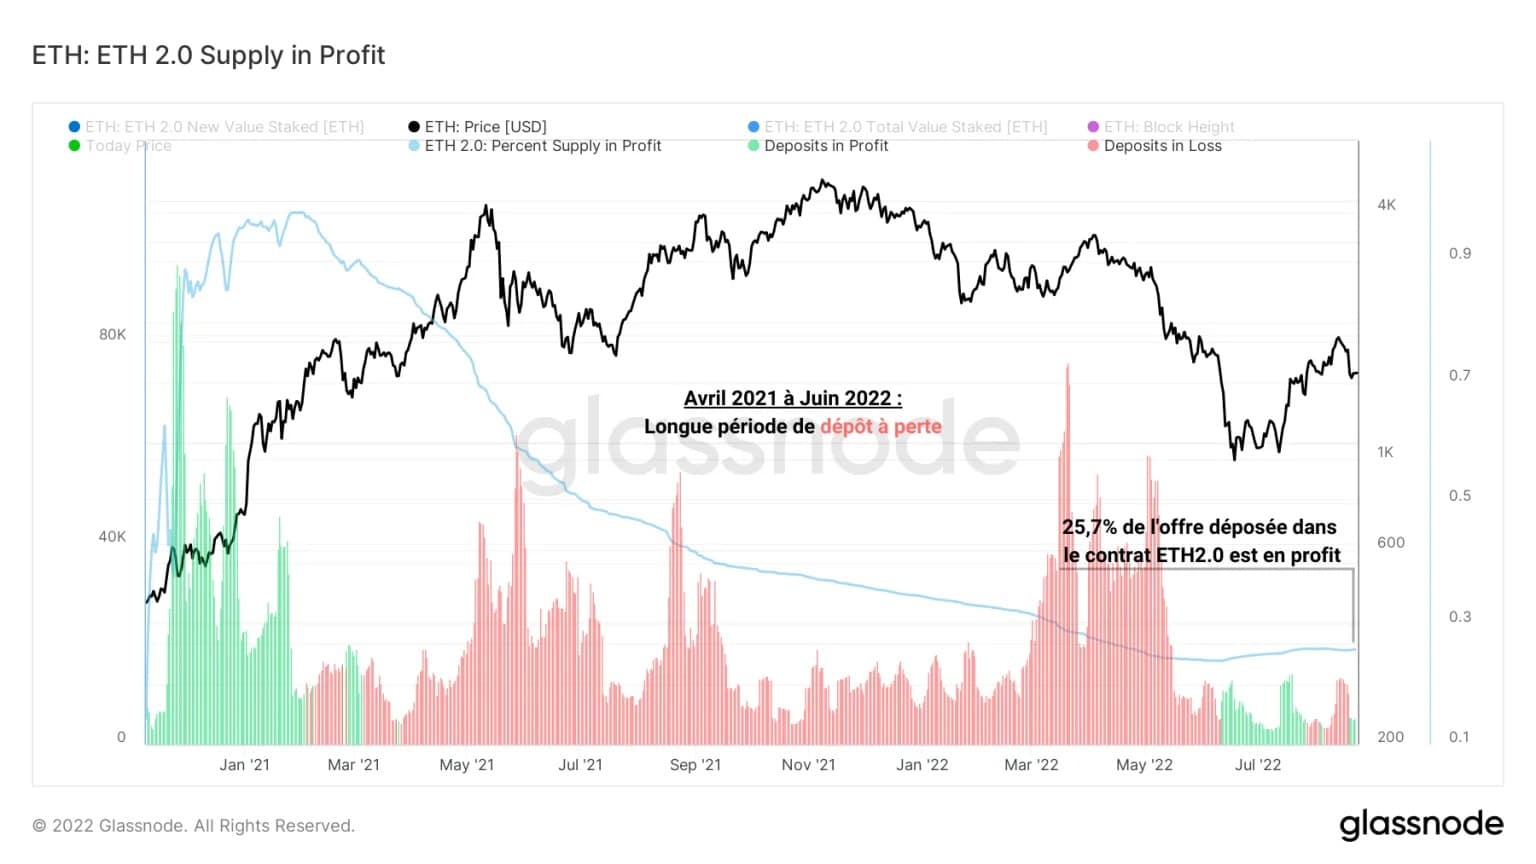
Figure 7: ETH 2.0 offering in profit
Summary of this onchain analysis
In sum, this week’s data paints a bleak picture for the fundamentals and near-term action of the Ether. Given the imminence of the Merge and the uncertainty of future events in response to the passage of this stage, these observations will be worth testing and testing in future analysis.
A notable drop in onchain activity on Ethereum is evidence of insufficient participant engagement and a lack of new entrants.
Furthermore, the study of the profitability of ETH deposits on the ETH 2.0 contract highlights the fact that the majority of custodians are making losses on their locked positions, without this creating selling pressure as their funds are locked into the contract until the Merge has passed.
Sources – Figures 2 to 8: Glassnode
Access the full analysis of Prof. Chain via our private group: The Grille-Pain
Take advantage of a month’s 40% discount to test our service at a reduced price with the code PROF when you sign up