
While the lower bound of the $18,000-$24,000 range has acted as a robust support to recent bearish market moves, the market is about to embark on a structural dynamic change that will take several months to unfold. Onchain analysis of the situation
Bitcoin finds its footing and rebounds to the $18,000 level
After failing to break above the $24,000 level, Bitcoin’s price began a fall leading it once again to the 2021 – 2022 cycle bear market price floor.
Following a test of the $18,000 level on 6 September, the market experienced a bullish impulse leading it towards $22,000, signalling a return of demand in the short term, with six consecutive green candles at the time of writing.
BTC is now trading in a range, with the low ($18,000) and high ($24,000) tested repeatedly, so it remains to be seen which end of the range BTC will break out of.
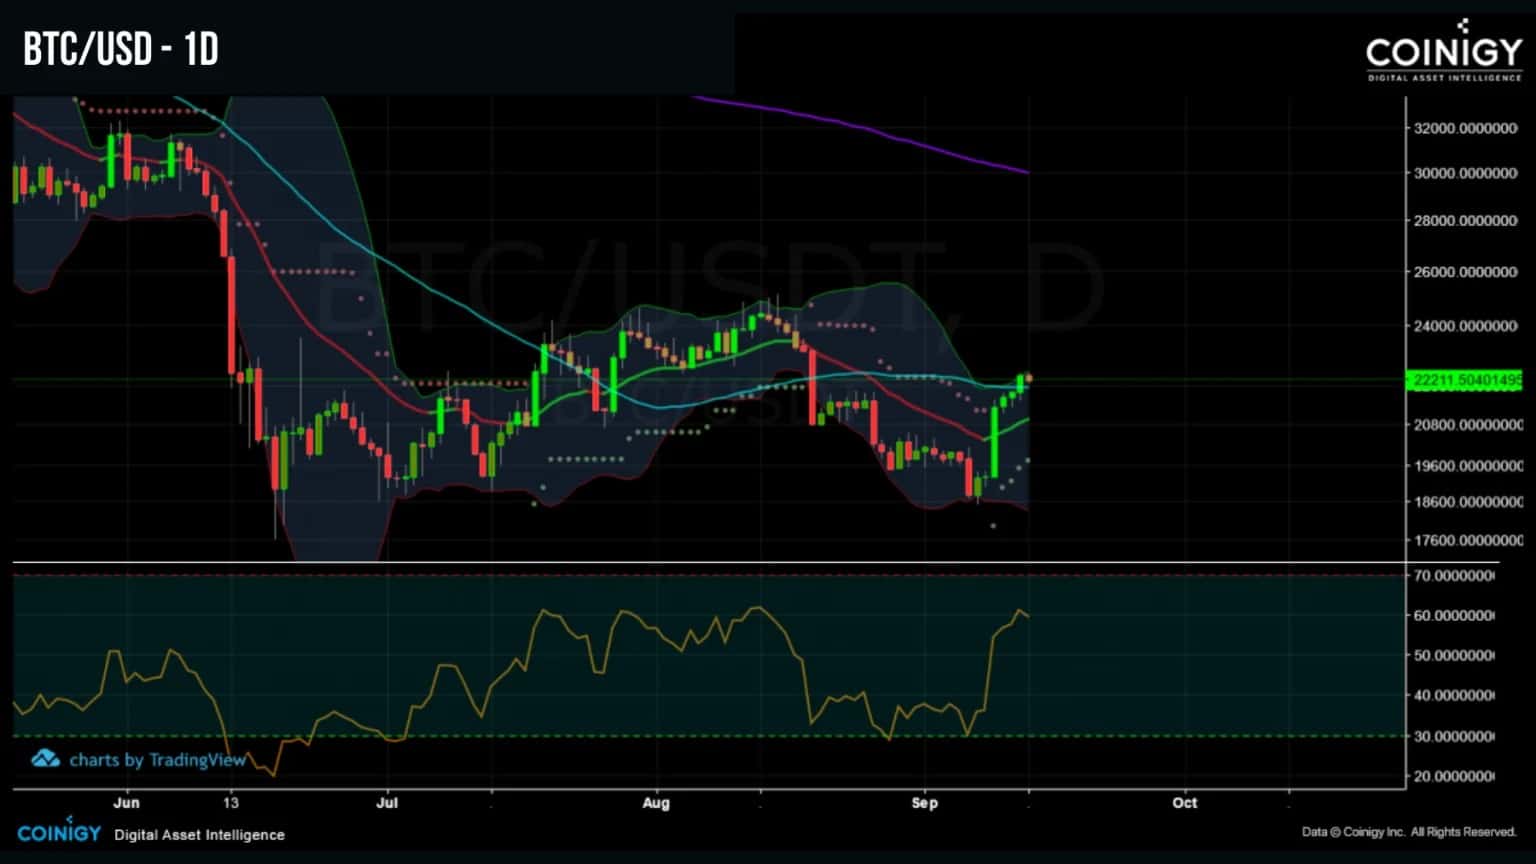
Figure 1: Daily BTC price
This week, in order to determine how the bear market floor is developing, we will be looking at:
- the profitability dynamics of participant spending;
- several models of onchain floors, both short and long term.
Loss taking is diminishing
Although BTC has returned to seek $18,000, participants have not shown any particular willingness to exit the market or take losses over the past week (to sell).
Indeed, while bear markets are characterised by strong loss selling behaviour, only a few hundred thousand dollars in losses have been recorded daily since the end of August, a minimal loss taking given the low price levels and broad capitulations of May and June.
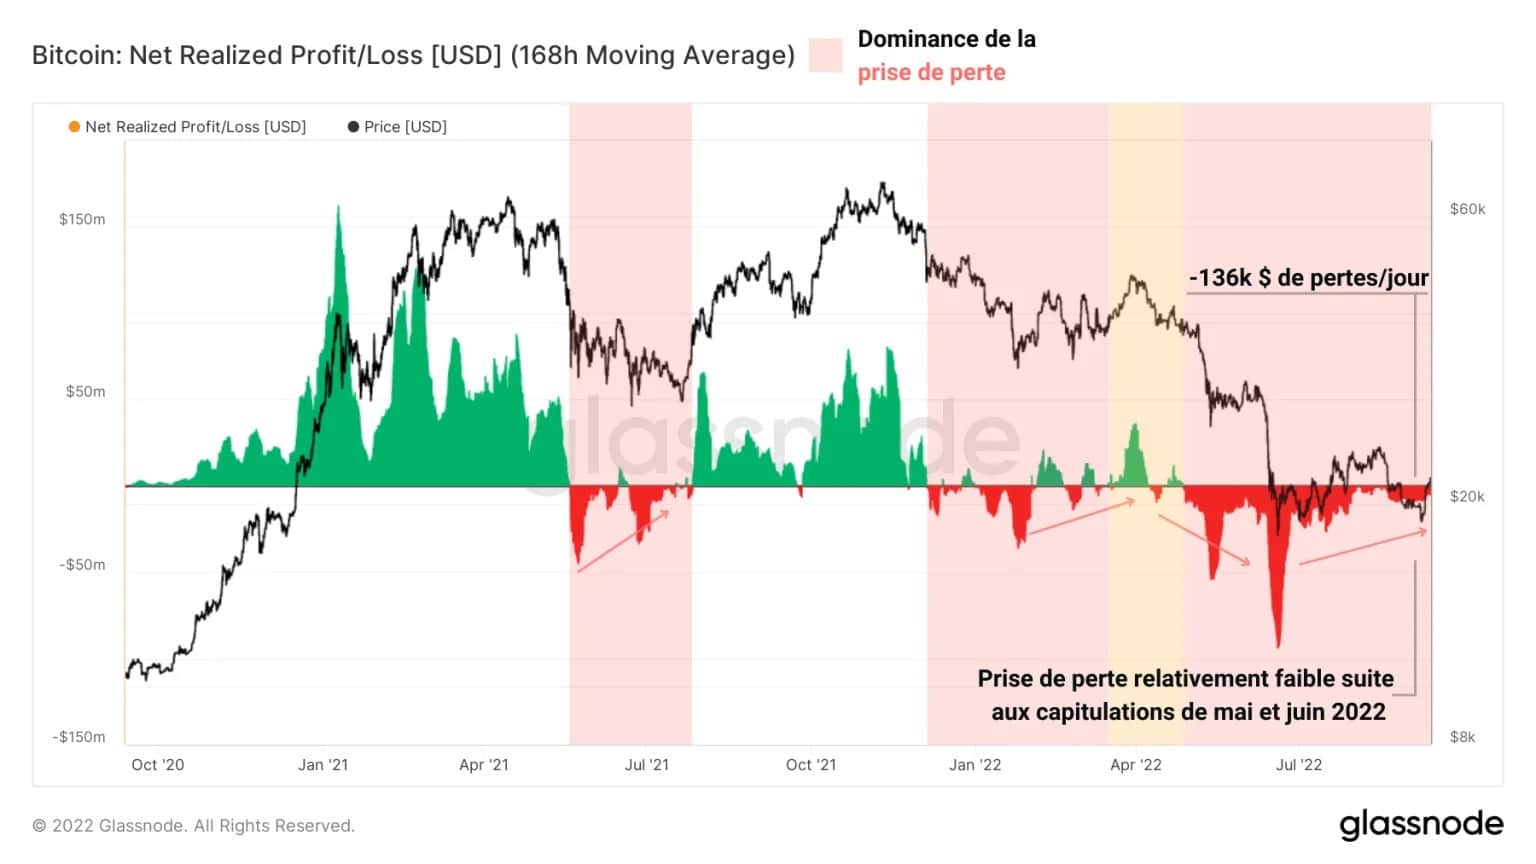
Figure 2: Net Realised Profits/Losses
This decrease in loss realization is one of the dynamics that could allow for a return to profit selling should the BTC price break the $24,000 level in the near future.
However, we should not sell the bear before we have killed it, as we are not out of the woods yet.
Indeed, as long as the profitability of expenses ratio (SOPR) does not return to positive values (SOPR ☻ 1), a constructive long-term uptrend is not to be expected.
As we have highlighted since the beginning of August, the test of this crucial pivot point has led to a failure of the bullish recovery as participants have preferred to exit the market by selling close to their cost base rather than take the risk of a return to current price levels.
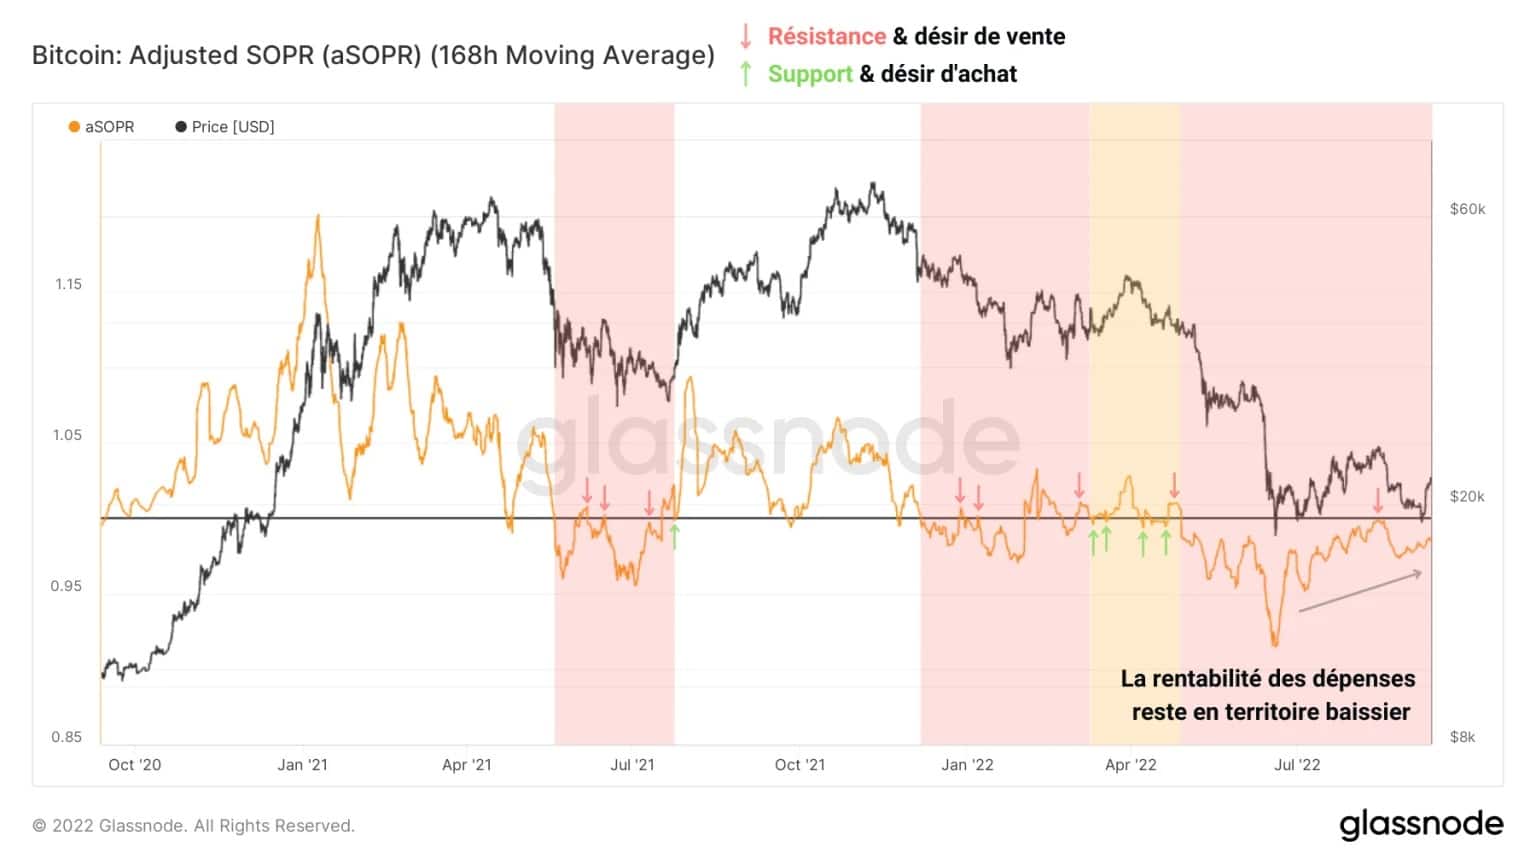
Figure 3: Expense ratio
That said, despite this rejection of the neutral zone (SOPR = 1), this metric shows an encouraging uptrend, while remaining firmly in bearish territory for now.
As a result, the selling pressure on the BTC price is diminishing as participants are making fewer losses, making it less likely that the $18,000 level will be breached from below.
If you want to get into the market and buy bitcoin this could be an interesting entry point.
Multiple bottom indicators
In addition, several models based on on-chain indicators seem to signal that a bottom is forming.
We can, via the profitability of short-term holders’ supply (STH), create an indicator identifying local market bottoms and thus potential reversal points following short-term price declines.
By selecting periods when more than 98% of the volume of BTC held by STHs is in a loss-making state, we can isolate local lows (in green) particularly effectively in order to highlight potential entry points during high bearish volatility events.
For example, last week this indicator signalled a new local low, when the BTC price returned to test the current bear market floor at the $18,000 level.
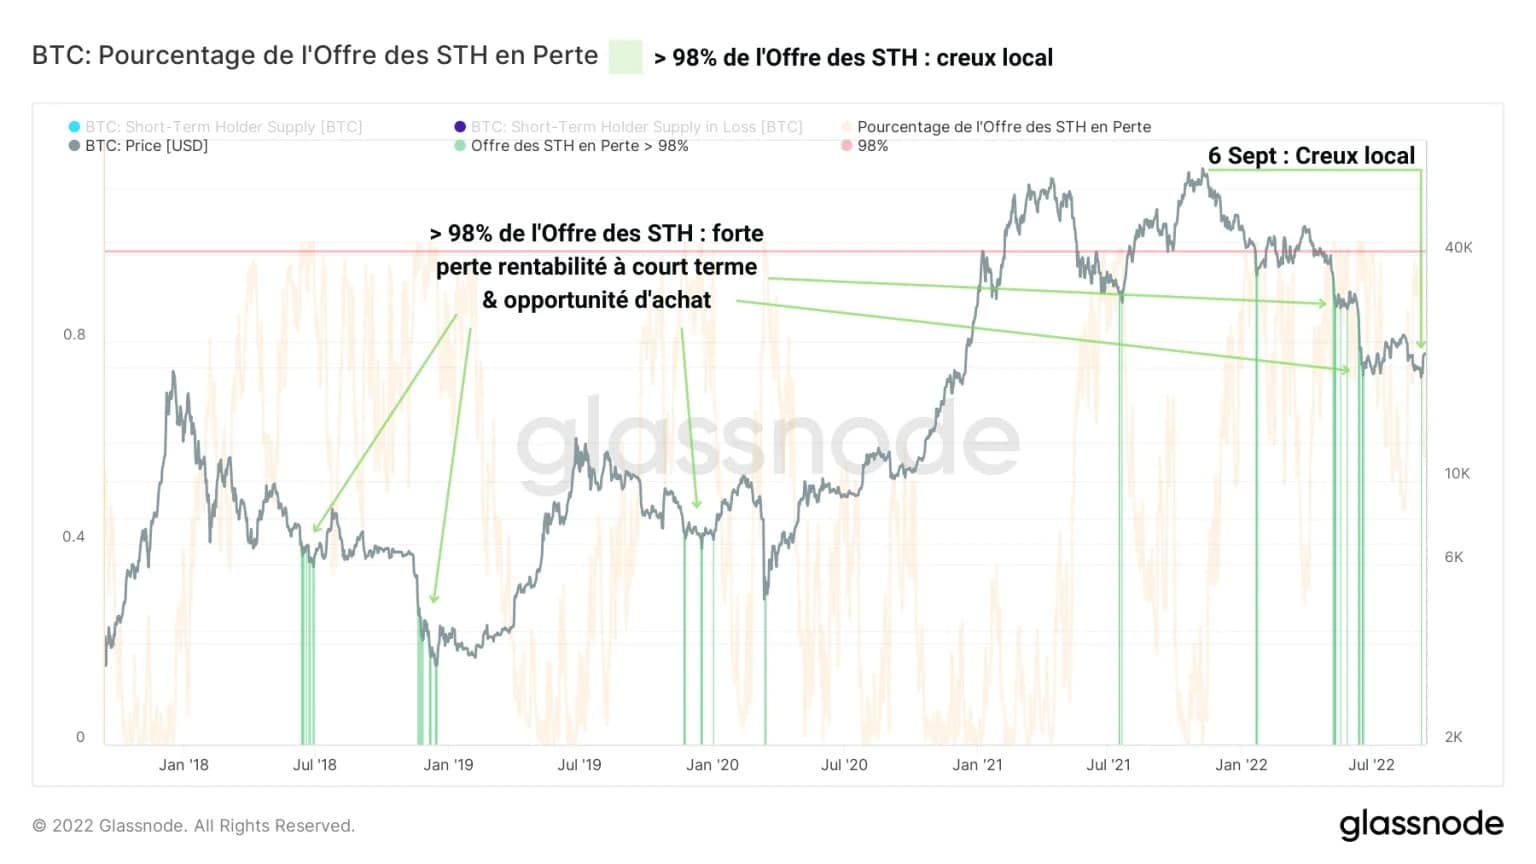
Figure 4: Supply of short term holders in a loss-making state
This does not necessarily mean that the bear market is over, it was a relatively good entry point to open a long (bullish) position in the short term.
Even more, using a model based on the interaction of the realised prices of the STH (< 155 jours) et des LTH (> 155 days), we can identify transitions between the final phases of bearish cycles and the early phases of bullish cycles.
As realised prices represent the average purchase price of BTC acquired by a certain cohort of participants, they represent their cost base and are a way to study their buying/selling behaviour and profitability.
Thus, in all previous bear cycles, when the realised price of STH (pink) crossed the realised price of LTH (blue) on the downside, this indicated a build-up of short-term BTC near the bear market floor, signalling significant investor interest despite poor price performance (purple).
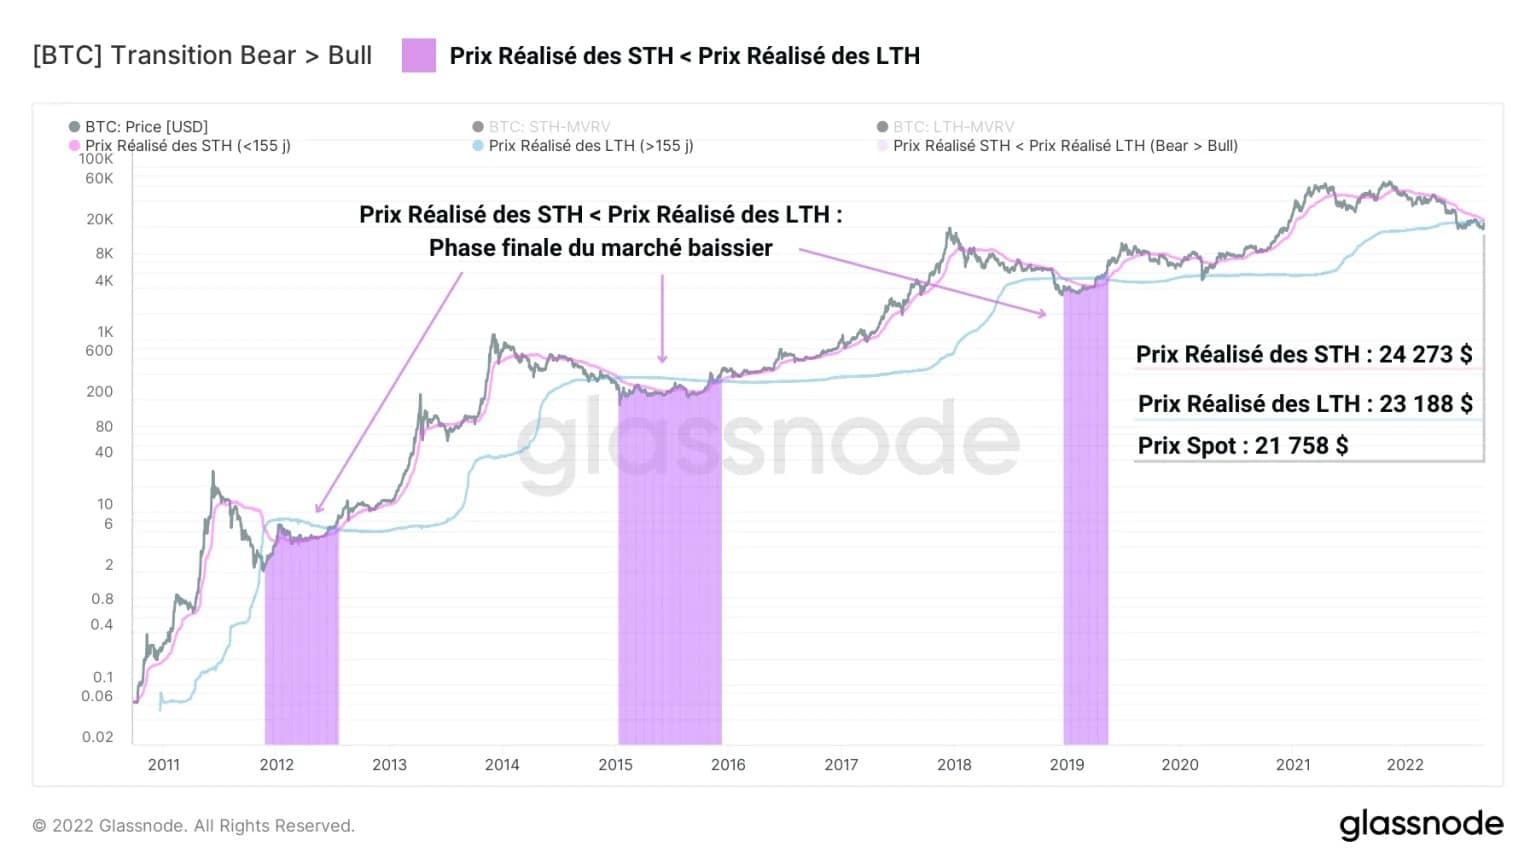
Figure 5: Realised prices of short and long term holders
Currently, the realised price of STH is almost $900 above the realised price of LTH, indicating that we are not far from entering the bear ☻ bull transition phase that investors have been waiting for for almost two years.
It should be noted, however, that this transition takes several months to settle in. During this time, HODLing’s behaviour (no selling) and the conviction of buyers are being tested.
Finally, the relationship between the BTC price and the strength of the DXY dollar index allows us to establish a clear link between the two assets of the BTC/USD trading pair, which is considered to be the most observed by private and professional players.
It can be seen on the chart below that each fall in the dollar, highlighted by a bearish divergence in the RSI (green), has given rise to strong bullish movements for the Bitcoin and cryptocurrency market.
It is therefore timely to highlight the current bearish divergence in the DXY RSI, which has been in the process of forming since May. Although it has not yet resulted in a fall in the price of the USD, this dynamic should be watched closely for the next few months as it may catalyse the birth of a future bull market.
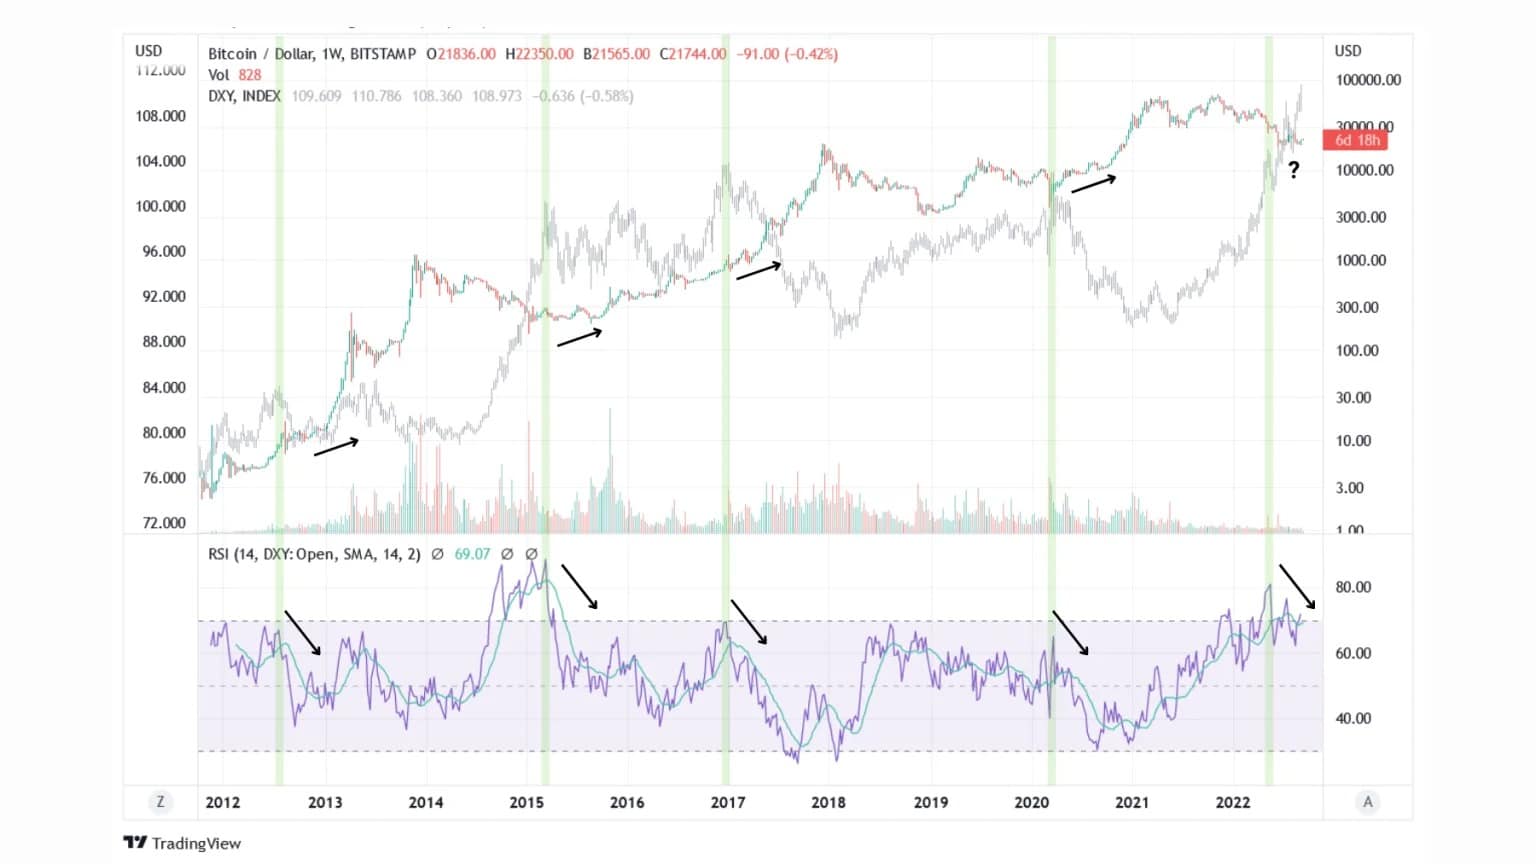
Figure 6: BTC/USD pair and DXY + RSI Index
That said, let’s be cautious. Since Bitcoin is moving for the first time in the context of Quantitative Tightening (QT), the opposite of Quantitative Easing, and uncertainties on energy and geopolitical dimensions, we cannot know how it will react in the context of major adversity.
Summary of this onchain analysis
In summary, this week’s data indicates that, despite the slight loss taking and the deteriorating macroeconomic and geopolitical backdrop, the lower bound of the $18,000-$24,000 range has acted as a robust support to the market’s recent bearish moves.
In addition, the loss of profitability of BTC held in the short term and the bear ☻ bull transition pattern allow us to determine that a local low has occurred at the $18,000 level and that the market is about to begin a structural change in dynamics that will take several months to implement.
Finally, potential future weakness in the dollar, foreshadowed by a bearish divergence in the DXY’s RSI, could support the BTC/USD pair in the near future.
Access Prof. Chaîne’s full analysis via our private group: Le Grille-Pain
Get one month with 40% discount to test our service at reduced price with the code PROF when you register.
Sources – Figures 2 to 5: Glassnode; Figure 6: Tradingview