
This week, The Merge will mark a major turning point in the history of the Ethereum blockchain (ETH). What could be the consequences of this event on the ETH price?
Ethereum (ETH) is gearing up for The Merge, its biggest update since its inception
With just hours to go before its update to The Merge, the price of Ethereum (ETH) has been moving since June within a range bounded by two distinct bounds at $1,000 and $2,000. These areas are round levels, which reflects the psychology of investors in the market quite well.
So with this big event coming up on September 15 on the Ethereum blockchain, are we going to see the traditional “buy the rumor, sell the news” with a new drop in price, or are we going to see a bullish acceleration in price?
Let’s take a look at the clues provided by the various technical indicators, in order to have a potential idea of the evolution of the ETH for the next few weeks
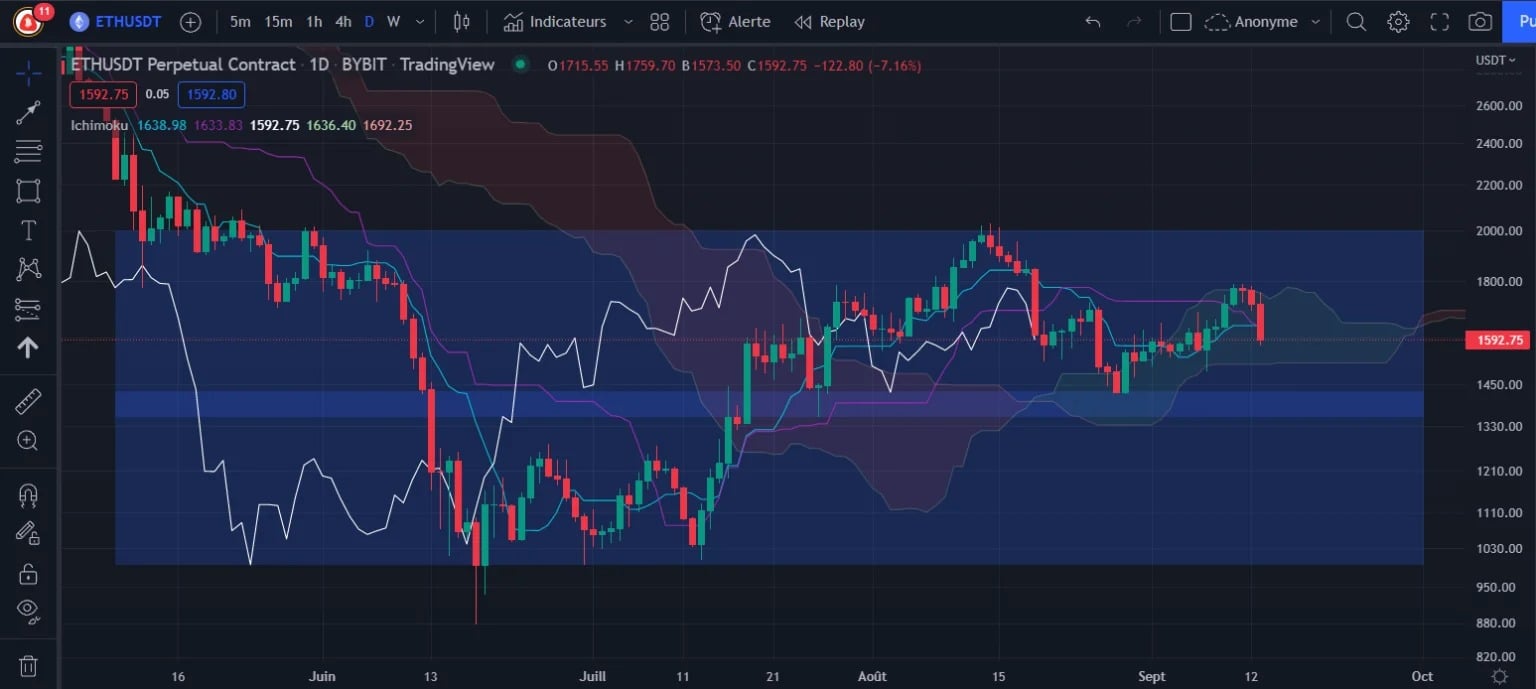
Figure 1: Ethereum price chart (Daily), in range since June 2022
First, let’s look at the Price Action. After bouncing off the $1,000 area three times, the price of Ether then built significant support corresponding to the middle of the range at $1,500.
This area has allowed the price to recover since the beginning of September, which should in theory allow a return to the top of the range at $2,000. In order to keep this target, the last low at $1,500 must be held and a new high made, otherwise we risk confirming the establishment of a new low in relation to the previous one, and therefore a new downtrend within this range.
From the Ichimoku point of view, the price is under resistances, blocked under the Kijun and under the top of the cloud. It will be necessary to get back above these obstacles at $1,800 to make a way and aim for a more serene return towards the top of the range. For the moment, the direction is neutral and we are waiting to see if the cloud can be pierced again.
Ethereum (ETH) is in an ascending wedge that started in June
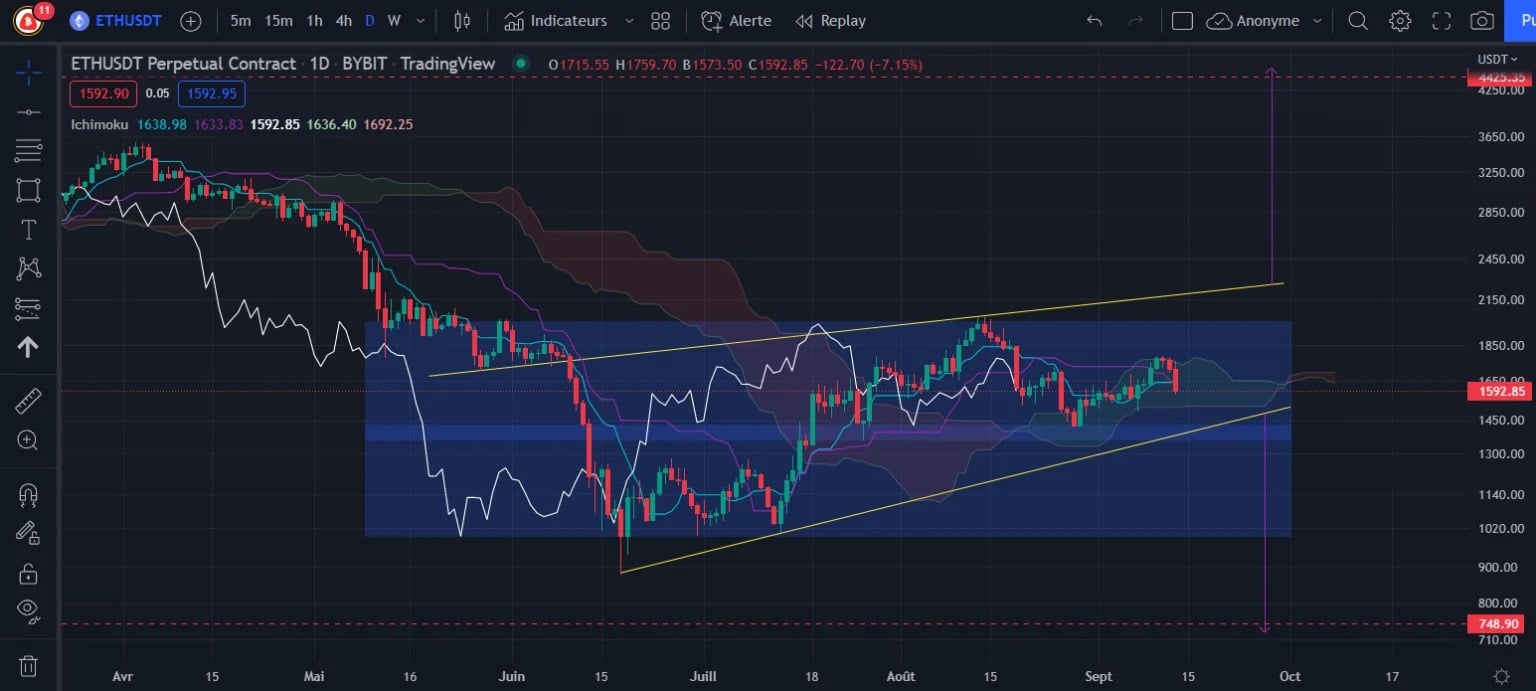
Figure 2: Ethereum price chart (Daily), showing an ascending wedge
From a chartist perspective, we are still clearly in a bearish trend with lower and lower highs and lower and lower lows. Despite an attempt to get back above the last high point, the price failed to close above the previous high.
A rejection was made below the upper bound of an ascending wedge in which the price is moving upwards, with a low trendline right in the middle of the range at $1,500.
This type of chartist pattern usually breaks from below, so it is essential to hold this double support or risk visiting the bottom of the range at $1,000, or even the objective of breaking the pattern at $750. If the update goes smoothly and the price manages to hold before breaking the wedge from above, then the target will be around $4,425.
Join our group with Vincent Ganne and our fundamental and on-chain experts on the Pain Grid. Our experts deliver daily exclusive information and analysis on the crypto market to optimize your knowledge!
Conclusion on ETH price and The Merge
With just a few hours to go before its major update The Merge, Ether is thus showing signs of converging rejections below the upper range resistances.
The $1,500 area must not give way on its likely retest, otherwise a bearish target will be triggered with a risk of falling below $800 if the range breaks from below.
On the upside, a return to $4,425 could be envisaged but with many resistances still on the way. In any case, the break of the wedge will give us a relevant target for the longer term.