
Moderate distribution behavior set in during February, when BTC stalled at the $24,000 level.
Small inflows and small volumes are flowing into the exchanges, motivated by profit taking and a potential doubt about the sustainability of the current trend reversal.
Bitcoin retraces below $22,000
Following the rise at the beginning of the year, the price of Bitcoin (BTC) has hit a resistance zone between $24,000 and $25,000.
Short-term investors took profits in the $21,000 to $24,000 price range in early February.
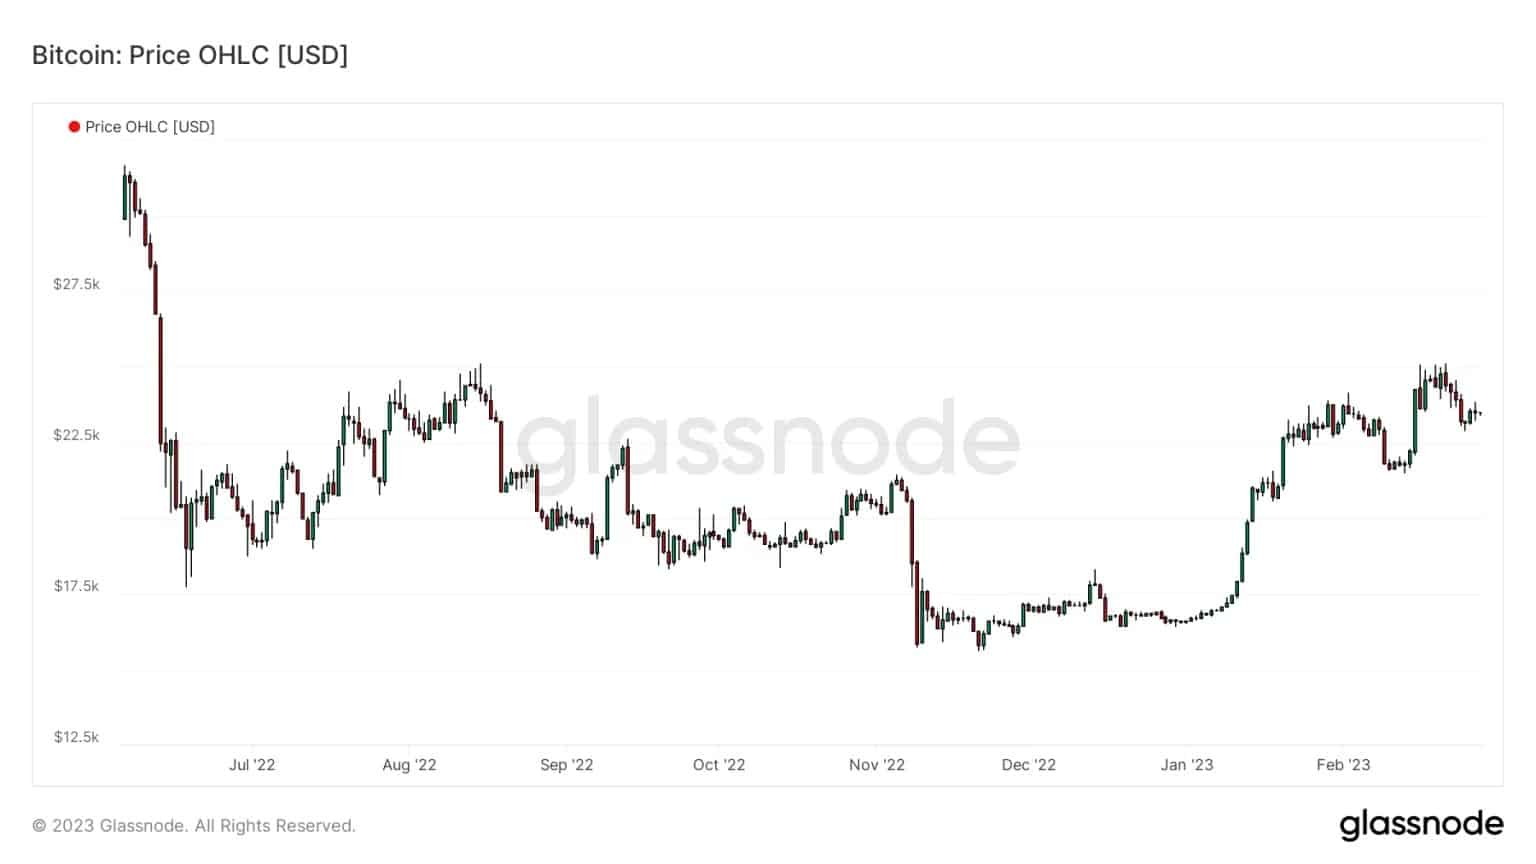
Figure 1: BTC daily price
The market has entered a moderate distribution phase towards the exchanges, which is part of a cyclical behavioural pattern, reflecting a doubt among some participants as to the sustainability of the current trend reversal.
Today, we will look at this behaviour in detail with a lot of data on exchange flows.
BTC behavioural cycles
The transitions between the end of a bear market and the beginning of a bull market are marked by a series of behaviours that seem to repeat themselves, cycle after cycle.
Using the accumulation trend score, which measures the level of accumulation or distribution of Bitcoin addresses, we can get a visual representation of these dynamics, divided into 3 phases:
- an accumulation of BTC near the bottom (opportunism), when new entrants are attracted by the falling price;
- a distribution during the transition between the end of the bear market and the beginning of the bull market (doubt), when entities leave the market due to lack of confidence in the short term;
- an accumulation at the beginning of a bull market (FOMO), when investors are afraid the train will leave without them.
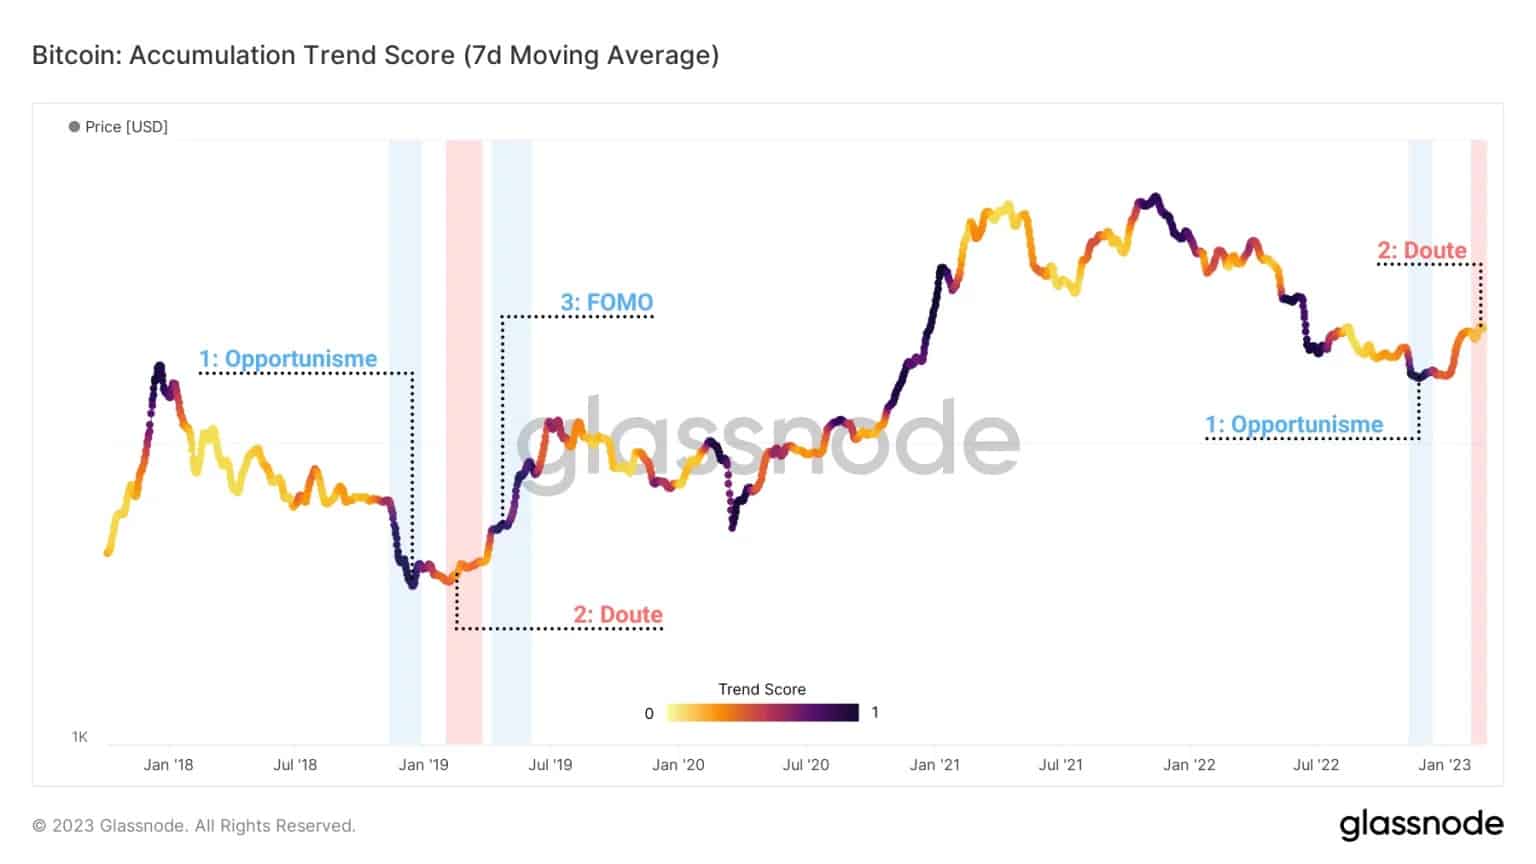
Figure 2: Accumulation trend score
The current value of this metric (ATS = 0.03) indicates that a net distribution is taking place within several Bitcoin address groups.
By separating this metric into the different wallet sizes that exist on the network, we can study a clear visualization of the behaviors of the entities that make up the BTC market.
- A score tending towards 1 (blue colour), indicates a net accumulation;
- A score tending towards 0 (red colour), indicates a net distribution.
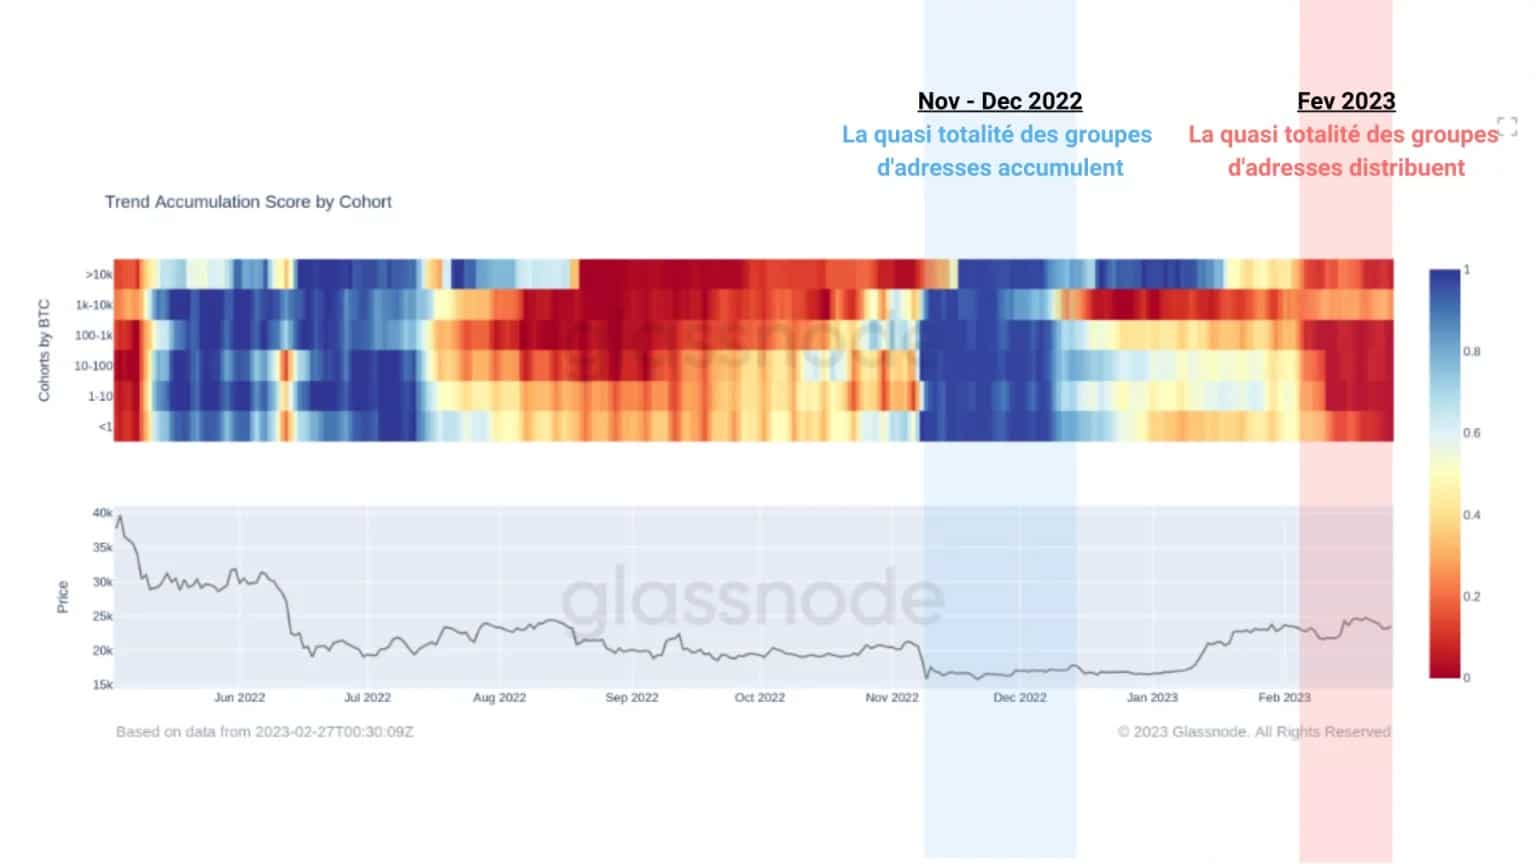
Figure 3: Accumulation trend score, by address cohorts
In doing so, we can observe several opposite behavioural phases in recent months:
- A very strong accumulation in November and December 2022, when BTC was bottoming out at $15,700;
- A near-unanimous distribution of address groups during February, during the recent market rally towards the $24,000 – $25,000 resistance range.
This suggests that some entities have taken advantage of the recent appreciation of BTC to engage in profit taking.
Moderate distribution to exchanges
Measuring the net transfer volume (inflows – outflows) of exchanges, it appears that the end of February saw an inflow of around 2,000 BTC per day, although the trend has slowed over the past week.
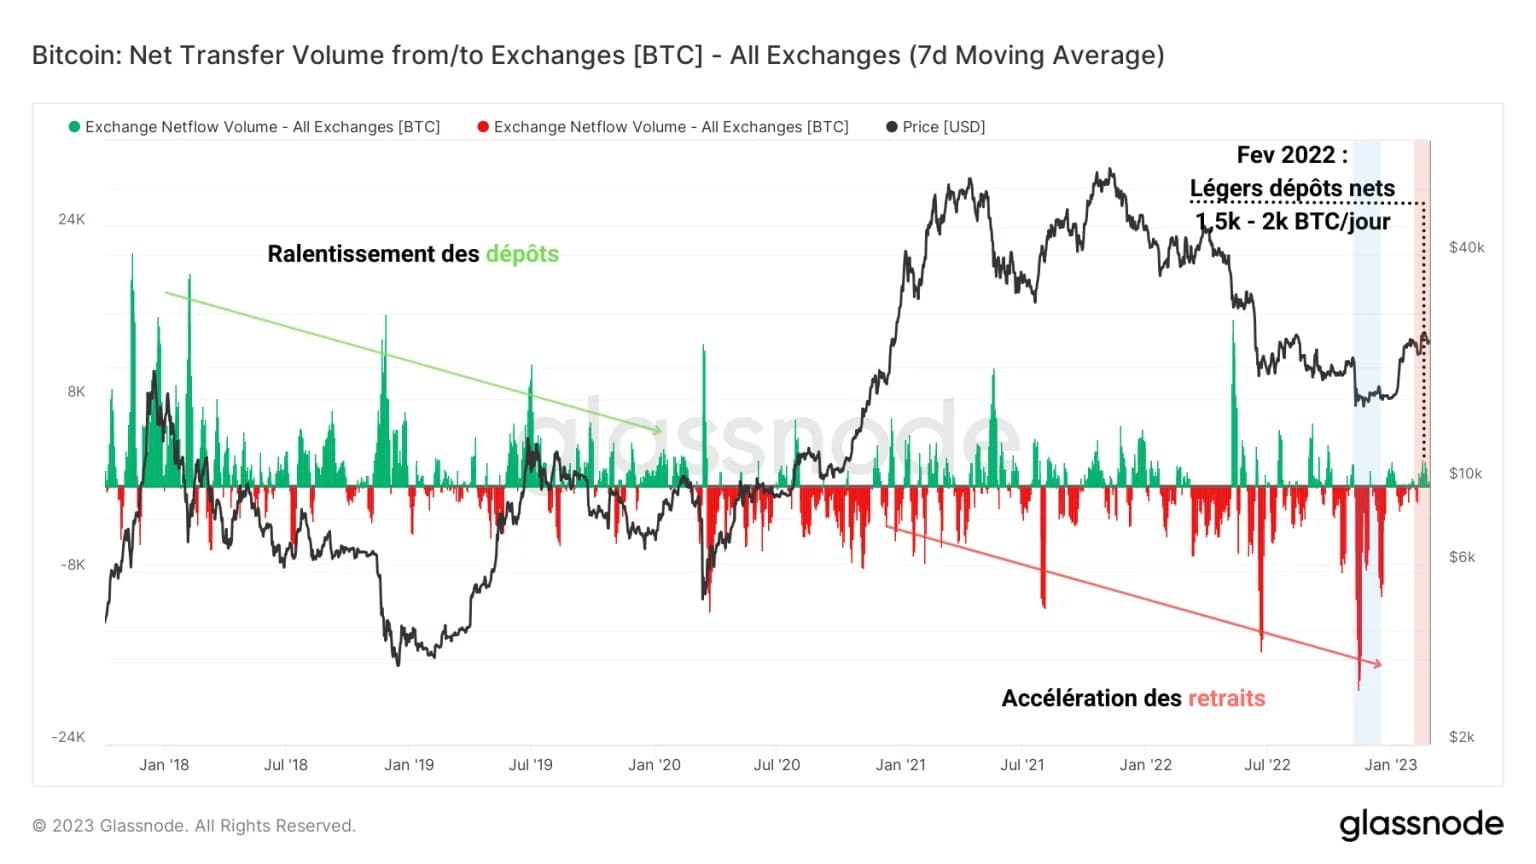
Figure 4: Net flow from exchanges
This slight uptick in deposits takes place within an overall dynamic of accelerating withdrawals after March 2020, as the market increasingly favours the autonomous holding of BTC, driving up the numbers of so-called sovereign coins.
The following chart provides a volume breakdown of net inflows/outflows from exchanges, allowing us to visualise the dominant volume sizes over a given period of time.
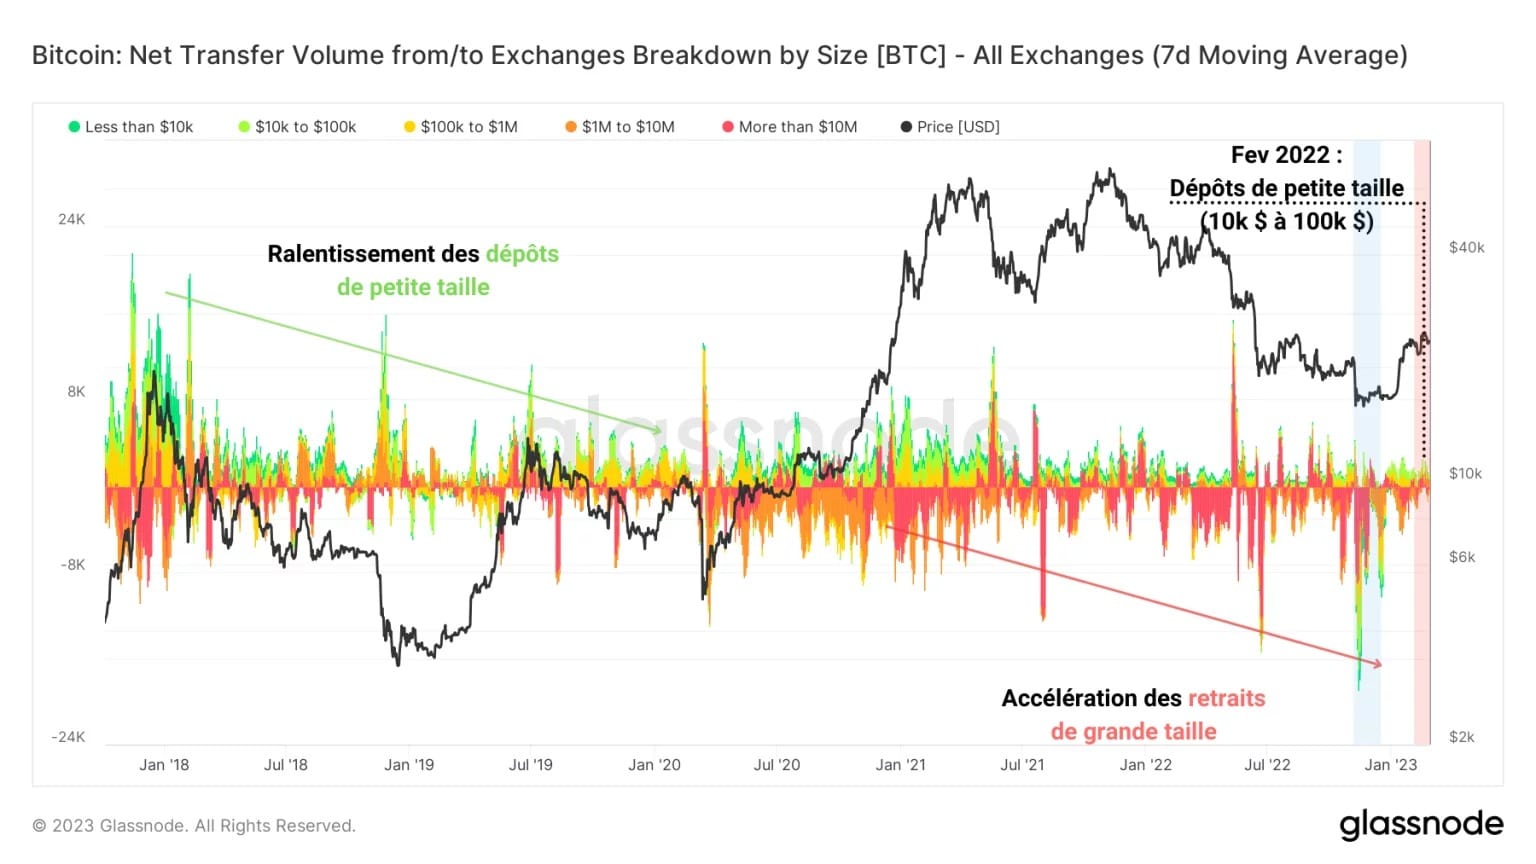
Figure 5: Net flow of exchanges, by size
Over the past five years, the market has witnessed a significant drop in small deposits (from less than $10,000 to $100,000), followed by an increase in large withdrawal volumes (above $1 million).
This explains the downward trend in exchange reserves, which have seen inflows shrink and outflows grow increasingly since March 2020.
In the last two weeks, however, small deposits, mostly in the $10,000 to $100,000 range, have been recorded, suggesting that the entities responsible for the recent distribution are mostly short-term holders.
To confirm this observation, we can look at the recent profit/loss volumes sent from the addresses of short term holders (STH) to the exchanges.
The following chart provides evidence that a significant amount of transfer volume, mostly held in profit, left the STH portfolios in January and February 2023 to be deposited on the exchanges.
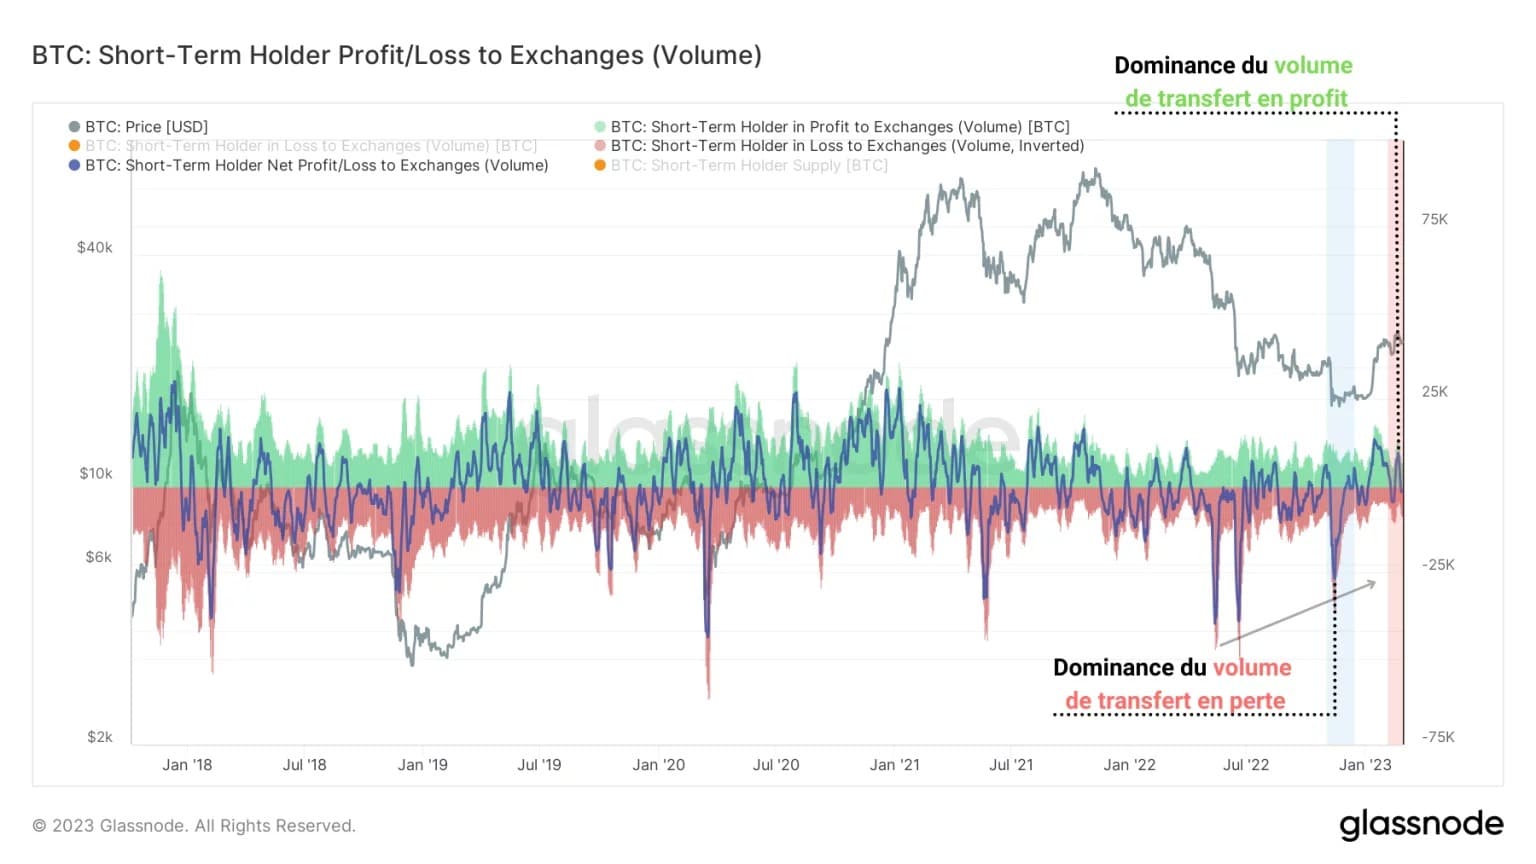
Figure 6: Volume in profit/loss from STH to exchanges
Coinciding with the rise in the BTC price, this behaviour indicates that short-term profit taking has taken place, and corroborates the data from our previous analysis.
Last week, nearly 13,000 BTC with latent profits were routed to the centralized trading platforms from STH.
Currently, volumes indicate that a net loss of about 2,500 BTC are flowing to the exchanges from these addresses, indicating that the decline has caused a slight loss to be taken.
Summary of this on-chain analysis of BTC
Overall, this week’s data suggests that a moderate distribution pattern took hold during February, when BTC stalled at the $24,000 level.
Small inflows and small volumes are flowing into the exchanges, with the vast majority of BTC less than 6 months old, associated with short term holders.
With much of this volume being held in profit, it appears that this distribution movement has been motivated both by profit taking and by potential doubt as to the sustainability of the current trend reversal.