
The use of the Ethereum blockchain (ETH) seems to be evolving with the trends of new technologies, favoring or limiting risk according to the cycles of the ETH price. Currently, users are moving away from DeFi and NFT-related transactions to stablecoins. On-chain analysis of the situation
2021 – 2022: The evolutionary cycle for Ethereum
Since the success of The Merge and Ethereum’s transition from Proof-of-Work (PoW) to Proof-of-Stake (PoS) on September 15, 2022, the price of Ether (ETH) has fallen from $1,633 to $1,214, down -24.3% since The Merge and -74.6% since the ATH in November 2021.
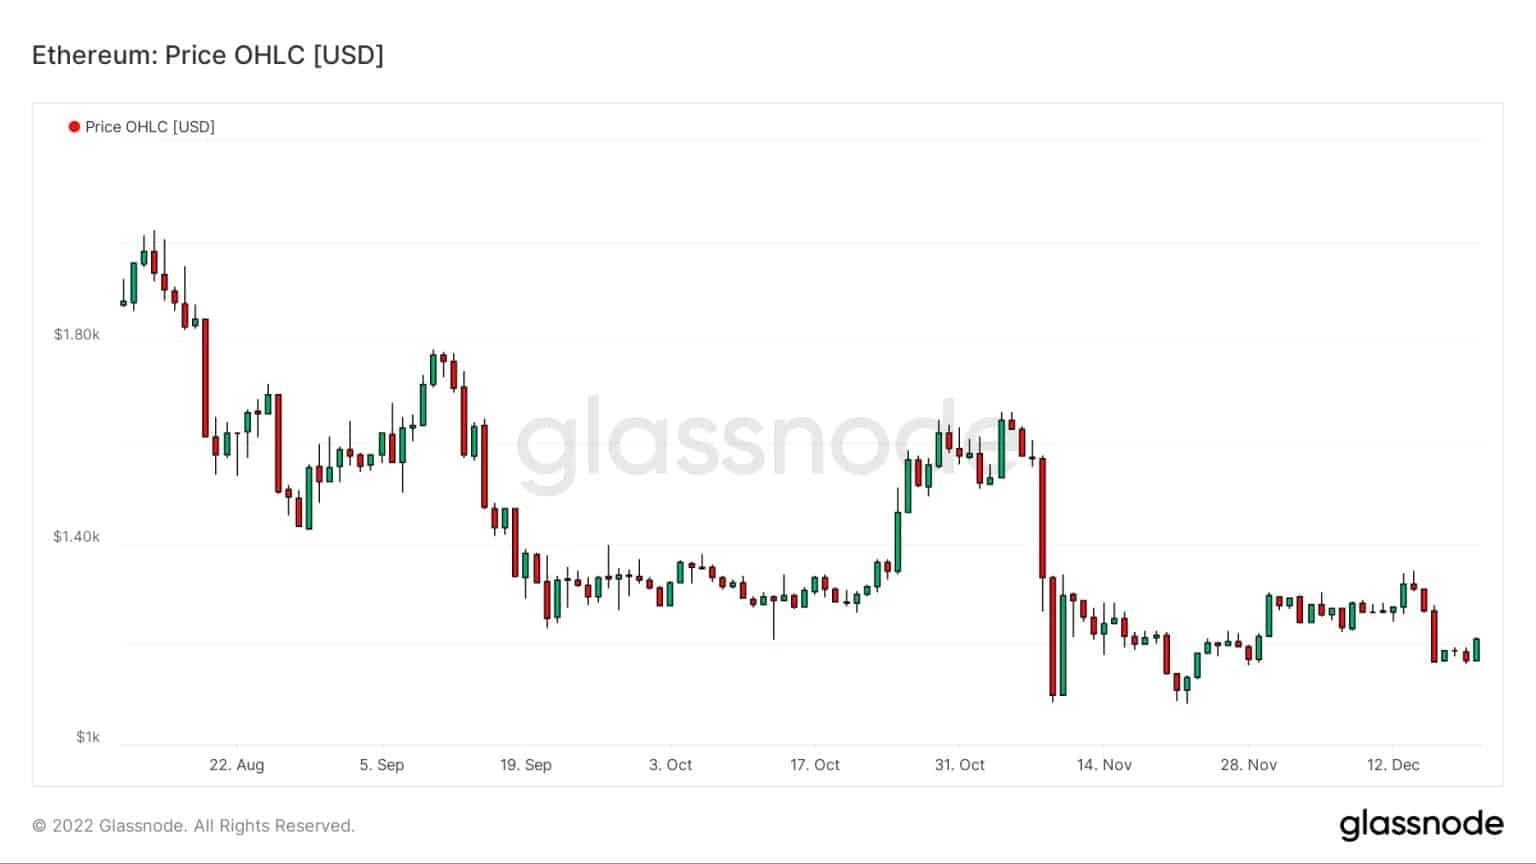
Figure 1: ETH daily price
Beyond the fluctuations of the ETH token price and a purely financial aspect, the properties and uses of the Ethereum blockchain have varied greatly lately, with notable technological advances and the growth of many business sectors.
Today, we will take a detailed look at the evolution of on-chain activity on the Ethereum network and its various usage trends over the past two years.
Ethereum activity in bear market
To measure the engagement of Ethereum network participants and their propensity to engage with it, the seven-day variation in active addresses provides a relevant signal.
The following graph shows the evolution of the Ethereum blockchain activity over the last two years. In addition to the short-lived spikes in activity marked in blue, this measure shows a long-term downward trend, a signature of a period of economic downturn caused by down cycles.
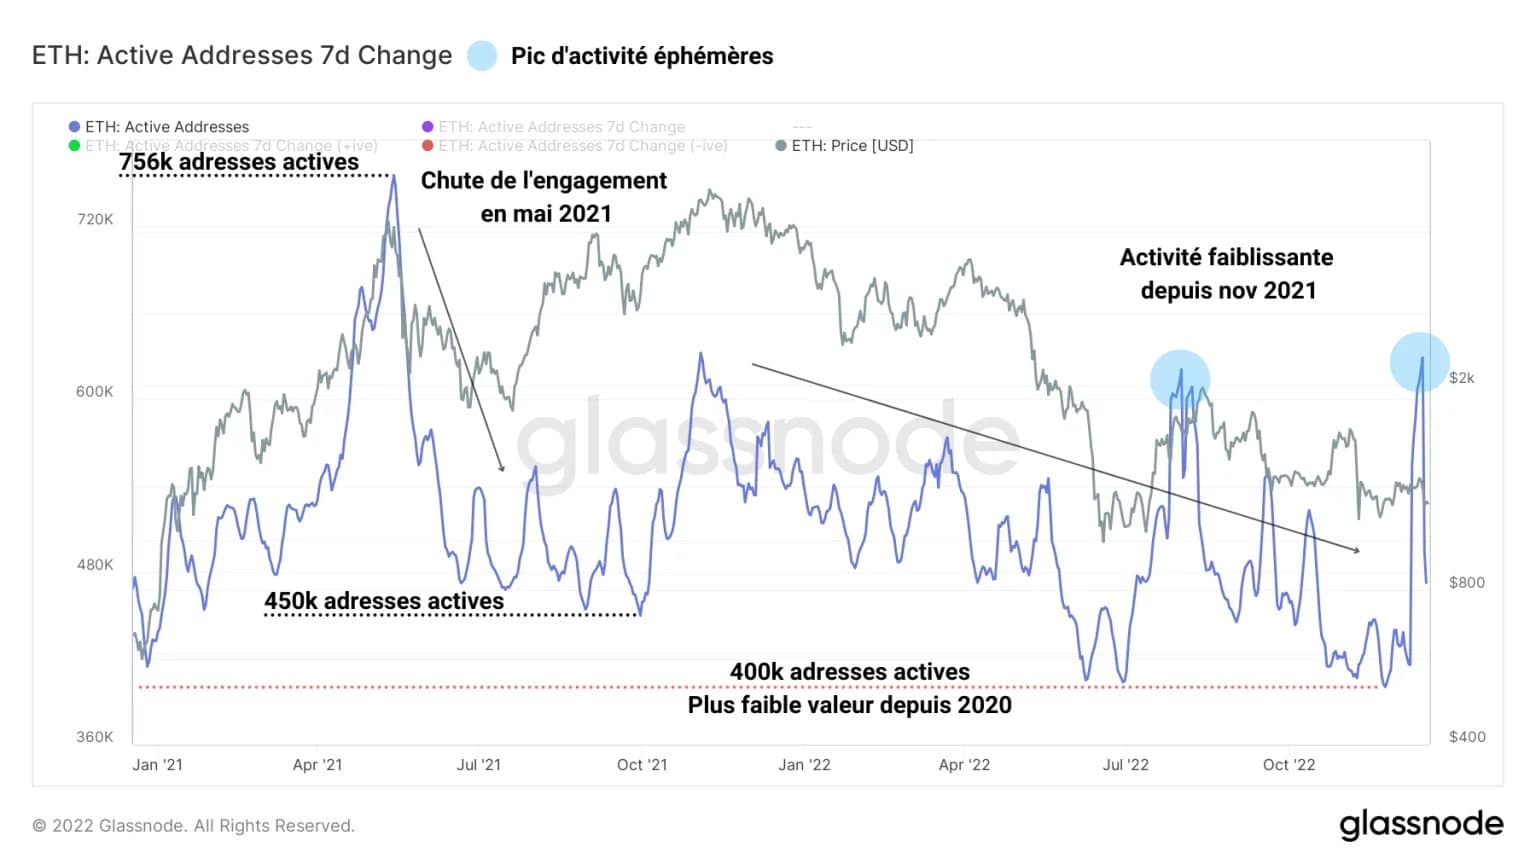
Figure 2: Active Ethereum addresses
A drop in address activity is visible as early as May 2021 and has continued since November 2021, with a multi-year low of nearly 400,000 active addresses recorded in November 2022.
Overall, network activity measured via this metric has nearly halved during the down cycle, indicating a loss of interest from investors and users of the Ethereum network.
In addition, we can measure the number of transactions made on a daily basis to get an alternative view of the activity of participants and their propensity to use the network.
As with the measurement of the number of active entities, the following graph indicates a sharp drop in blockchain usage after the May 2021 price capitulation.
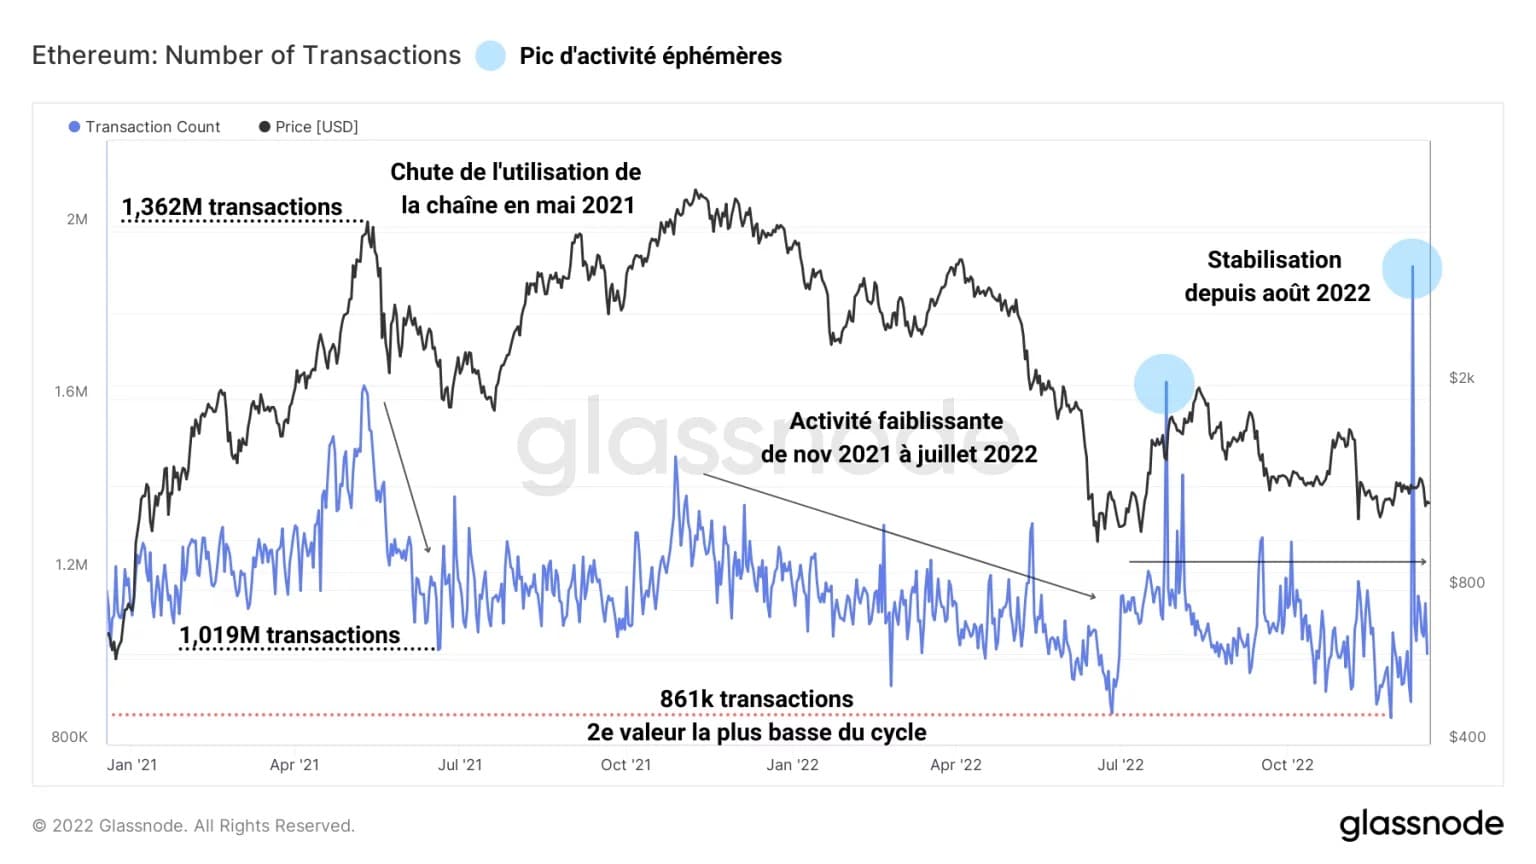
Figure 3: Number of daily Ethereum transactions
However, after a weakening activity from November 2021 to July 2022, the number of transactions seems to stabilize since August 2022 in a range between 800,000 and 1,000,000 transactions per day.
This could signal a return to a reduced activity regime, symbolising the regular and loyal users of the Ethereum network, which constitutes the blockchain’s core block space demand.
The evolution of Ethereum uses
Having quantified the evolution of Ethereum’s on-chain activity, let’s now turn to its qualification and more specifically to the categories of Ethereum transactions performed over the last two years.
The following chart shows the relative proportion of daily transactions related to the decentralised finance sector (DeFi).
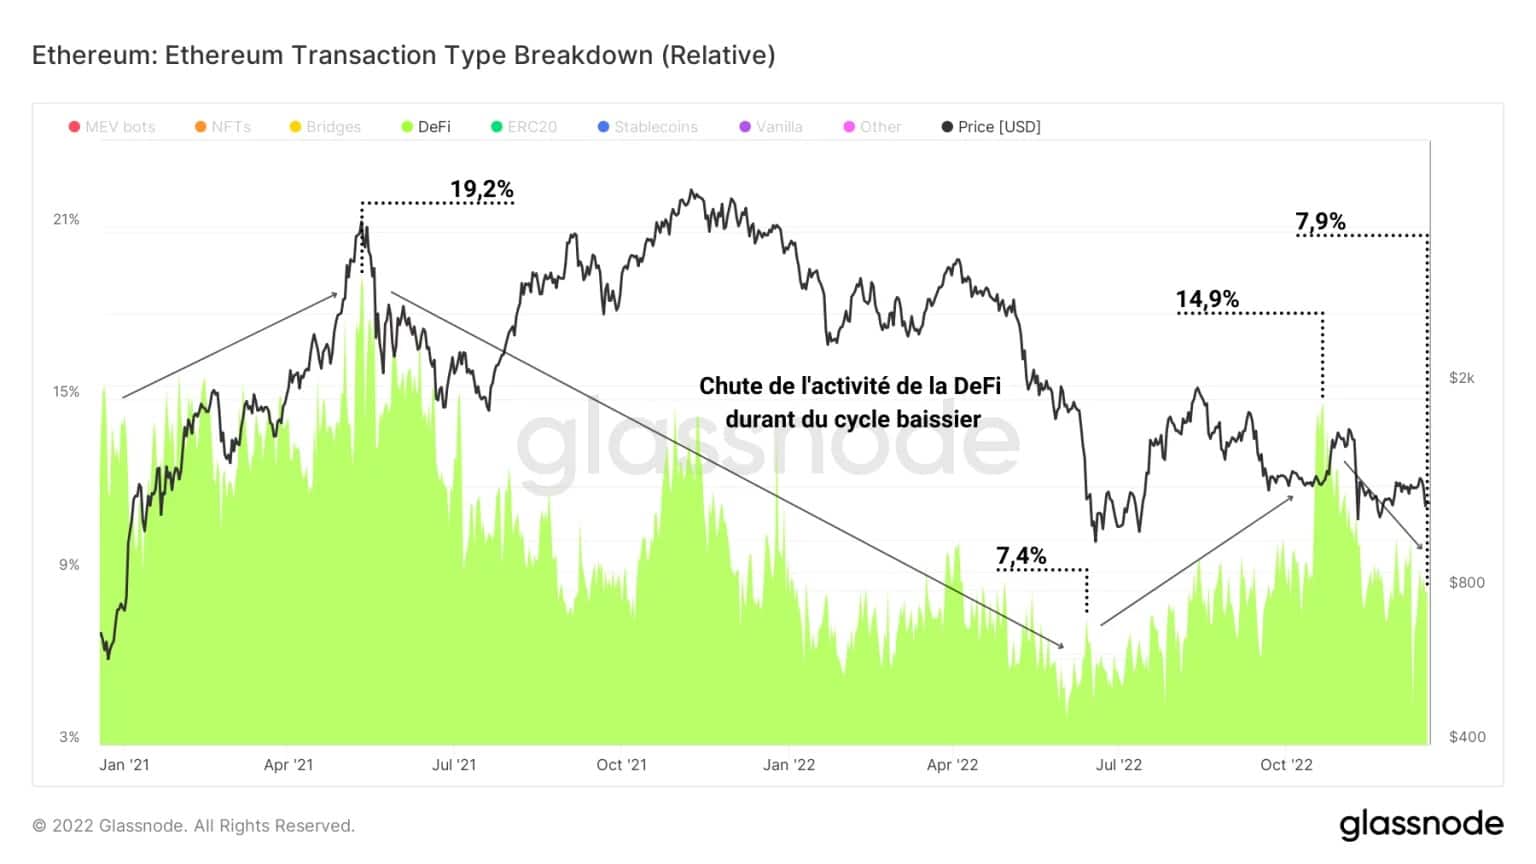
Figure 4: Relative weight of daily Ethereum transactions (DeFi)
There was a sharp decline in decentralised finance (DeFi) activity following the May 2021 capitulation, falling by a factor of 2.59 until a slight recovery between July and October 2022.
Overall, falling prices, the various setbacks of DeFi protocols and firms with significant links to the sector (Anchor hack, Terra/LUNA collapse, 3AC bankruptcy, and then FTX) and the quest for risk protection have led to a notable flight of capital, resulting in a palpable decline in activity.
The case of NFT transactions is particular, as activity in this sector has grown strongly despite the difficulties of the bear market.
A dramatic expansion in the percentage of trades representing NFT transfers occurred between May 2021 and June 2022, from 0.5% to nearly 37%, signaling widespread interest in this sector by participants.
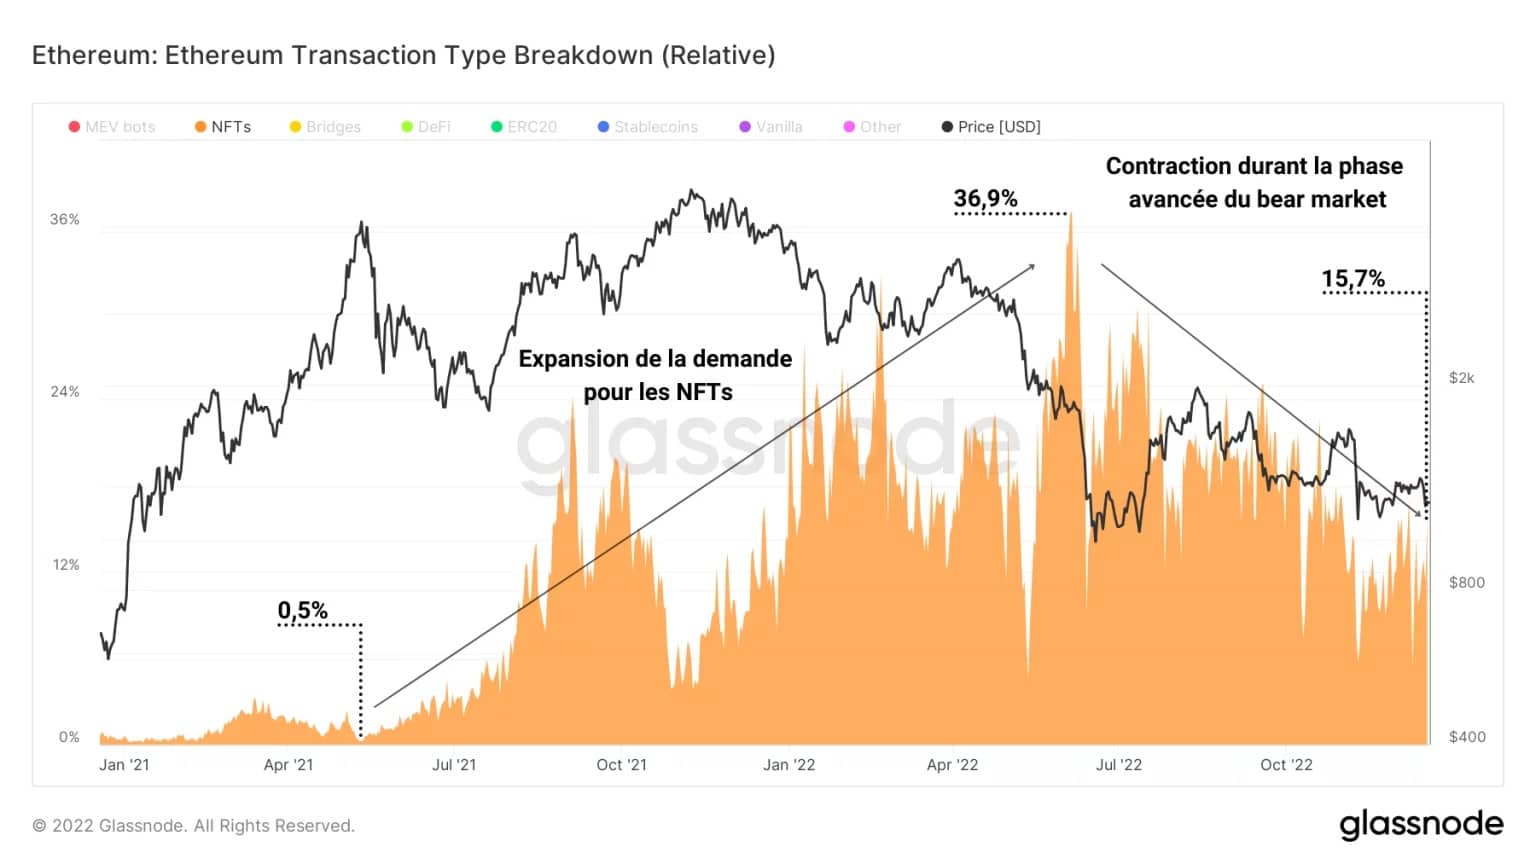
It was during this period that many NFT projects including Yuga Labs’ Bored Ape, Sorare trading cards and the Play-to-Earn movement took off.
Activity then halved to 15.7%, demonstrating a contraction in NFT activity and a rapid decline in interest during the advanced phase of the current down cycle.
Regarding stablecoin transactions, we can observe a variable use of these tokens depending on the progress of the bear market:
- Over the course of 2021, and during the price rise up to the November ATH, stablecoin trading activity dropped by nearly half, signaling that most participants favored BTC, ETH, or other value-enhancing vehicles;
- After a period of stabilization, the use of stablecoins has been preferred since October 2022, meaning that participants shaken by the vagaries of the bear cycle are limiting their risk and protecting their capital via USDT, USDC or other tokens with similar properties.
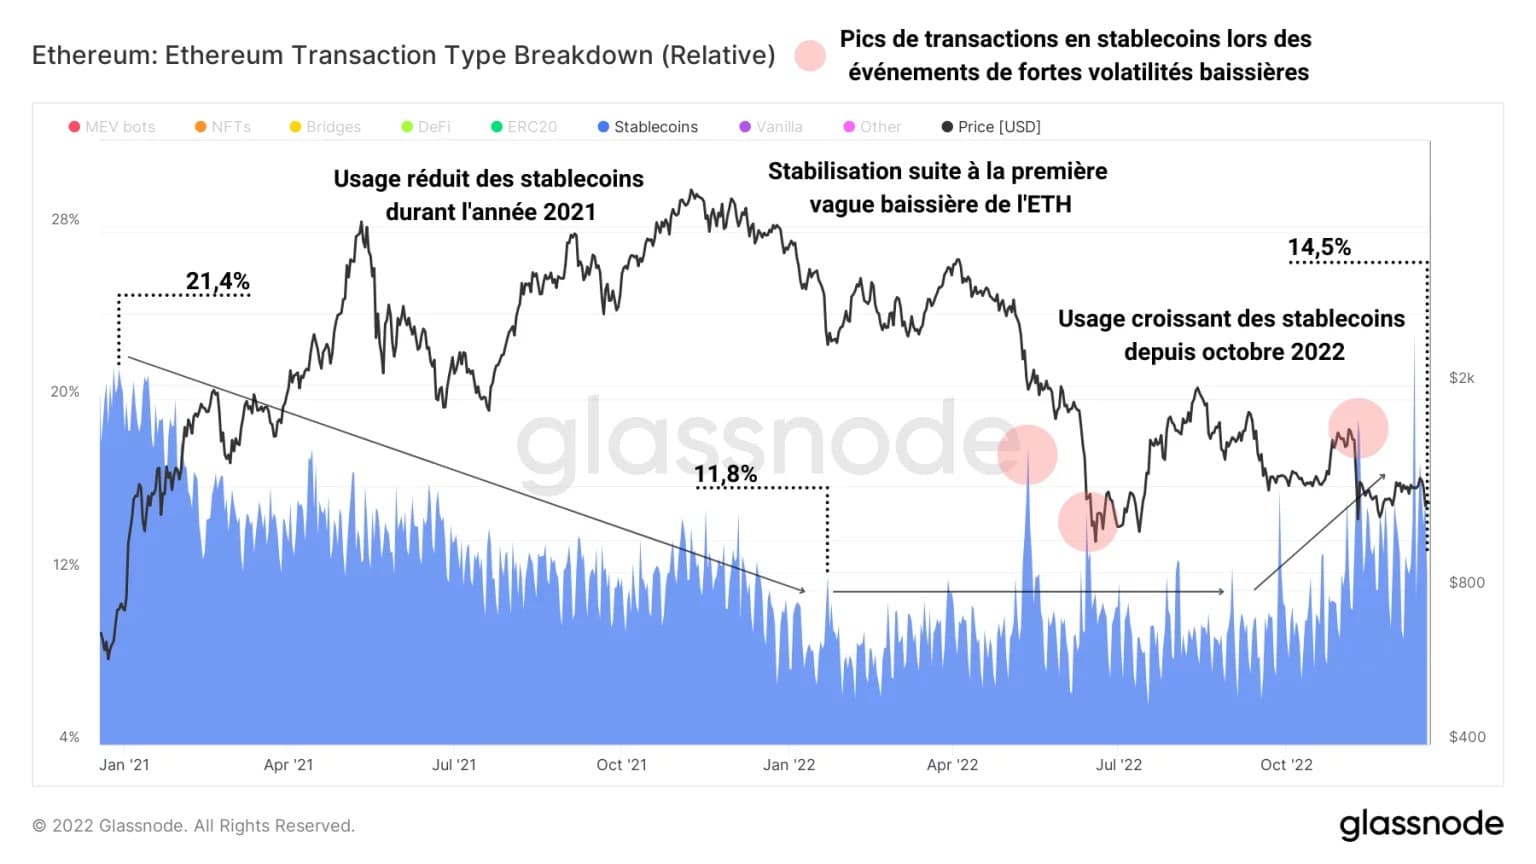
Figure 6: Relative weight of daily Ethereum transactions (Stablecoins)
In addition, notable spikes in stablecoin usage (in red) can be seen during events of high bearish volatility such as those in May, June and November 2022, signaling the switch to cash by participants shaken by the falling ETH price.
Finally, by observing the use of the Ethereum network for peer-to-peer monetary settlement, via so-called “vanilla” transactions, we can hypothesise that the ETH token is not ultimately intended to become a hard currency like bitcoin (BTC).
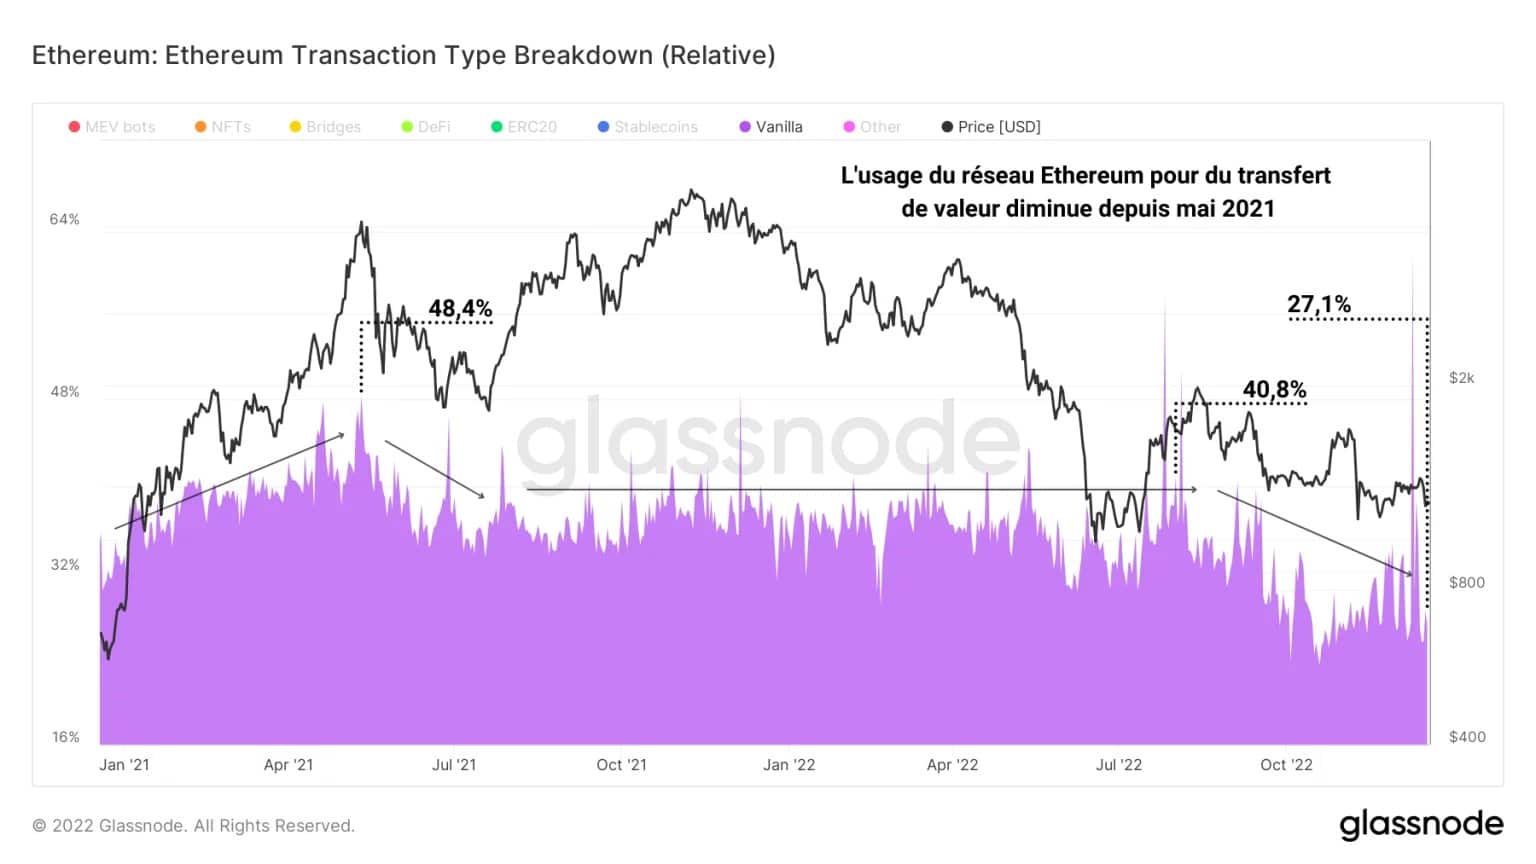
Figure 7: Relative weight of daily Ethereum transactions (Vanilla)
At the very least, usage shows that ETH holders are using their tokens less and less to transfer monetary value on the network, as indicated by the overall downward trend in the graph below over the past two years.
It seems that Ethereum users are using the network for various types of transactions depending on the trends (DeFi, NFTs, stablecoins), bringing this technology closer to the decentralized world computer than to the incensurable electronic money.
Summary of this on-chain analysis of Ether
Finally, the on-chain data presented this week indicates on-chain activity on the Ethereum network is still in a bear market regime, with the number of active addresses down and the number of transactions very low.
In addition, it appears that Ethereum users have shifted from DeFi and NFT-related transactions to stablecoins, given the advanced depreciation of the ETH market.
The use of the Ethereum network thus seems to evolve according to the trends of new technologies, favouring or limiting risk according to the cycles of the ETH price, without the chain being used for peer-to-peer monetary settlement.