
After a month of highs in January, transaction fees have dropped considerably on the Ethereum blockchain (ETH) lately. Let’s take a look at the different reasons why they are at their lowest in 6 months.
Fees are falling on the Ethereum blockchain
The value of ethers burned since the implementation of EIP1559 has exceeded $5 billion, that is, more than 1.9 million ETH. At the same time, Ethereum network fees have reached a 6-month low. Indeed, they have returned to the levels of late August last year, averaging about $5 per transaction, a drop of nearly 80% since January.
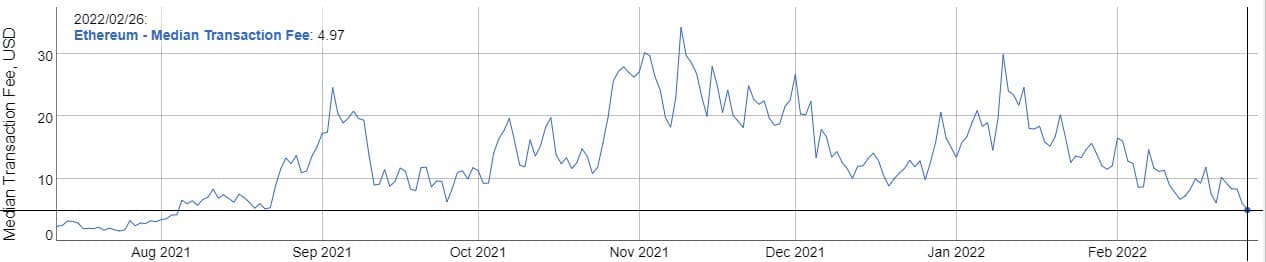
Figure 1: Average dollar cost of a transaction on Ethereum
It should be noted that there are several variables involved in the cost of a transaction. Firstly, the price of the gas, expressed in Gwei, and then the quantity required. This is why, for example, a transfer of cryptocurrencies between two addresses costs less than stacking LP Tokens in a smart contract, as the operation requires less gas.
A Gwei is a fraction of an ether, i.e. 10^-9, or more simply, 0.000 000 001 ETH. Thus, the price of an ETH is also taken into account in the calculation of the cost of a transaction.
From this, it is clear that network capacity is not the only factor responsible for a fluctuating transaction price. The state of the market through the ETH price and the type of operations carried out by the operators are also to be considered.
What is causing the drop in fees on Ethereum
One shortcut to answering this question would be to say that it is due to the emergence of many competing blockchains that are more affordable than Ethereum. While this is partly true, reducing the conclusion to that would be wrong and reductive.
Over the first half of 2021, the dominance of the notorious “Mainnet” effectively fell from 97% to around 70% of decentralised finance (DeFi) capital. Then it lost market share more moderately to reach 55% today. But capitalisation has exploded, from 17 billion on 1 January 2021 to 111 billion today. It is also important to bear in mind that the problem of transaction fees is less of an issue for institutional investors, who have more resources.
The charts below show us that the health of the market provides some answers:
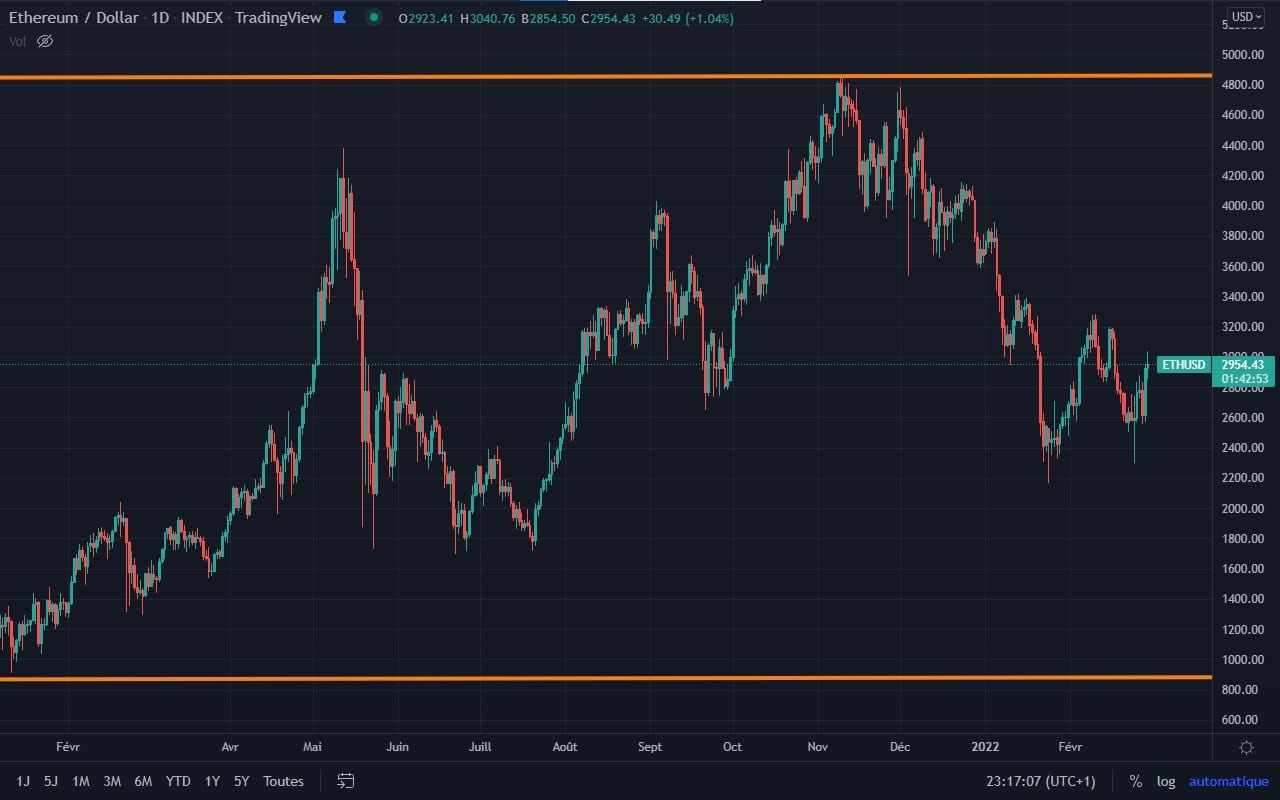
Figure 2: ETH price since January 2021
Since the peak on November 8, the ETH has lost 45% of its value. The price pattern shows some convergence with other blockchain data, but the proportions and correlations are nuanced.
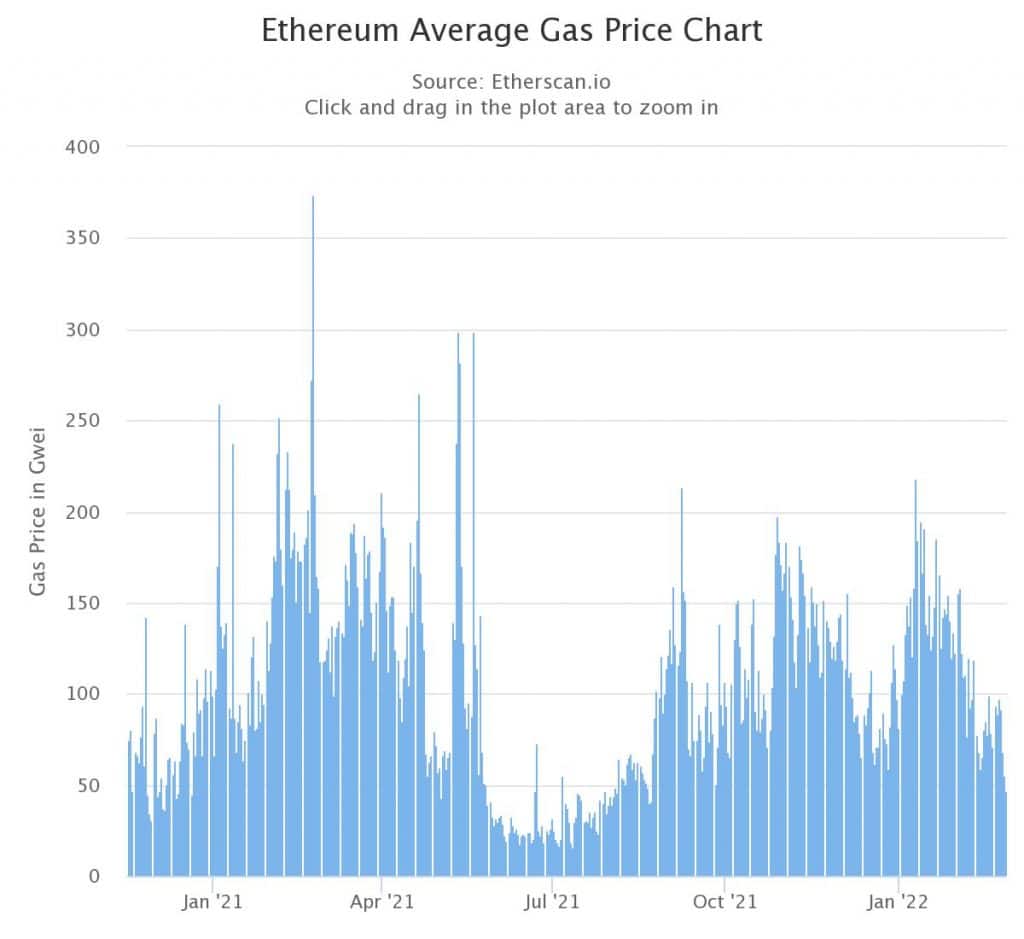
Figure 3: Average gas price in Gwei on the Ethereum blockchain since January 2021
After the previous low 6 months ago, there are 3 main spikes in the average Gwei price:
- 214 on 7 September;
- 198 on 28 October;
- 218 on 10 January.
With the exception of 7 September, this does not necessarily occur on the most volatile days of the study period. Since 28 October, the price of gas has fallen by 65%. As the chart below shows, the drop is much less pronounced for blockchain activity, which tends to show that blockchain alone cannot be held responsible for a drop in fees.
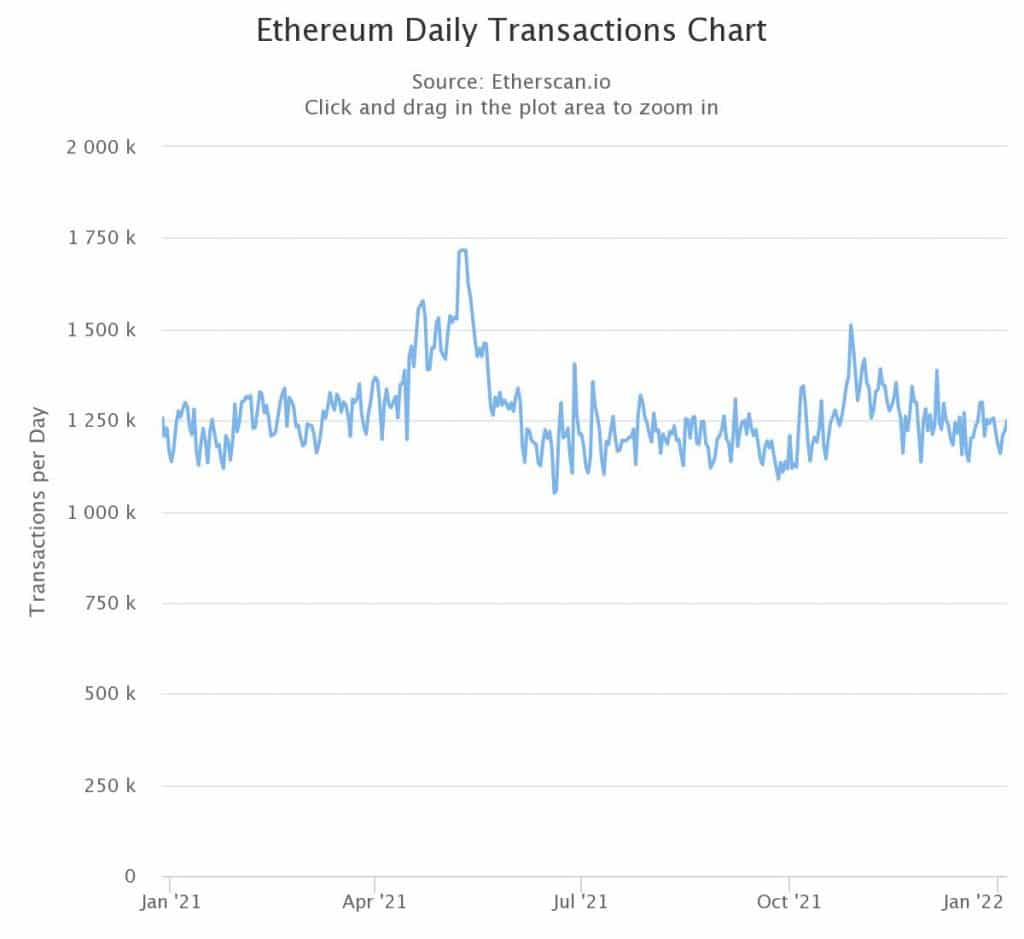
Figure 4: Daily transactions on the Ethereum blockchain since January 2021
On-chain data in the role of technical indicator
The highest trading volume in the last 6 months was also on October 28, at 1,510,502 on the day, and has since fallen by 15%. This same date also marks a high in the number of ETH burned before a low point on November 7, just before the price drop began. This convergence of signals regarding the activity of the network reveals to us afterwards a warning that the trend is running out of steam.
Indeed, like a technical indicator on a chart that would show a bearish divergence, a drop in grid congestion preceded the fall. The price of gas, on the other hand, tends to fall as a price range is established, while being more sensitive to market volatility.
Given all this data, it is difficult to attribute the fall in transaction costs to a single reason. Rather, it is a combination of factors such as lower prices, lower volatility and, to a lesser extent, lower grid usage that are creating an environment for lower than usual gas prices.
With prices now appearing to be returning to volatility, it will be interesting to observe how gas behaves.