
The US equity market hit a new all-time high on Wednesday, with the S&P 500 index reaching 5,000 points. This uptrend is still based on the same combo: a resilient US economy that doesn’t trigger a second wave of inflation
The strength of the US economy is not inflationary
The strength of the US economy in the second half of 2023 and a solid start to January 2024 have rekindled concerns about the 2% inflation target with a postponement of the Fed’s pivotal time expectations. No, US disinflation is not threatened in substance. On the other hand, the timing of reaching the 2% target remains uncertain.
In my opinion, however, it will be achieved before December, and probably as early as this summer. After a solid 4th quarter in 2023, and a year which saw the US economy prove surprisingly resilient compared with Europe, the US economy seems to be starting 2024 with the same vigour, putting the lie to all predictions of economic recession.
At this stage, the strength of the US economy is illustrated by several leading macro-economic barometers.
First of all, the PMI leading indicators – the famous “forward looking indicators” – are expanding in the USA, according to S&P Global and the ISM. Even more surprising is the rebound of PMI indices in the services sector above the 50 level, the threshold that separates economic contraction from economic expansion. The most closely watched is the ISM services PMI (https://www.ismworld.org/) for the US economy, which rebounded strongly in January 2024.
On the macro-economic “hard datas” side, recent retail sales (household consumption) and industrial production figures have also indicated a rebound in the US business cycle, despite still largely restrictive monetary conditions (see rising real rates with inflation falling faster than nominal interest rates).
But the ultimate barometer of the health of the US economic cycle remains the US labor market and its weekly and monthly updated statistics (the NFP report). January’s NFP report is very solid, showing the US economy’s intact capacity to maintain low unemployment. However, some leading employment indicators still call for caution, but without a clear and sharp deterioration in employment, corporate earnings are not threatened, and they are the driving force behind the equity market’s uptrend.
The good news in all this is that the strength of the US economy is not pushing inflation upwards at this stage, and this is the essential condition for guaranteeing a pivot by the FED next spring.
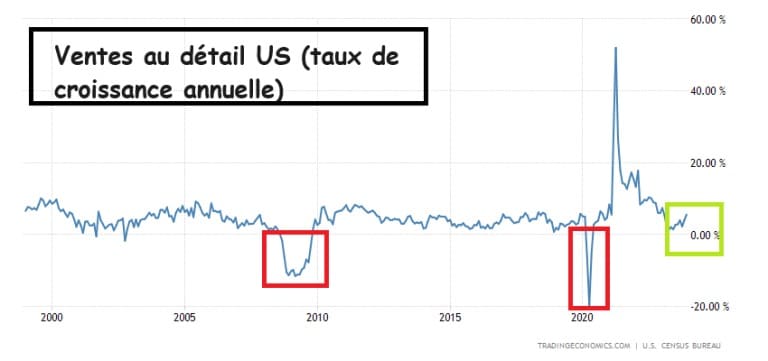
Graph representing the annual growth rate of US retail sales
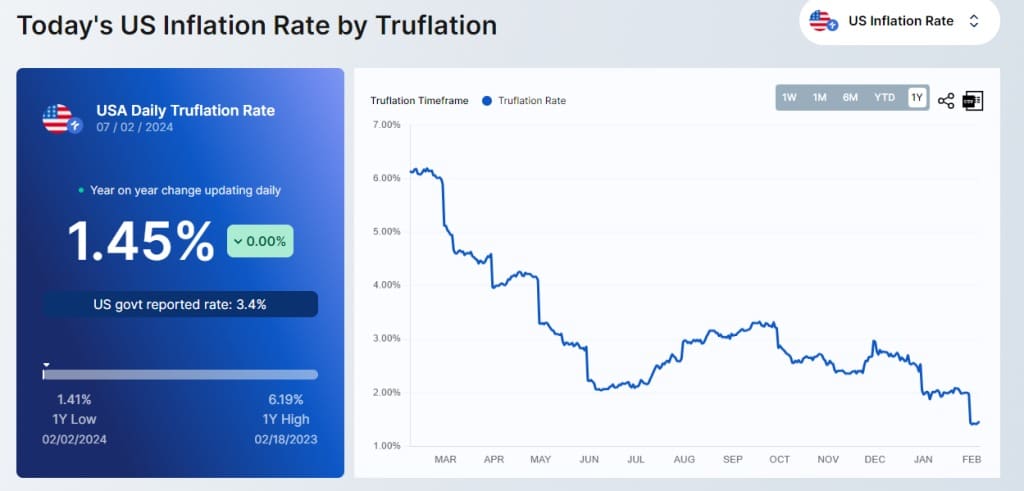
Graph representing the annual US inflation rate according to the TRUFLATION application
S&P 500 futures contract reaches 5000 points, all-time record!
Over the long term, in fact since 2009, the correlation between the US equity market and the Bitcoin price is largely positive. This doesn’t mean that it’s equal to 1, far from it; it’s subject to variations and relative cycles, but overall, it’s positive.
I therefore thought it interesting to note that the S&P 500 futures contract, by far the world’s most heavily traded futures contract in terms of trading volume on the equity market, set a new all-time record on Wednesday, reaching the 5,000-point mark. This new record is largely due to the fearless uptrend of the US tech stars, the so-called Magnificent Seven (Microsoft, Nvidia, Tesla, Meta, Apple, Alphabet and Amazon).
As far as the short-term trend in the Bitcoin price is concerned, the graphical framework has been stable for the past week: we need to break through resistance at US$44,500 to envisage a serious relaunch of the uptrend. The risk of a correction materializes if support at 42,000 US dollars is broken.
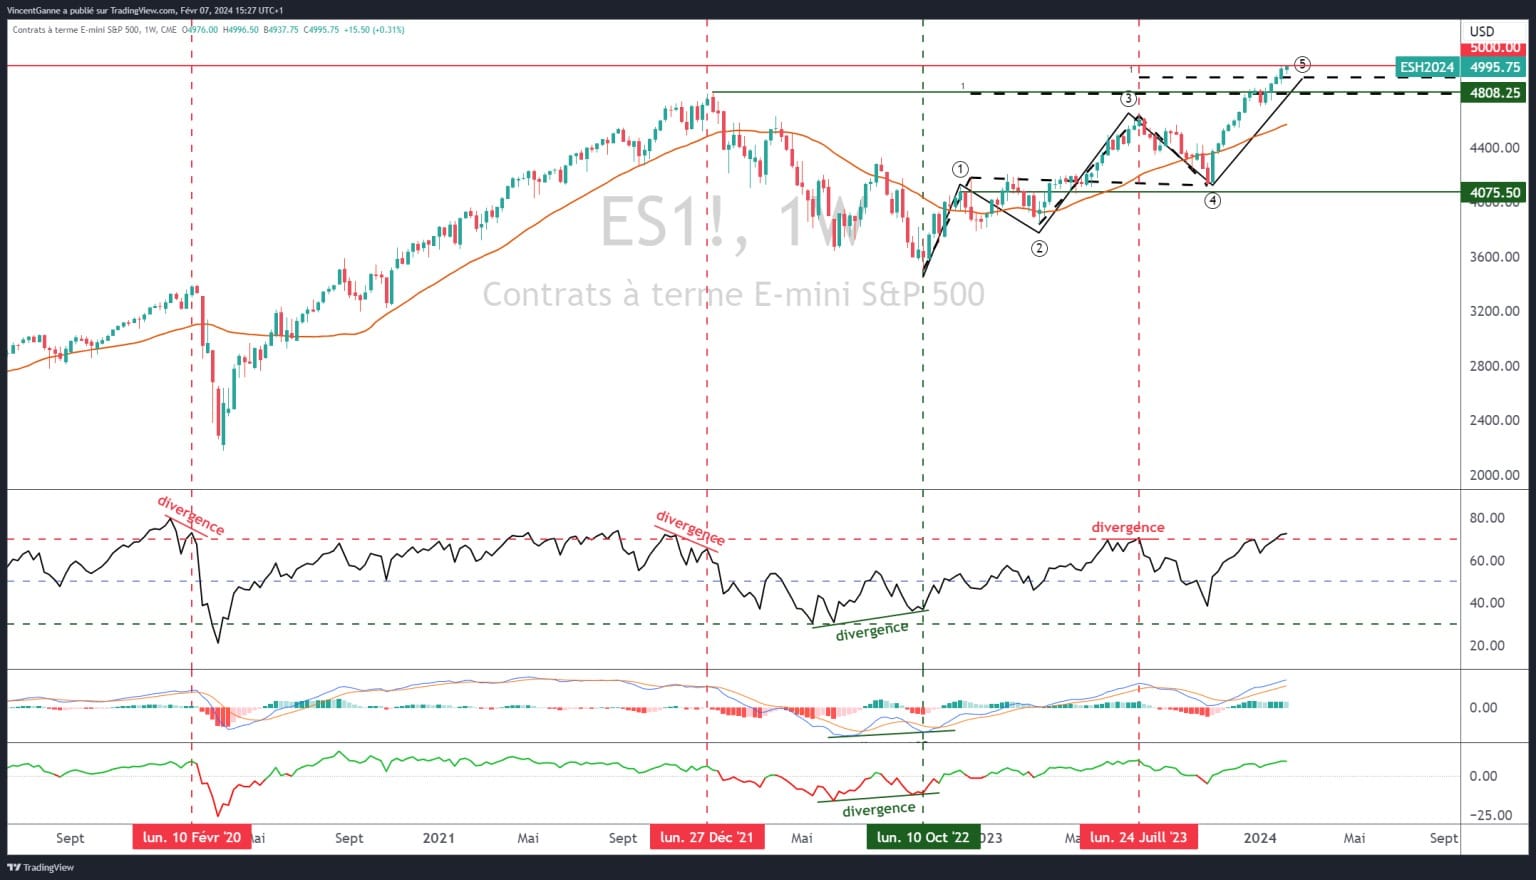
Chart showing weekly Japanese candlesticks for the S&P 500 futures contract