
Despite the macroeconomic and geopolitical instability of recent weeks and the selling pressure experienced by investors, BTC seems to be convincing more and more entities of its usefulness as a store of value. As the number of nodes on the Lightning Network drops momentarily, the average channel size adjusts to an ATH of 0.044 BTC. On-chain analysis of the situation
Bitcoin forces the hand of short-term investors
The price of Bitcoin (BTC) is slowly slipping below $40,000 support and contracting. While a growing portion of participants are adopting a short-term bearish bias, BTC outflows from exchanges are maintaining a consistency worthy of the 2021 year-end bullish rally.
Withstanding the macroeconomic and geopolitical instability of recent weeks surprisingly well, BTC seems to be convincing more and more entities of its usefulness as a store of value, protecting wealth from runaway inflation.
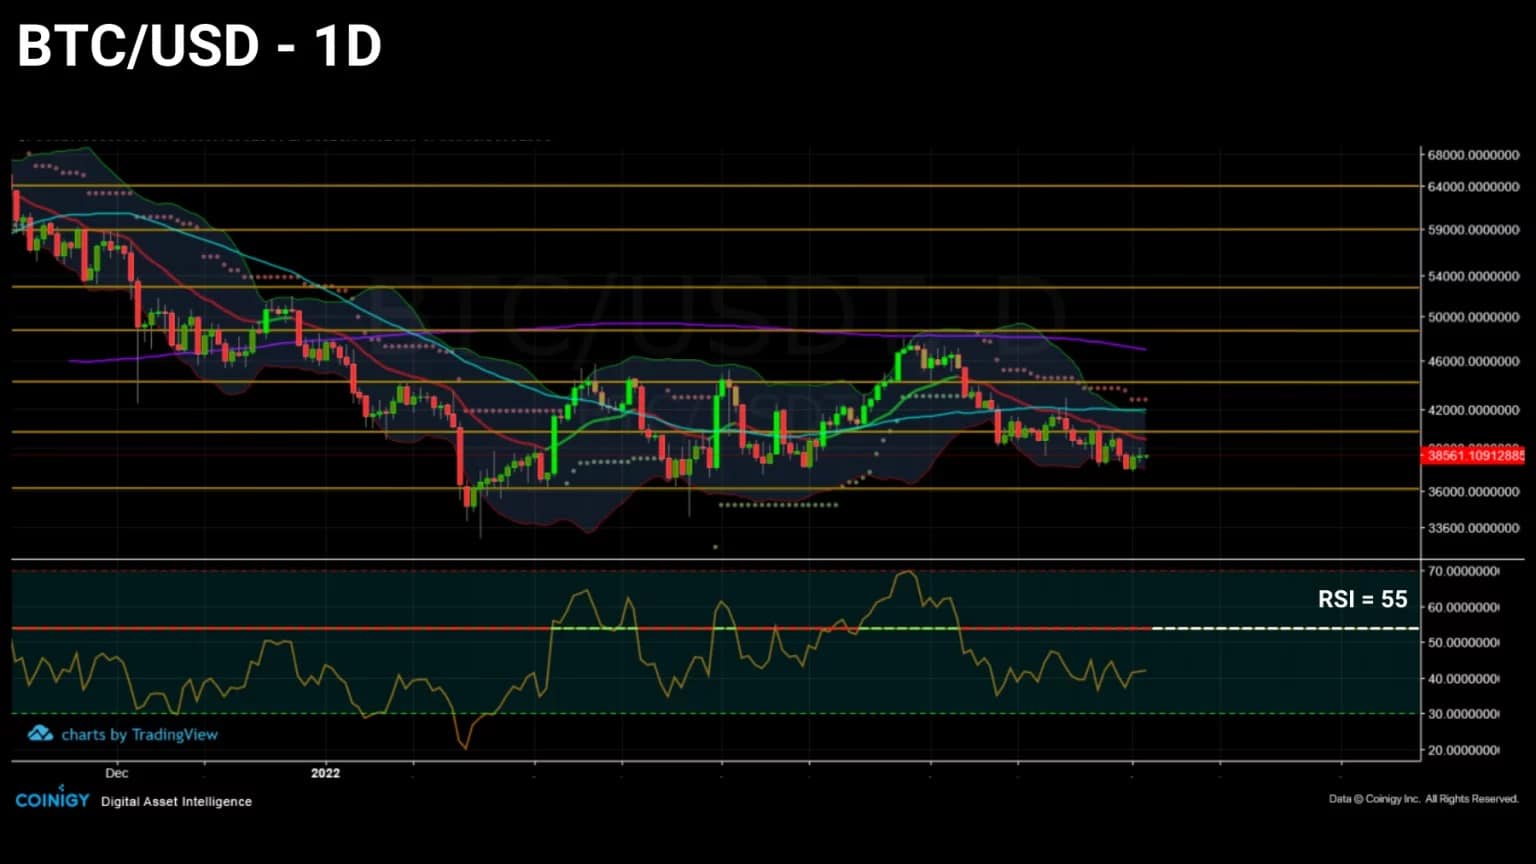
Figure 1: Daily Bitcoin (BTC) price
This week we will briefly describe the profitability status of the market to gauge the extent of potential selling pressure on the BTC price. We will then look at the process of liquid supply migration from exchange reserves to investors’ wallets before adding the Lightning Network to our analysis prism.
Latent losses are accumulating
We’re not going to be able to do that, but we’re going to be able to do it in a way that’s not going to be easy. Continuing to oscillate within a multi-month range, BTC is invalidating the formation of successive higher lows and beginning a spasmodic decline below the $40,000 level.
In terms of potential selling pressure, the energy accumulated by long-term investors’ (LTH) unrealized losing positions has been steadily increasing through the corrections since May 2021.
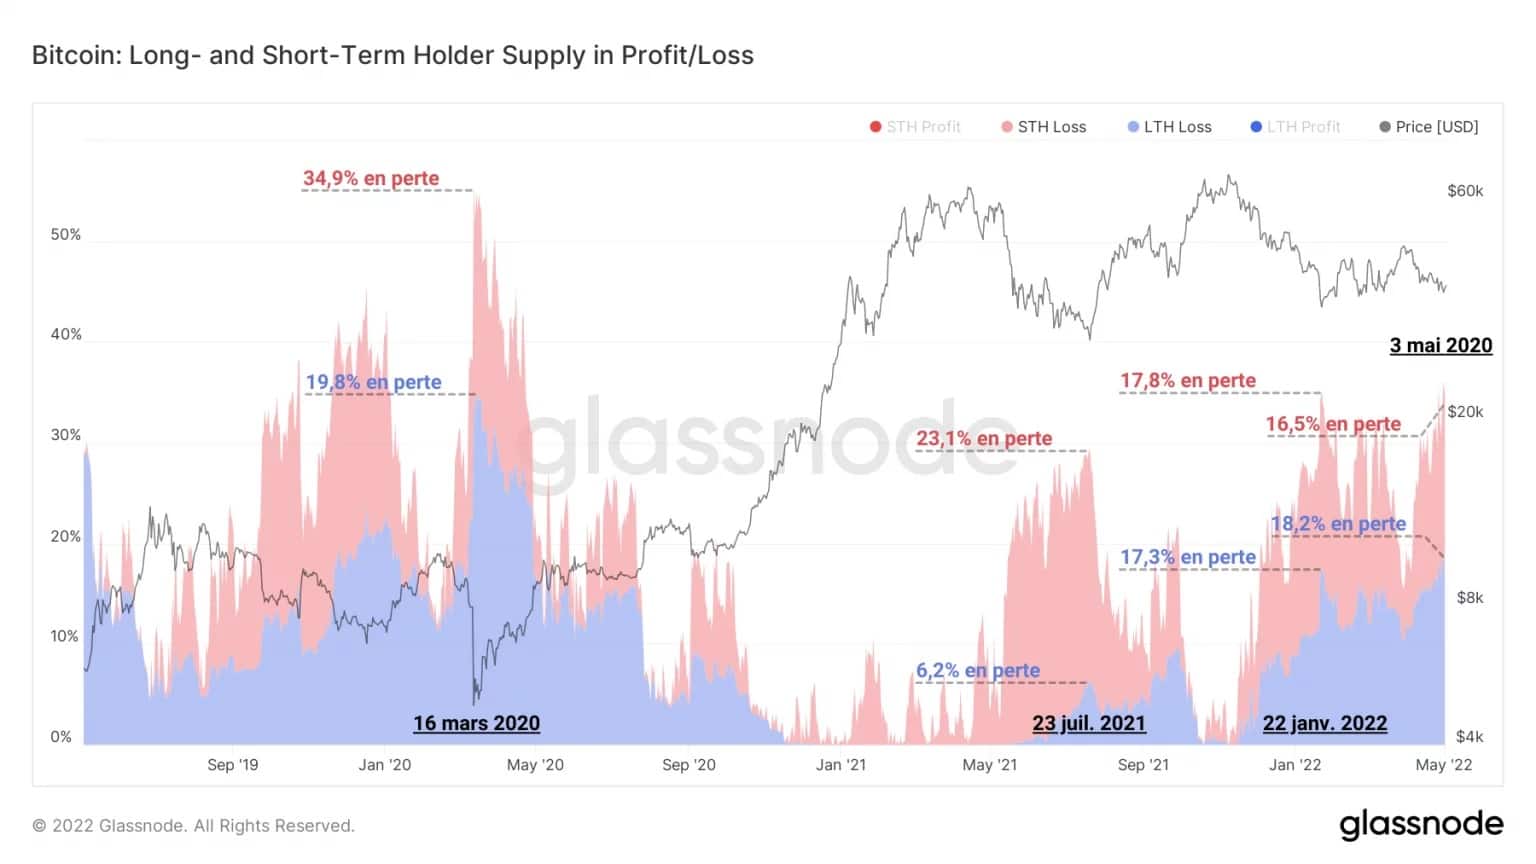
Figure 2: Short/long term supply of profit/loss
Witnessing the HODLing behaviour of this cohort, the supply held at a loss by LTHs now amounts to 18.2% of the supply in circulation. It thus appears that some of these entities have retained their holdings through the significant falls and have accumulated latent losses without faltering, demonstrating a strong insensitivity to price fluctuations.
As for short-term investors (STH), we can see that the latent losses associated with them are lower today than at the time of the 22 January low, a sign that some have already given in to selling pressure by making losses slightly lower than the aggregate cost base of this cohort.
This finding is corroborated by the STH-SOPR study. As the profitability ratio of expenditures less than 155 days old, this indicator tells us whether STHs are selling their tokens at a loss or a profit.
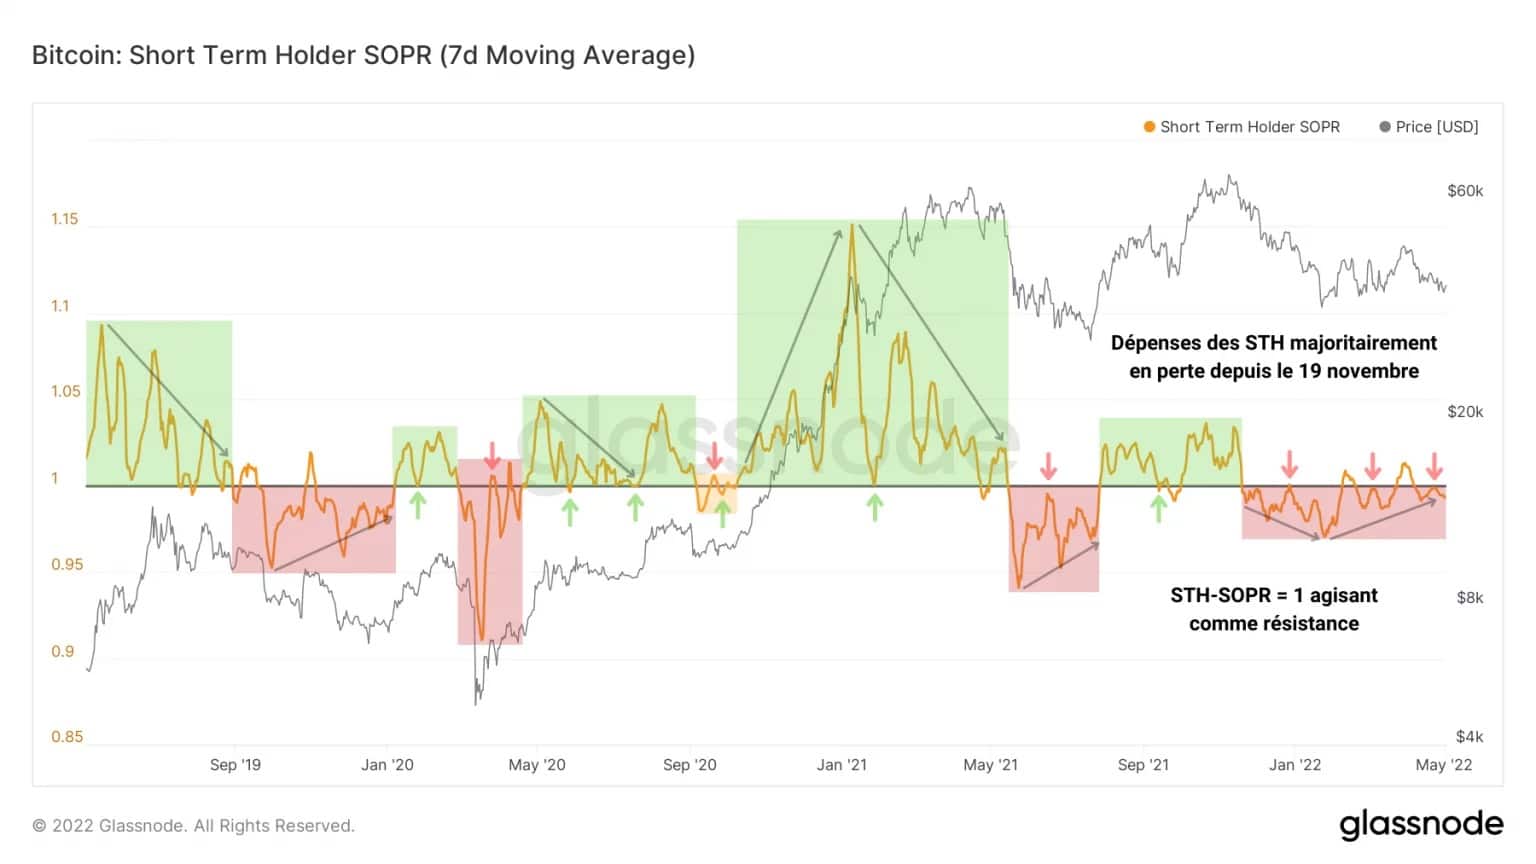
Figure 3: STH-SOPR
Clearly, most short-term investor spending has been at a loss since 19 November 2021, adding to the overall selling pressure in the market.
However, we can see that the oscillations of the indicator are gradually approaching the neutrality threshold (STH-SOPR = 1), indicating that the realised losses of STHs are getting closer and closer to their overall cost basis without managing to break out of it in a sustainable way.
For tokens older than 155 days, the profitability ratio has just found support on the neutrality threshold (LTH-SOPR = 1). This means that the BTC spent by LTH are sold just above their cost base.
Furthermore, this tells us that since the March 2020 capitulation, this cohort has never been so severely tested and a move in LTH-SOPR below the neutrality threshold (LTH-SOPR ☺ 1) would have a great chance of precipitating a capitulation of part of the market.
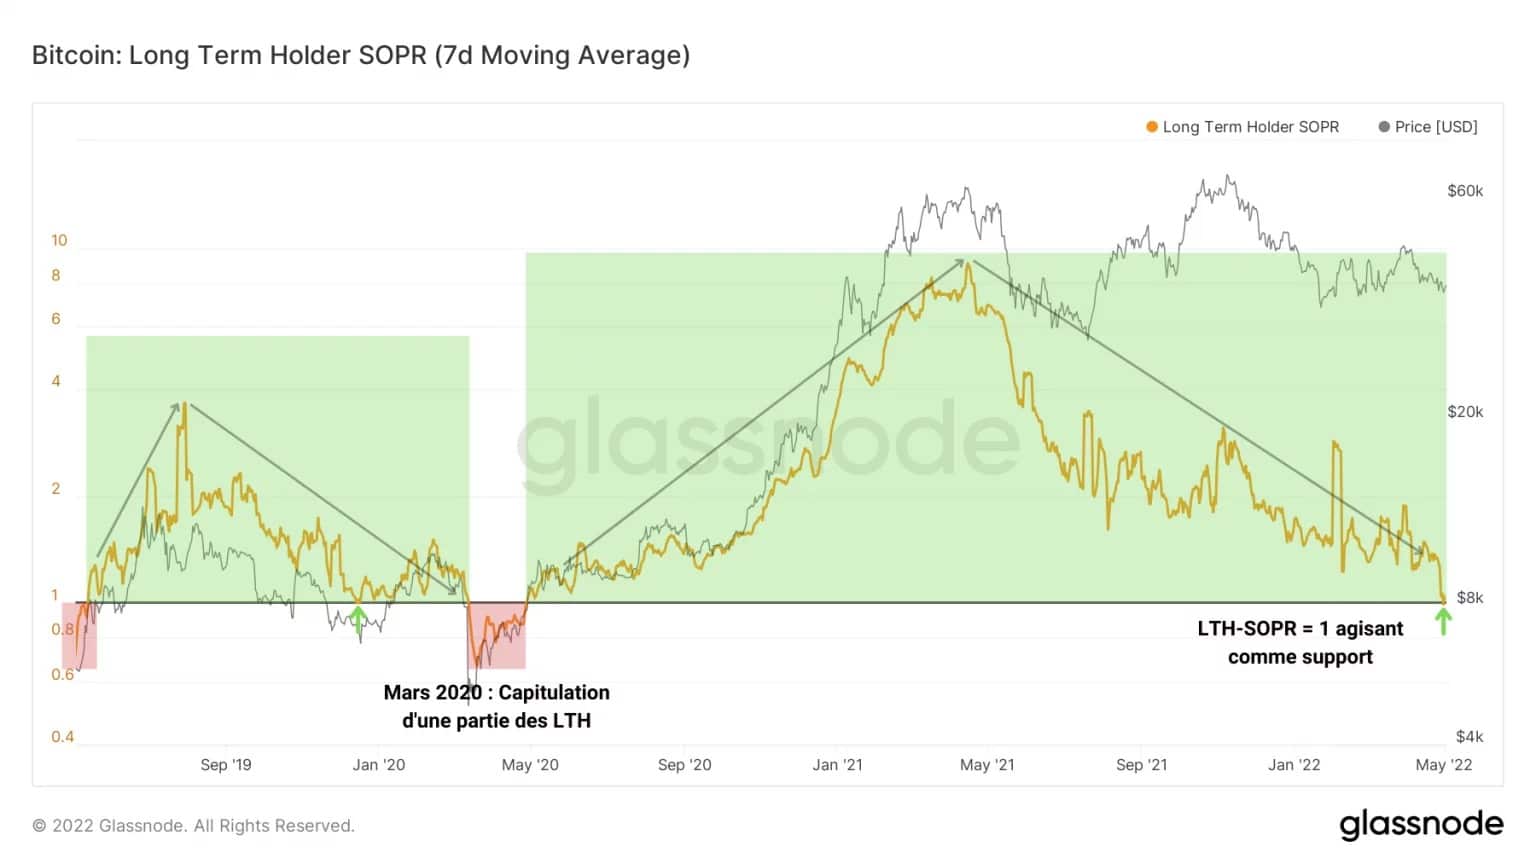
Figure 4: LTH-SOPR
There is thus a lot of latent selling pressure on the STH and LTH cohorts, which seem to be holding their own with moderate losses. However, the market does not seem to be immune to a black swan that could push BTC towards the lower end of the range, between $36,000 and $35,000.
BTC razzia on exchanges
If one considers the flow dynamics of the outstanding supply, the state of the market takes on a more nuanced perspective. Despite the potential selling energy identified above, the fact remains that a majority of market participants agree on one thing: to remove their BTC from exchanges.
As described in our analysis over the past few months, the global withdrawal dynamic taking place on all centralized exchange platforms is evidence of a clear paradigm shift: investors want to protect their capital and gain sovereignty by owning their assets.
Perfectly illustrated by the monthly variation in the reserves of the exchanges, this process is now extracting just under 100,000 BTC per day. It is therefore appropriate to note that the current flow dynamics are the complete opposite of the events resulting from the capitulation of May 2021 or the correction at the end of 2021.
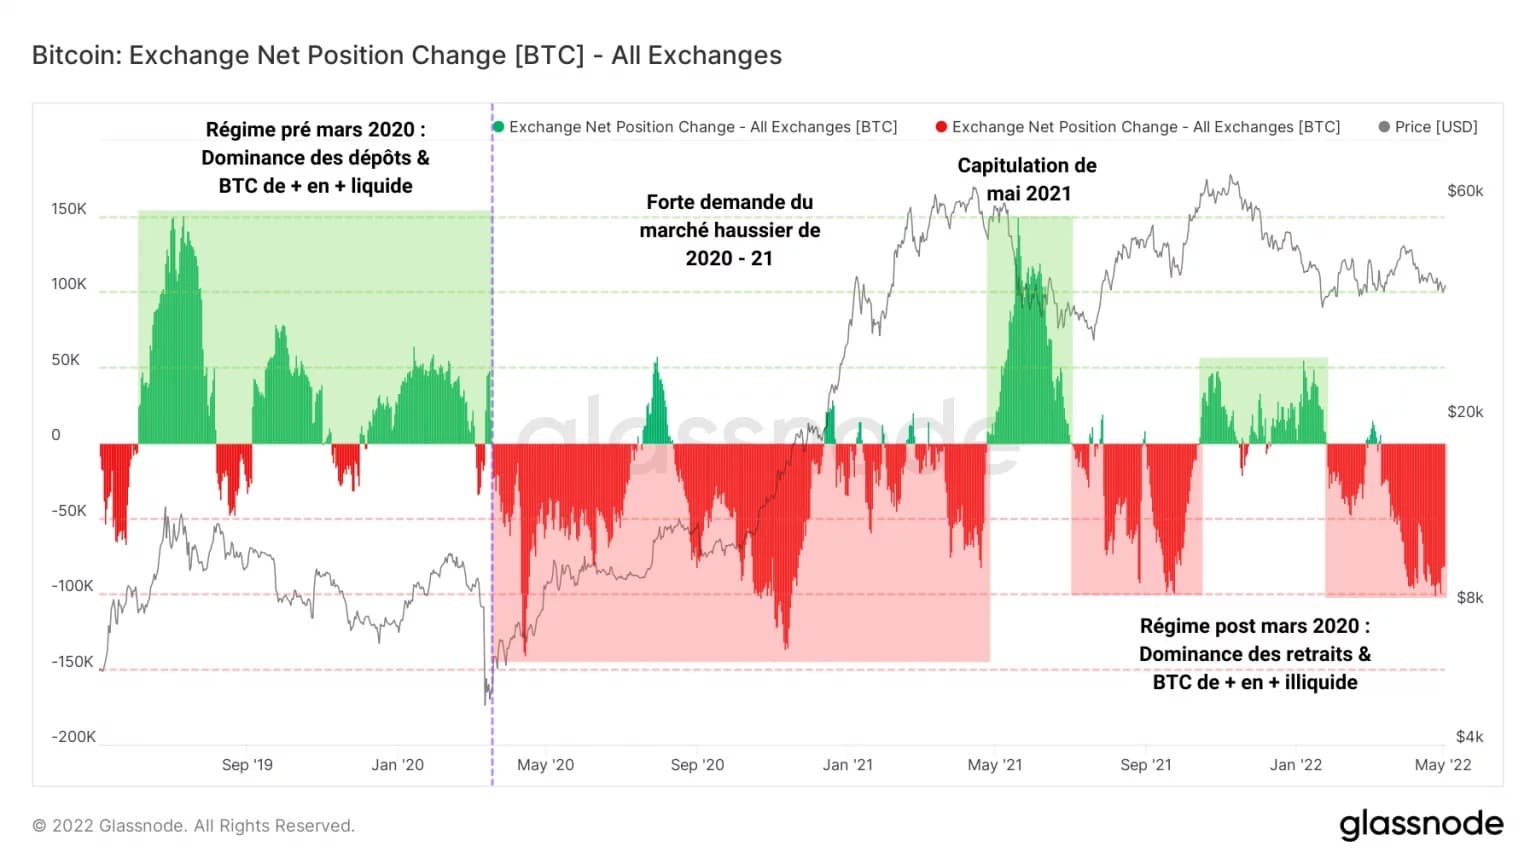
Figure 5: Changes in positions on exchanges
Indeed, instead of recording large inflows during a correction (a sign that a strong desire to sell is driving the market), it appears that the current range is allowing many investors to accumulate BTC particularly aggressively.
This dominance of withdrawals is symptomatic of the current regime since the March 2020 capitulation and indicates a strong desire on the part of participants to appropriate the means to secure their assets autonomously and sovereignly.
Falling today to 1.28 million BTC, the liquid supply is approaching a generational low following waves of increasing withdrawals over the past almost two years.
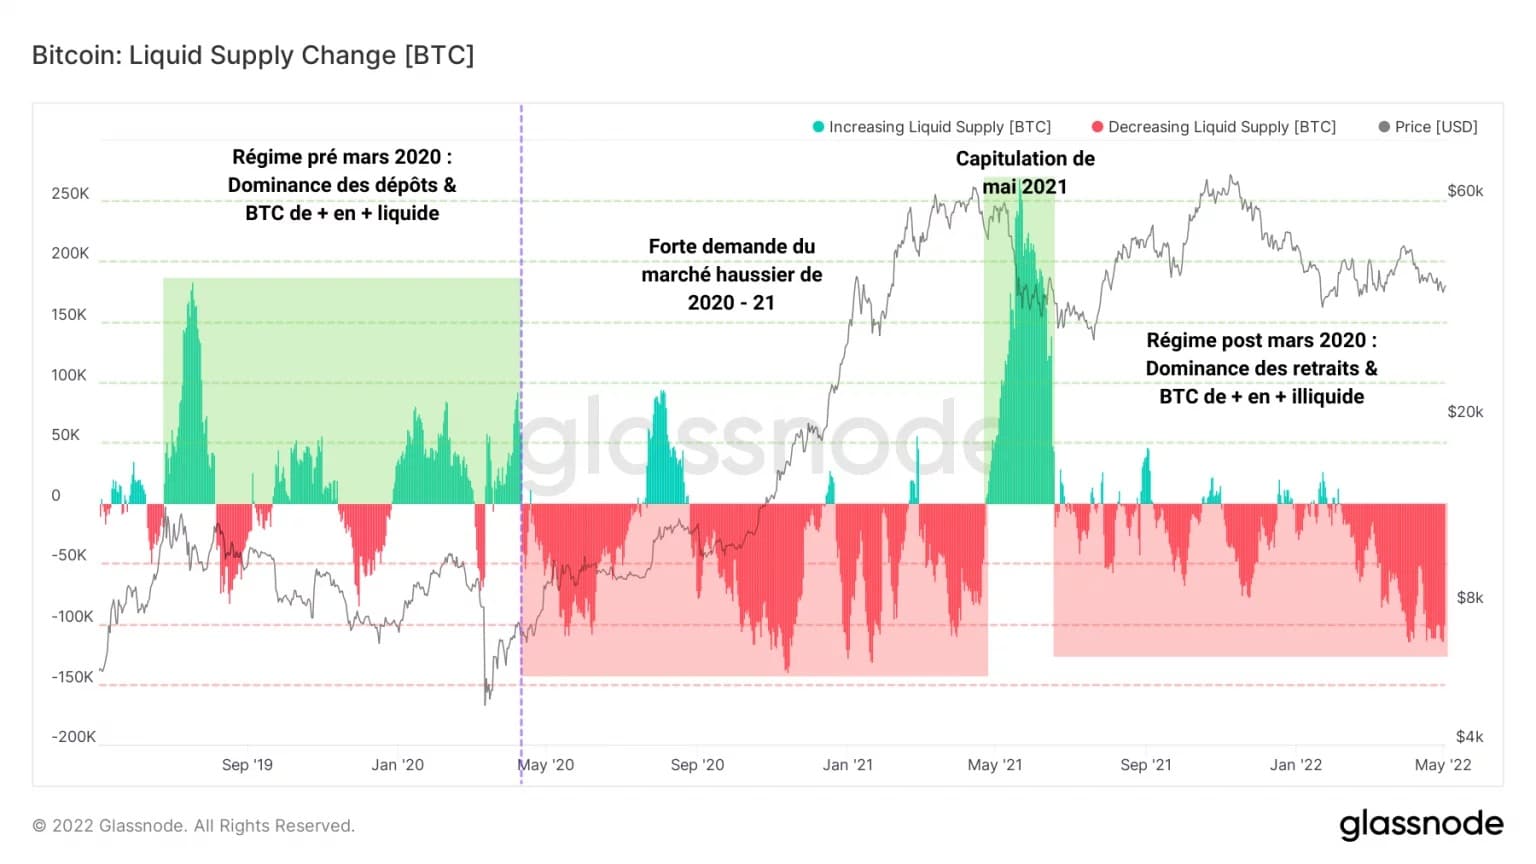
Figure 6: Evolution of liquid supply
The Lightning Network in slight decline
Let’s add to our inventory of on-chain tools a new set of indicators related to Bitcoin’s overlay protocol: the Lightning Network, also known as the “Lightning Network” or “LN”.
The Lightning Network is a decentralised network built on top of the Bitcoin network that enables instant, near-free, peer-to-peer payments. It is a key solution to Bitcoin’s scalability problems.
Although still in development, it is now deployed on the main network and is growing by the day, making a big breakthrough in terms of users and volume during 2021.
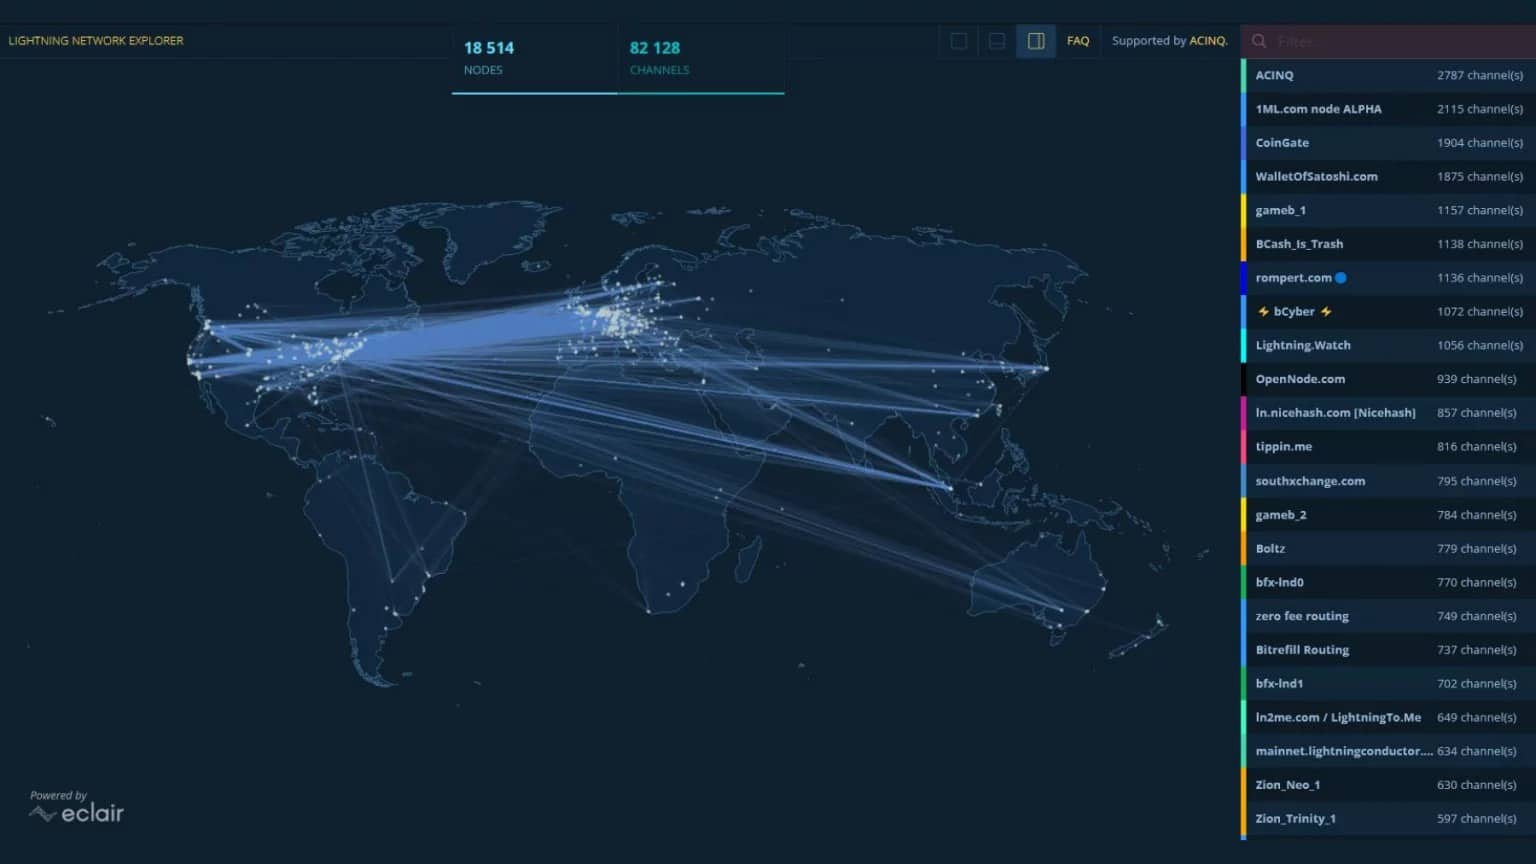
Figure 7: Global mapping of the Lightning Network
The purpose of this paragraph is not to offer a qualitative study of the evolution of the Lightning Network’s fundamentals, but rather to provide primary observations of the network’s development in order to broaden our lens and lay a foundation that will be supported in future analyses.
Thus, drawing on the data compiled by Willy Woo, we can identify a strong growth of the LN between 2018 and today, divided into several phases:
- Phase 1 (January 2018 to March 2019): the LN experiences moderate and then strong growth in the number of payment channels, thereby increasing network capacity. The number of active nodes grows steadily.
- Phase 2 (April to August 2019): the number of channels drops by about 25% during the summer 2019 bull run, limiting the maximum number of BTC potentially locked onto the network. The number of nodes continues to rise without abating.
- Phase 3 (September 2019 to August 2020): a plateau phase begins during which the number of channels and network capacity adopt a broadly lateral variation. The number of nodes continues to rise.
- Phase 4 (September 2020 to February 2022): on the cusp of the 2020 – 2021 bull market, a spontaneous increase in the number of channels and nodes paves the way for a historic increase in LN development.
- Phase 5 (February 2022 to present): following a stabilisation, the number of channels and nodes on the LN falls drastically before forming a local low.
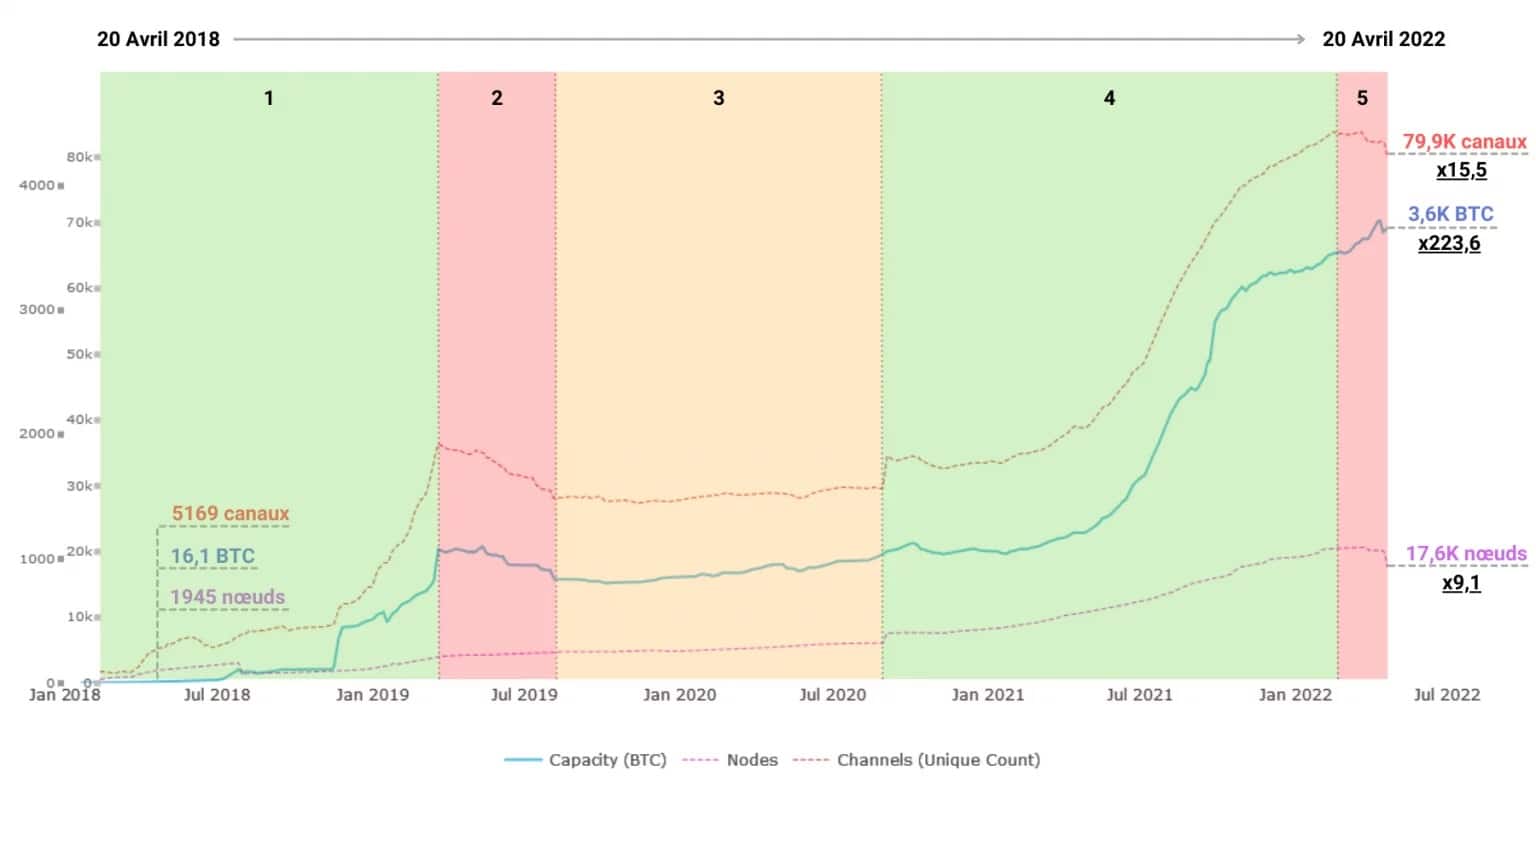
Figure 8: Number of nodes, channels and capacity of the Lightning Network
By doing so, over a four-year window (20 April 2018 to 20 April 2022), the number of payment channels will have increased by 15 times, the number of nodes by 9 times and the network capacity by 223 times. Despite a recent decline in the number of channels and nodes, the Lightning Network has expanded dramatically in its recent history, demonstrating its utility and capacity for growth.
Let us now take a closer look at the fluctuations of these parameters over the past year. By studying their evolution and their daily rate of change, it appears that we are currently in a phase of “correction” of the LN’s fundamentals.
We can first witness a doubling of the number of nodes between May 2021 and April 2022, followed by a moderate correction and then a sudden drop, resulting in an all-time record of 1,141 nodes closed in 24 hours. The number of knots is now stagnating at around 17 000.
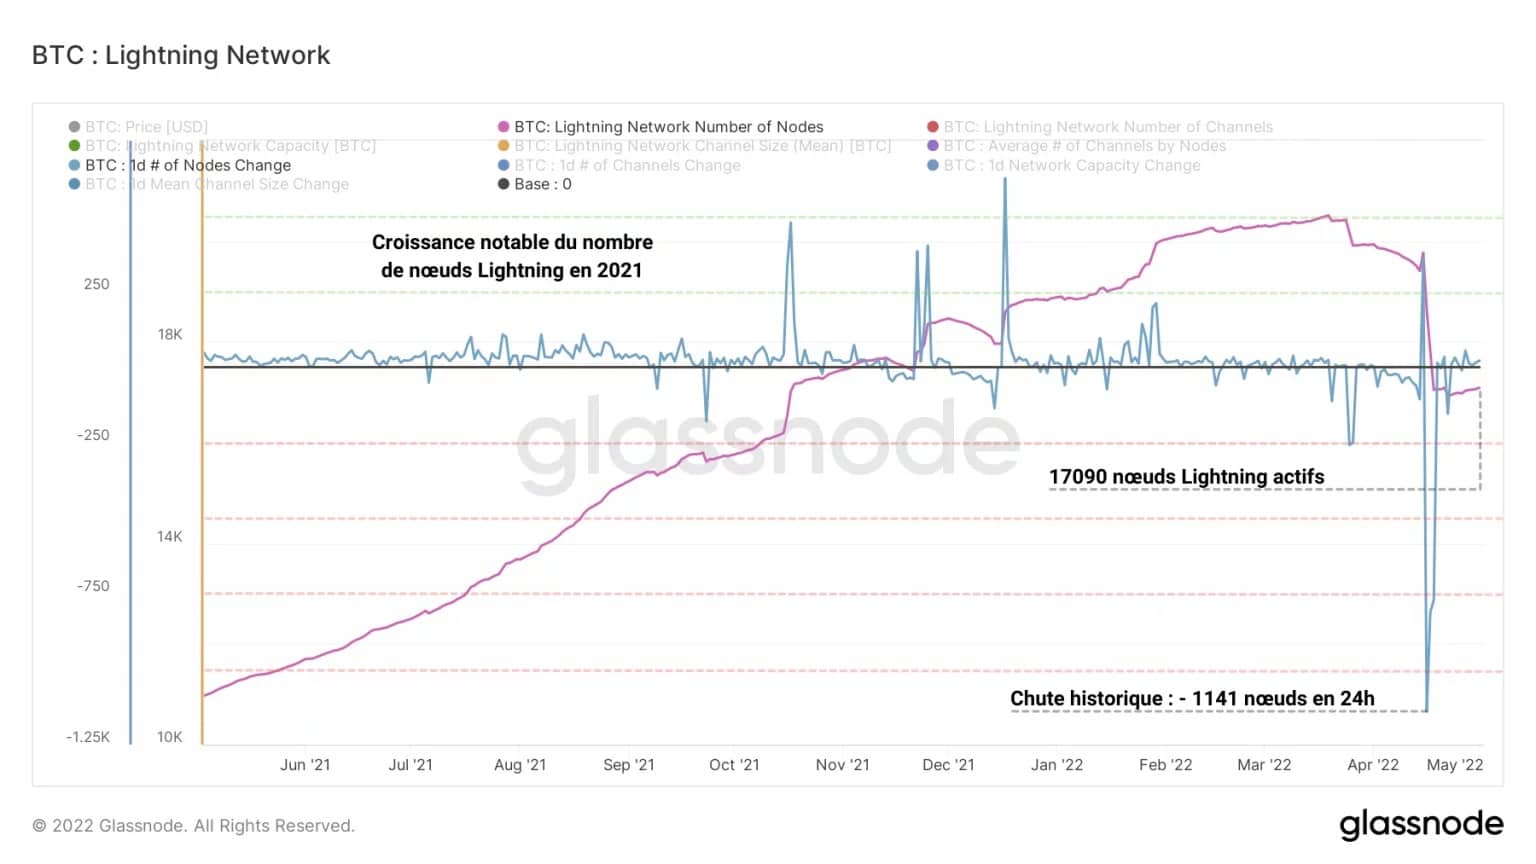
Figure 9: Number of Lightning Network nodes
The total number of open payment channels follows a very similar dynamic to that of nodes, although the closure of 1,052 channels on 18 April did not prevent a rapid recovery in this parameter. It seems that the remaining nodes on the network are opening new channels to make up for the recent drop.
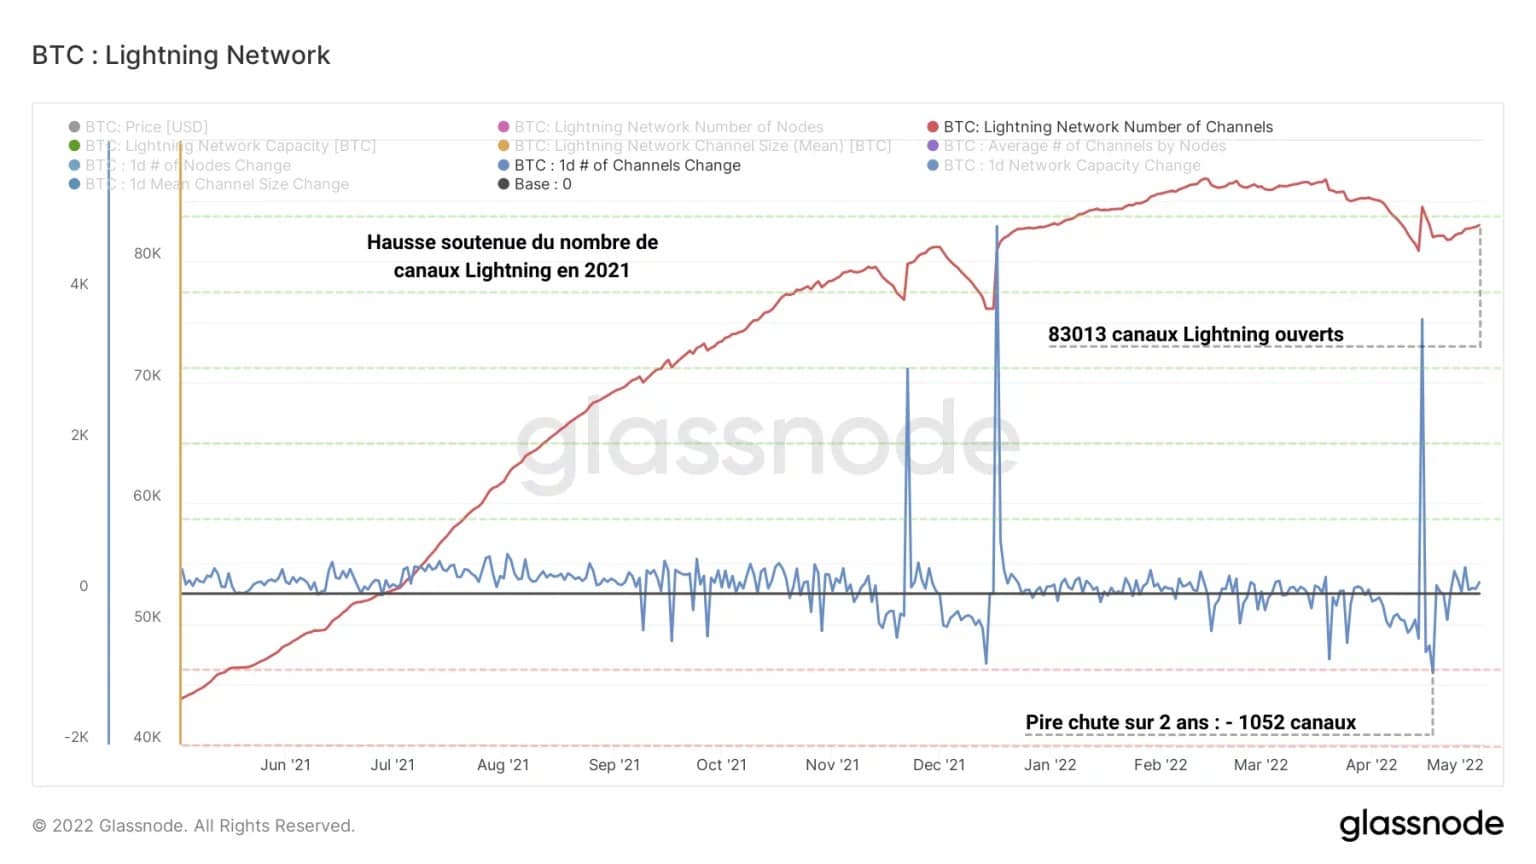
Figure 10: Lightning Network channel count
In addition, we can observe a growth in LN channel size from May to October 2021 and then a stagnation until March 2022. Following a slight increase in the last two months, this parameter currently reaches an ATH of 0.044 BTC.
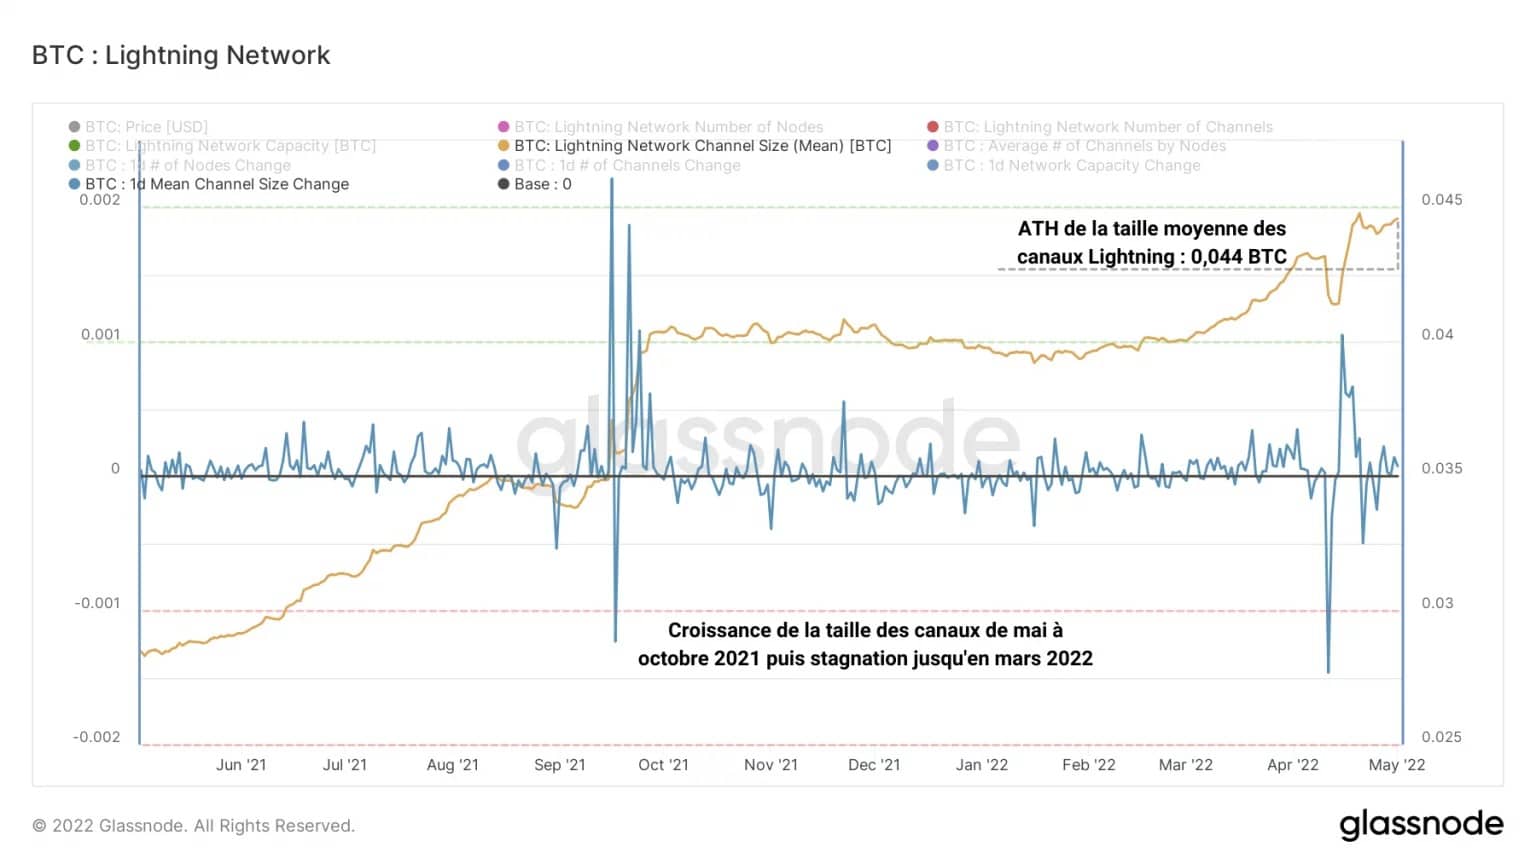
Figure 11: Lightning Network average channel size
Finally, the capacity of the LN (by which we mean all the BTC locked on the network), currently reaching an ATH of 3,702 BTC, is a function of the number of channels per node and the average channel size and represents to date about 0.28% of the total liquid supply (1.28 million BTC).
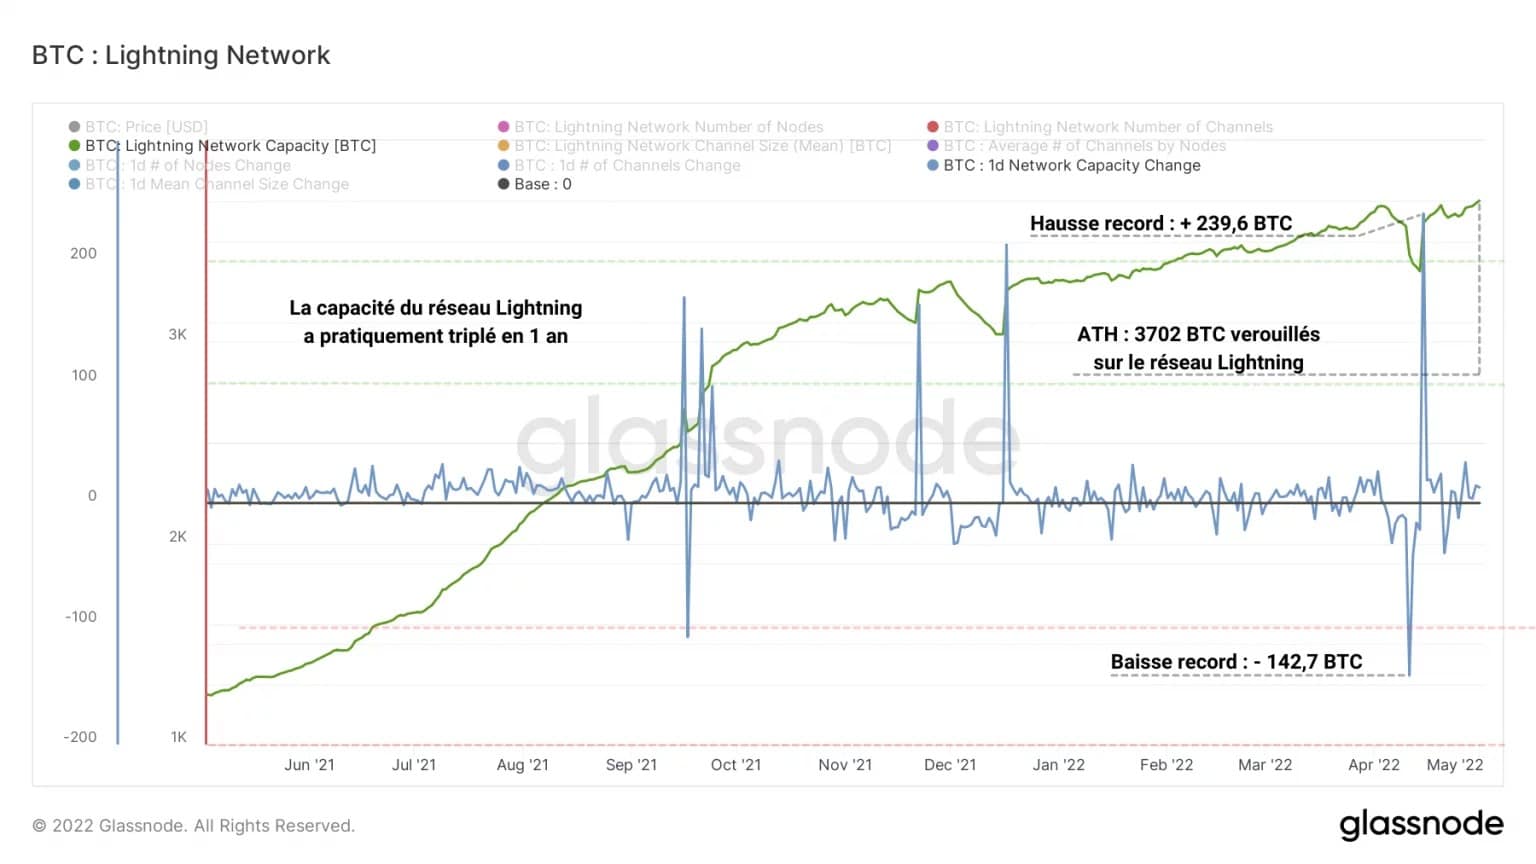
Figure 12: Lightning Network Capacity (BTC)
Despite a 200% increase in one year, the supply of BTC circulating within the LN is still a small portion of the total liquid supply, indicating that the Lightning Network’s growth is far from having peaked.
Summary of this on-chain analysis
It seems that despite unattractive price action, BTC is still attracting a lot of capital flows. While the pressure is forcing the hand of short-term investors, making losses just below their cost basis, long-term investors who have not yet capitulated are showing a strong insensitivity to price fluctuations.
The momentum of siphoning off exchange reserves is in full swing as nearly 100,000 BTC are moving from liquid to illiquid every day for several weeks, increasing the likelihood of a liquidity shock by the day.
Finally, after a meteoric growth throughout 2021, the Lightning Network overlay protocol is experiencing a momentary correction period. Although the number of nodes on the network is dropping noticeably, this decline does not appear to affect the operational capacity of the LN.