
The return to profitability of a portion of Bitcoin (BTC) holders is supporting the development of a bullish market structure. In the coming weeks, the behaviour of long-term holders should tend towards profit-taking.
Bitcoin consolidates towards $22,000
After a particularly bullish January, the price of Bitcoin (BTC) is consolidating around $22,000, forming the first range of the year 2023.
Now that the majority of BTC investors are in latent profit, notable changes in short and long term holder behaviour should gradually manifest themselves and shift the market structure towards a bullish bias.
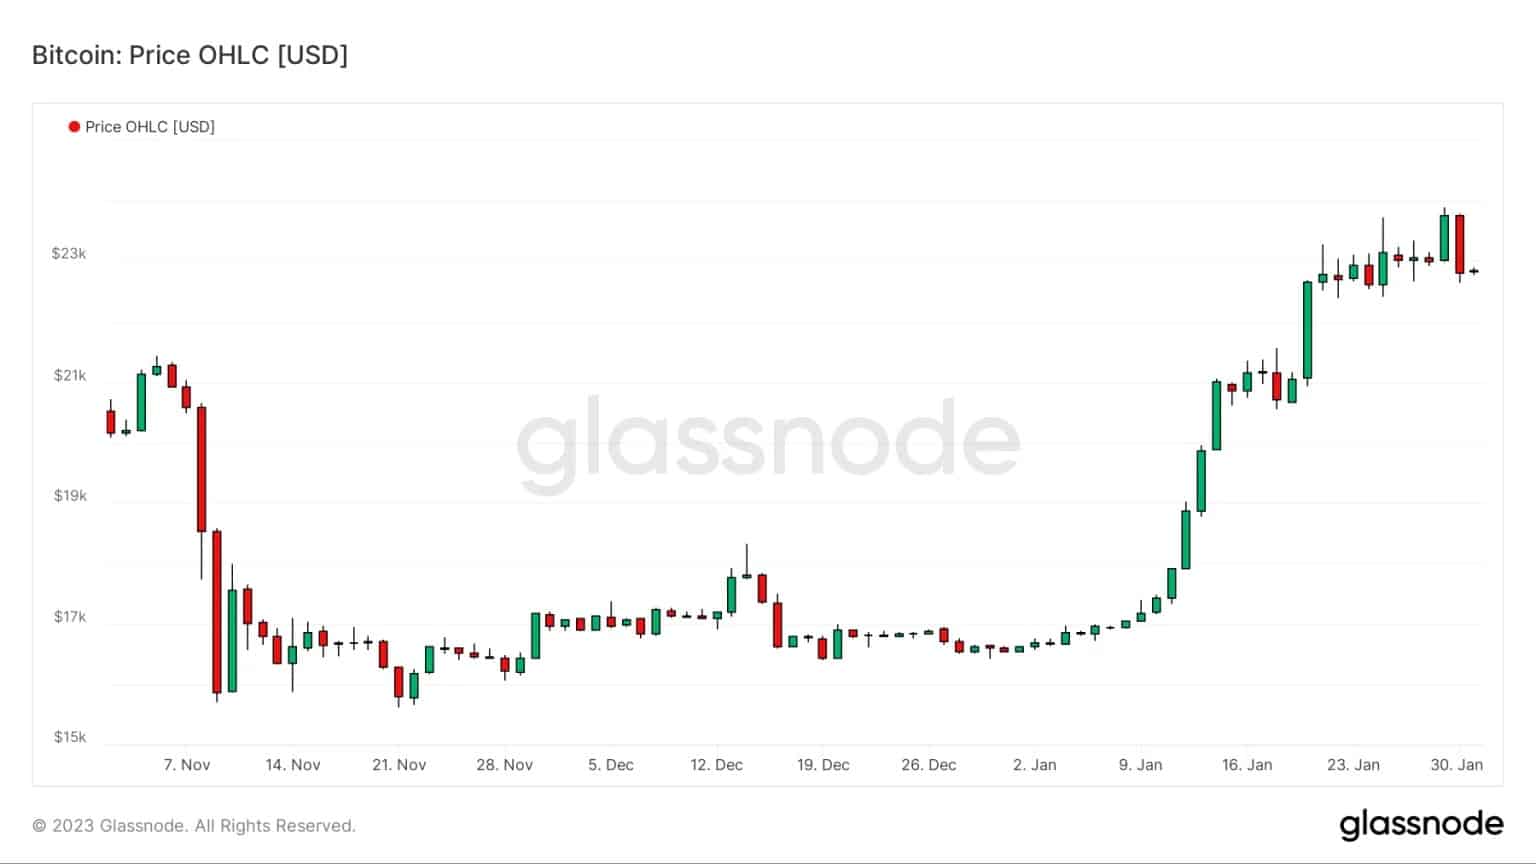
Figure 1: Daily BTC price
Today we will look at the current condition of long term holders (LTH) as well as their potential future behavior to determine the characteristics of a long term bullish bias for BTC.
The cyclical behaviour of LTH
The cycles of the BTC market are driven by several parameters, one of the main ones being the profitability of BTC holders.
With participants saving and going dormant or spending and trading, the marginal return on capital is a major driver of economic activity.
This return to profitability can be seen in the interaction between the BTC spot price and the various on-chain cost bases that reflect the buying/selling behaviour of participants.
While in the past few weeks we have seen the realised price of long term holders (LTH) at around $22,300 as the ultimate on-chain resistance level to be breached, it has now been overtaken by the spot price.
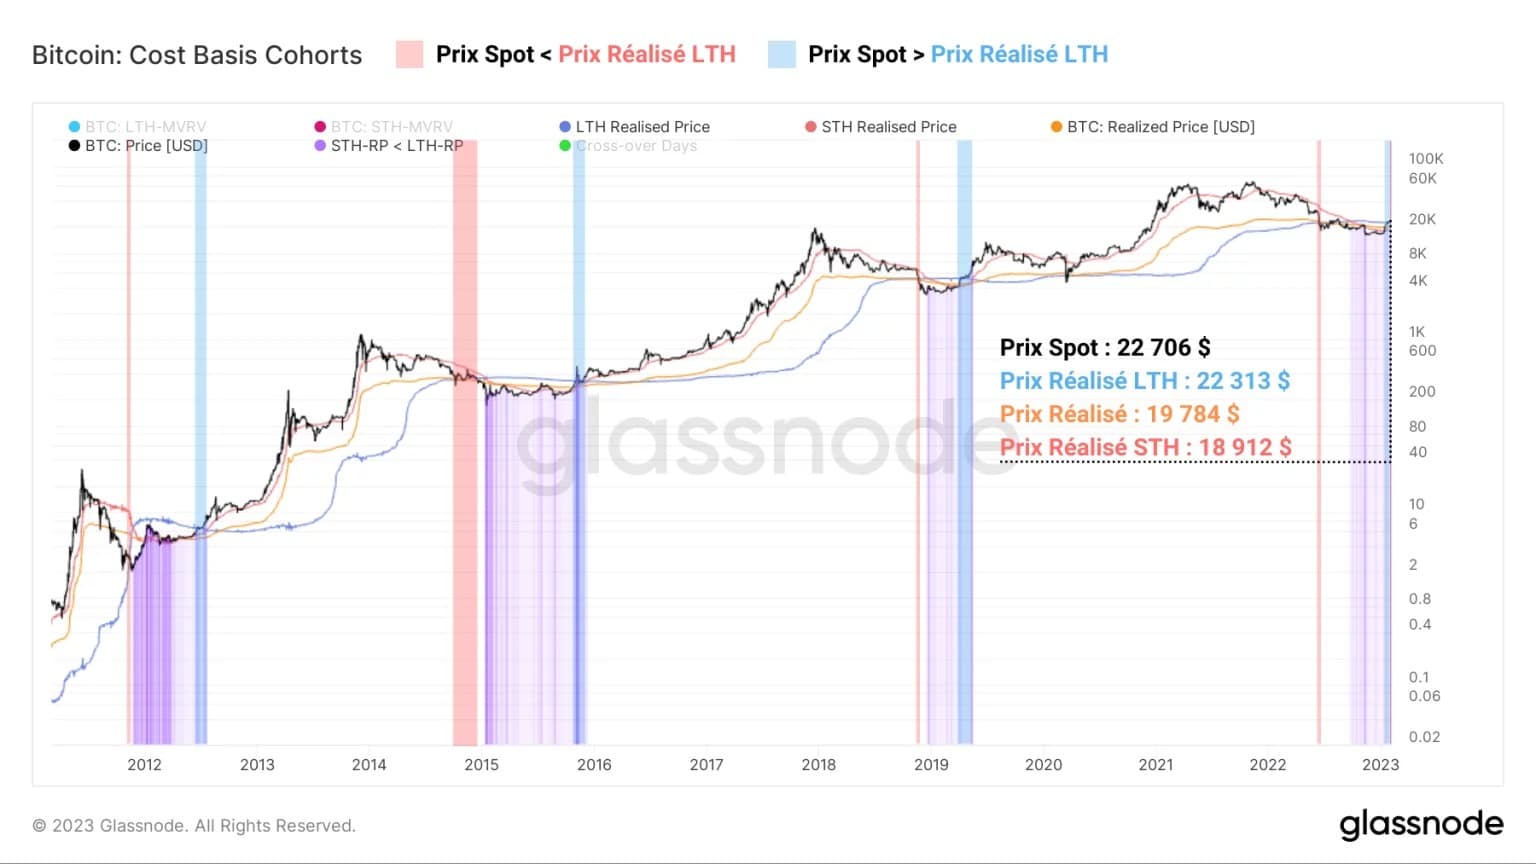
Figure 2: Realised price (average, STH, LTH)
This indicates that the majority of BTC holders are now out of the woods and able to spend their holdings at a profit, forming the basis for a long-term bullish move.
Historically, bullish crossings of the realised price of LTHs (in blue) precede bull markets with indisputable accuracy. This long-term return to profitability dynamic is also measurable via the LTH-MVRV metric, which measures the difference between the BTC spot price and the realised LTH price.
- When the LTH-MVRV is greater than 1, the average long-term holder is in latent profit;
- When the LTH-MVRV is less than 1 (green zone), the average long-term holder is in unrealised loss;
If the LTH-MVRV is equal or close to 1, the profitability of the average long-term holder is approaching equilibrium.
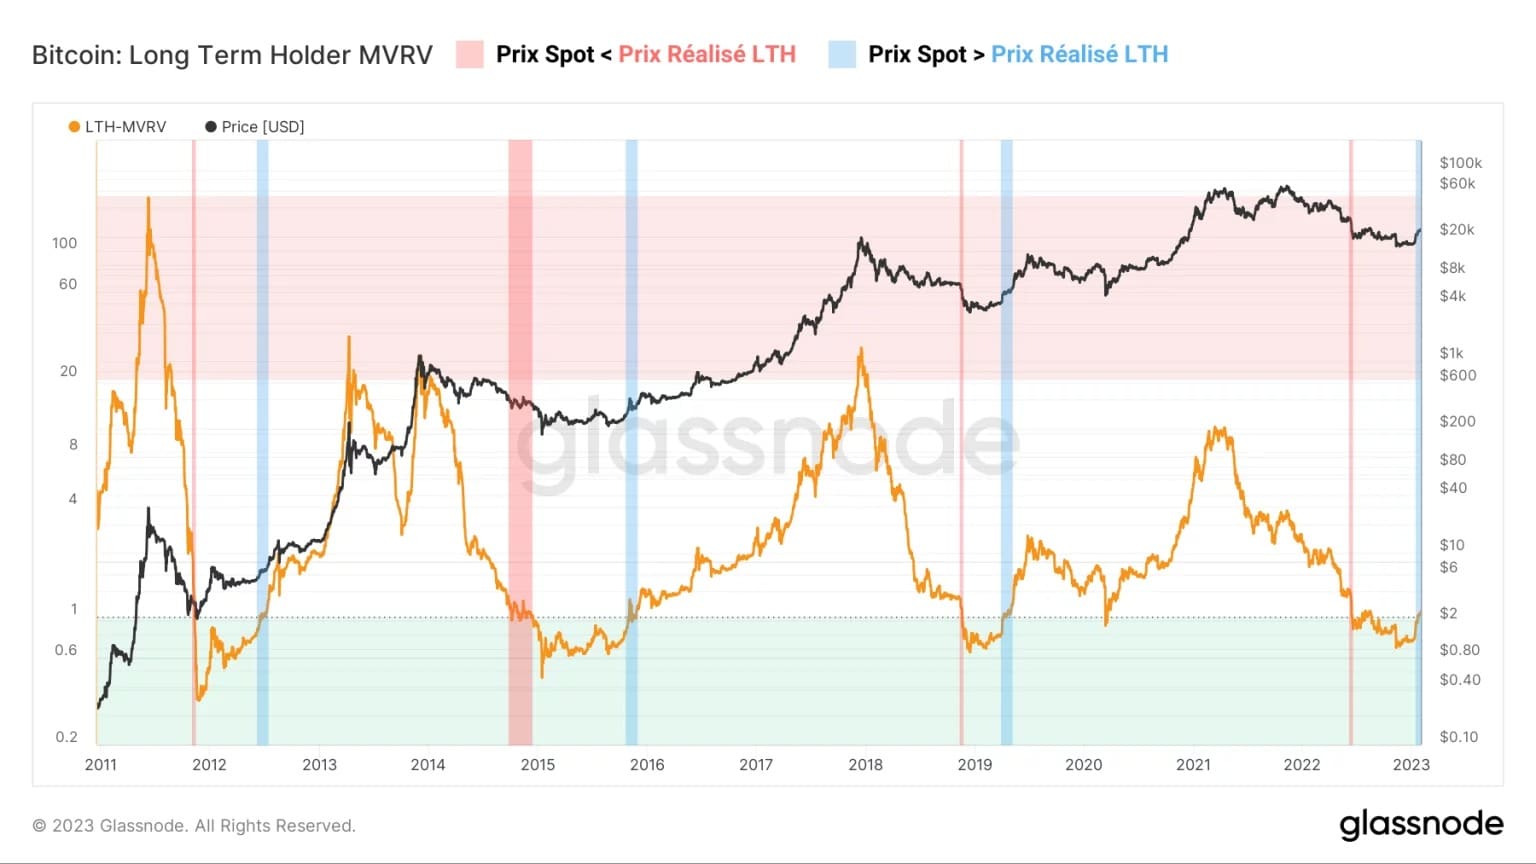
Figure 3: LTH-MVRV ratio
Confirming previous observations, the recent jump in the LTH-MVRV above 1 indicates a fourth historic return to long-term profitability that traditionally marks the transition from the end of bear markets to the beginning of bull markets.
Now that the latent profitability of LTHs is back in positive territory, we should see a crucial change in the behaviour of this cohort in the coming weeks. Indeed, the cyclical behaviour of LTHs can be defined by three phases:
- The HODLing (in light red): LTH profitability falls as an up cycle ends. The cohort locks in their positions and aggressively accumulates as the price falls;
- Loss taking (dark red): Bear market pain reaches its peak, forcing the least resilient holders to sell at a loss;
- Profit taking (blue): LTH profitability climbs as a new bull run begins. The cohort unlocks its positions and distributes massively.
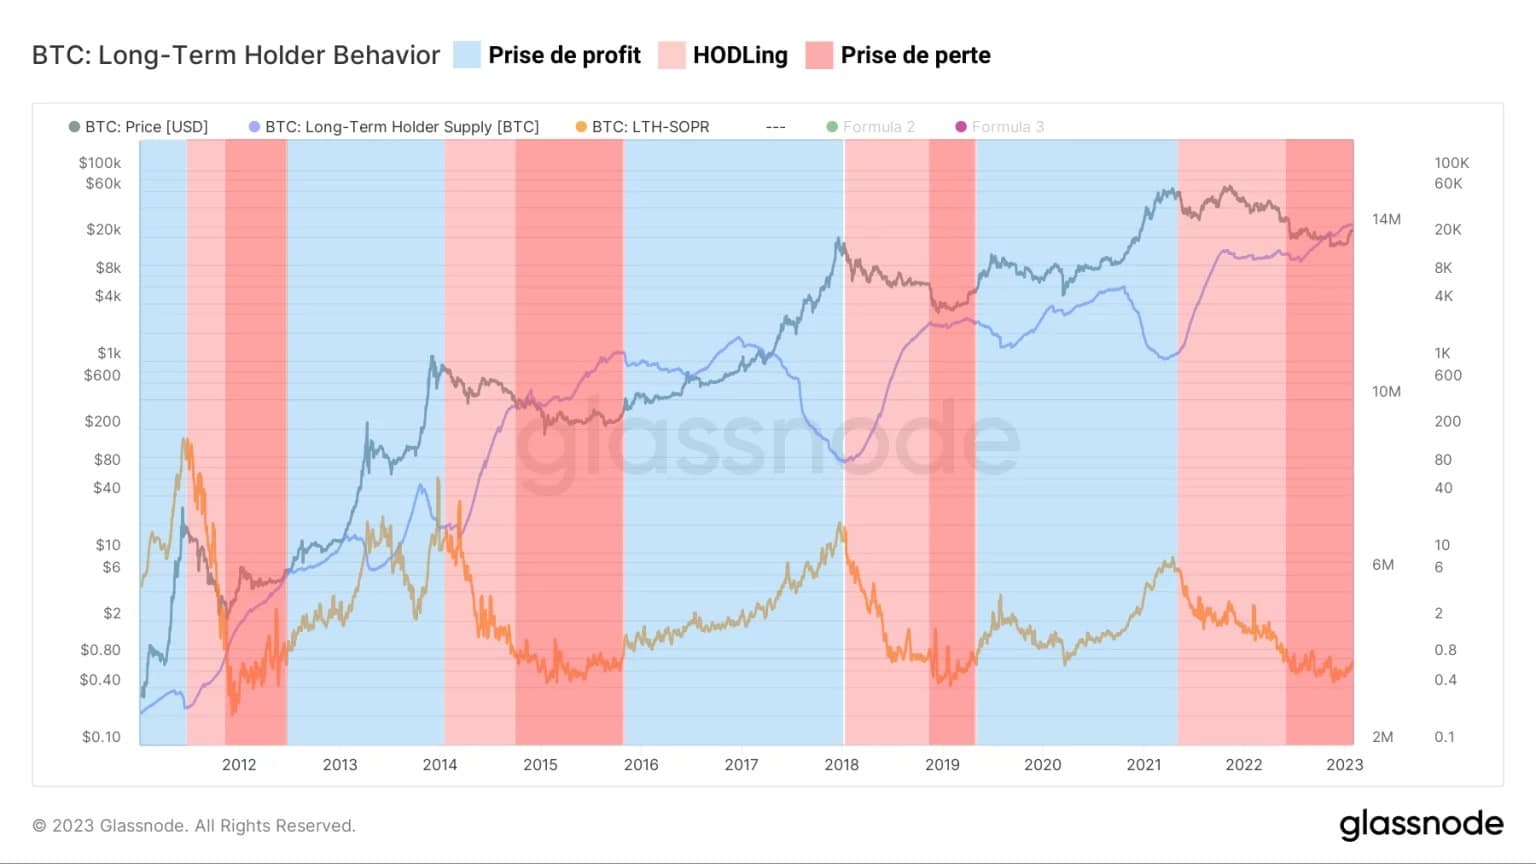
Figure 4: Supply held by LTHs (blue) and LTH expense ratio (orange)
Thus, a fall in LTH supply (distribution), coupled with an increase in their profitability ratio above 1 (profit taking) would indicate that phase 3 is underway. This profit-taking behaviour in the strength of an increase is also measurable by the age of the dormant supply. Indeed, BTC supply that is at least one year old is an excellent indicator of market behavioural cycles.
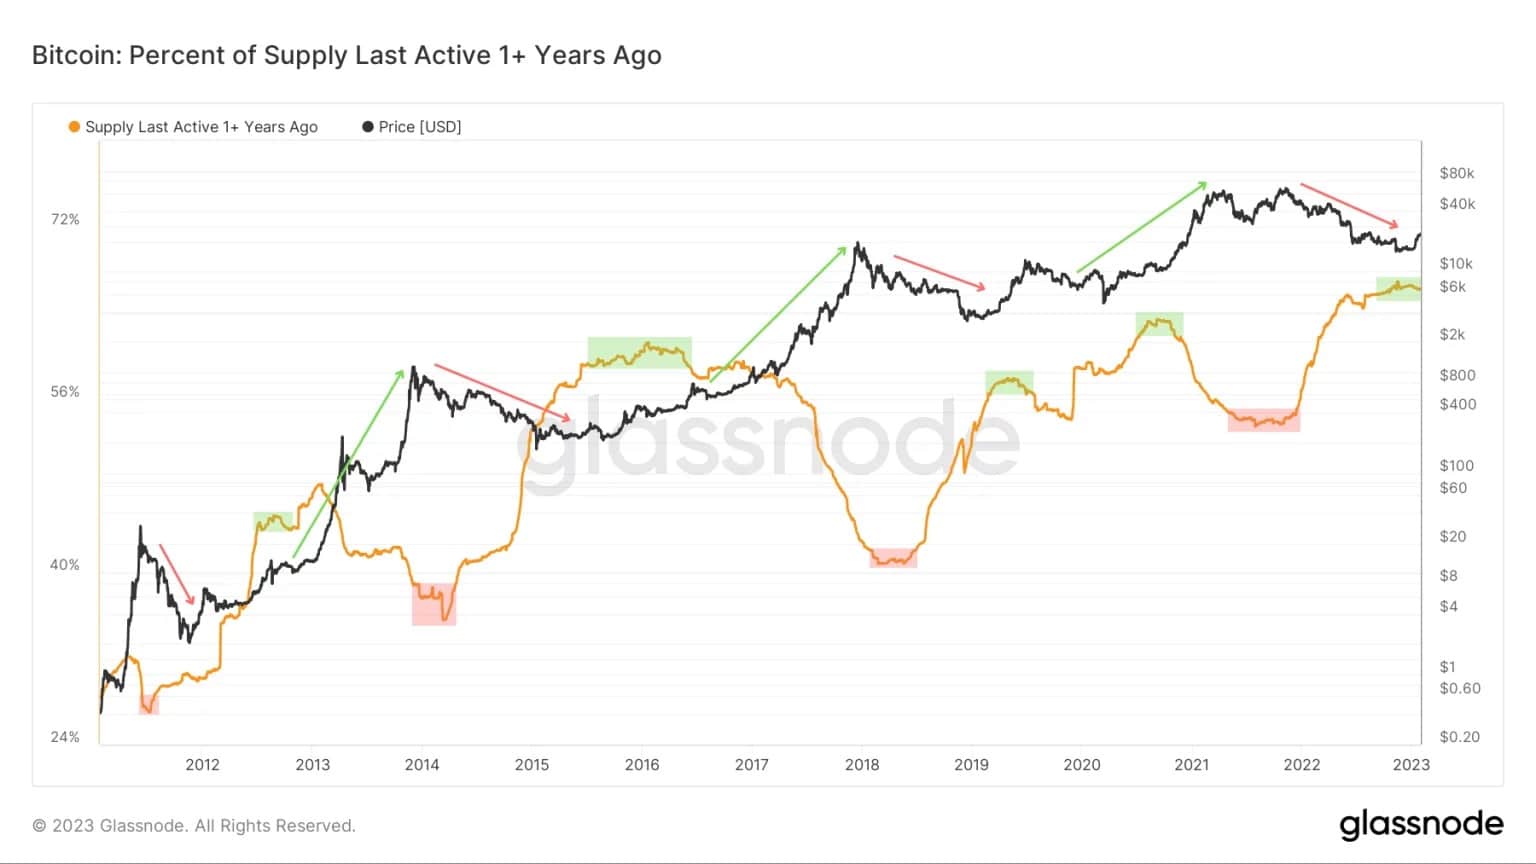
Figure 5: Percentage of supply at least one year old
We can assume that many old HODLed BTC are about to be distributed with profits during a bull market when this metric forms a top (green).
Conversely, a bottom reversing upwards (red) indicates the return of HODLing (savings) as a bull market comes to an end.
Currently, the formation of a cyclical top in the supply of BTC at least one year old indicates that long-term holders have slowed their accumulation and are waiting for a rise in the BTC price to begin the profit-taking phase described above.
Summary of this on-chain analysis of BTC
Overall, this week’s data indicates that the return to profitability of all holder cohorts is supporting the development of a bull market structure.
The fact that the LTH cohort has come out on top suggests that the behaviour of long term holders should tend in the coming weeks towards a profitable distribution of their holdings.
This dynamic would anchor the market in an early bull run where new demand would absorb the selling pressure from the LTH profit-taking.