
The cryptocurrency market is in troubled waters. Bitcoin’s (BTC) correlation with North American indices, coupled with the global economic and political uncertainty, is causing derivatives market participants to shed risky positions while long-term investors show no signs of panic. On-chain analysis of the situation
Bitcoin back to $36,000 support
The Bitcoin (BTC) price is entering the last week of February in uncertainty. Having missed the break of the $45,000 level, BTC is now just below the lower bound of the Supertrend indicator discussed in Tagado’s technical analysis on Saturday.
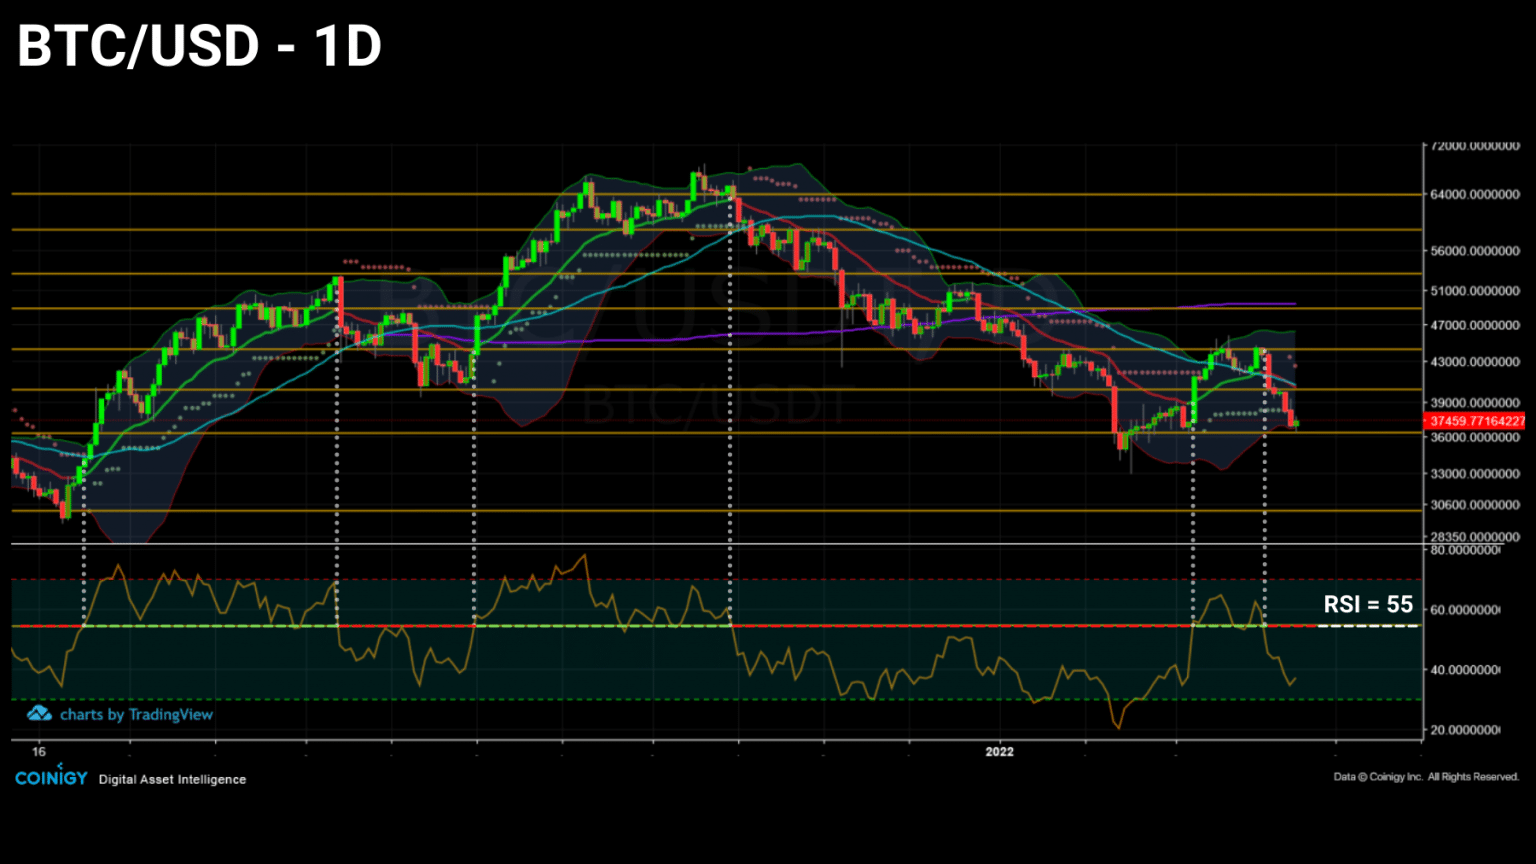
Daily chart of Bitcoin price
As the global political and economic backdrop tightens, the correlation between BTC and traditional market indices is tightening, suggesting erratic price action in the days ahead.
This week we will look at how speculators in the derivatives markets are reacting to this uncertainty. We will then gauge the HODLing behaviour of investors over the long term before assessing various fundamental aspects of the Bitcoin network and the market.
Discarding risky positions
Given the turbulent equity market environment, bitcoin should not be expected to break away from the North American indices any time soon.
As illustrated by TXMC, BTC is tracking the S&P500, Dow Jones and Nasdaq, but with volatility unique to the nascent crypto-currency sector.
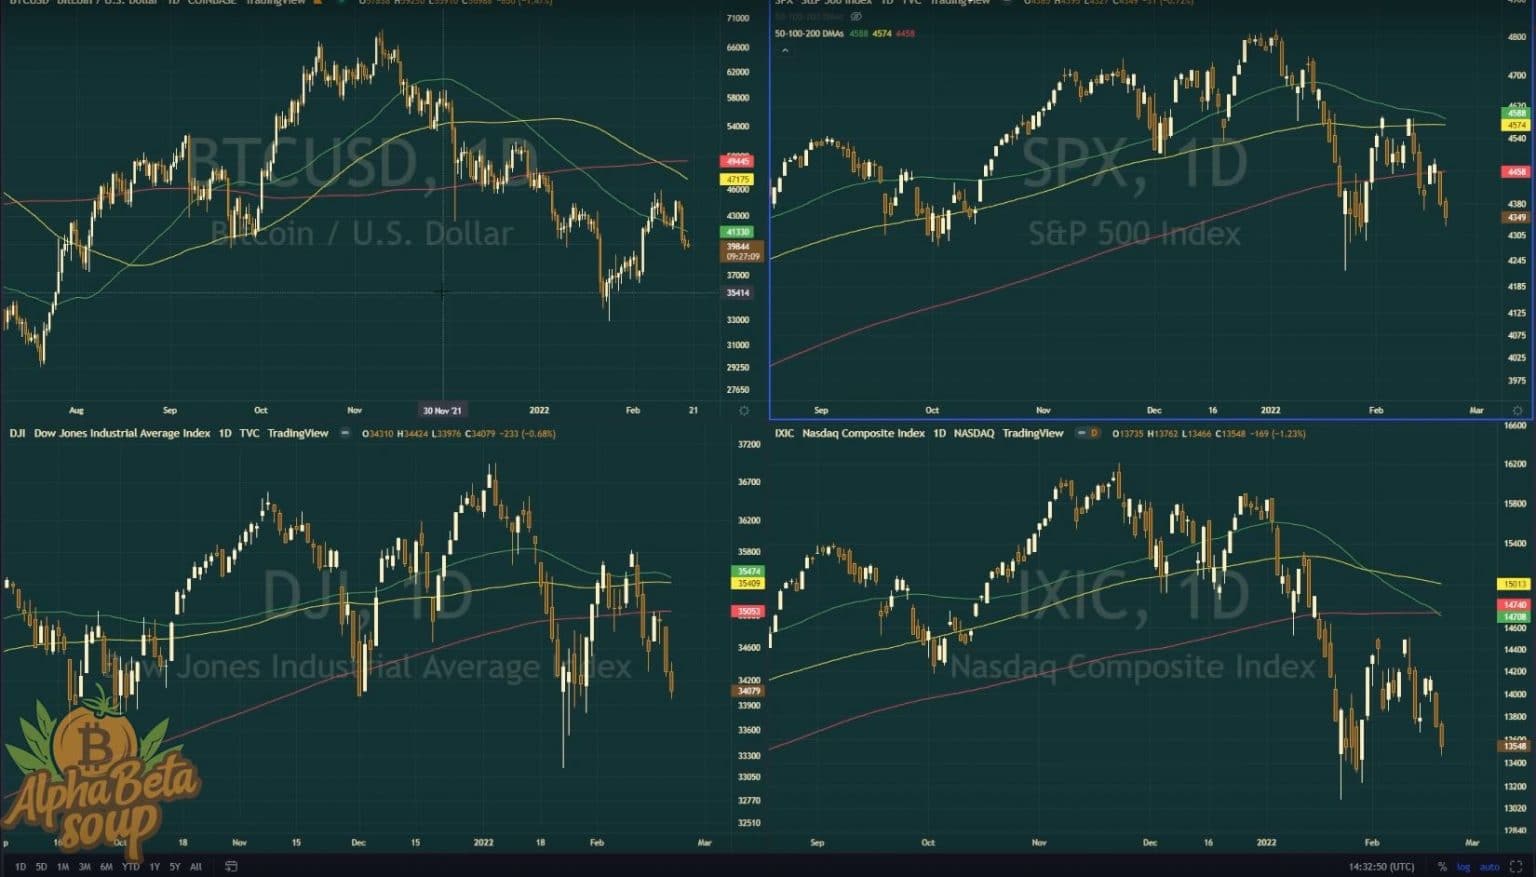
Excerpt from TXMC’s Alpha Beta Soup video
This structural uncertainty in the markets is not lost on the speculators in the derivatives markets who have begun, voluntarily or involuntarily, to unload their positions.
As evidenced by the continued decline in the dominance of open interest, capital flows out of the derivatives markets indicate a willingness by speculators to limit risk taking.
Currently accounting for 1.8% of BTC’s market capitalisation, total funds allocated to futures are gradually moving away from their overheating zone.
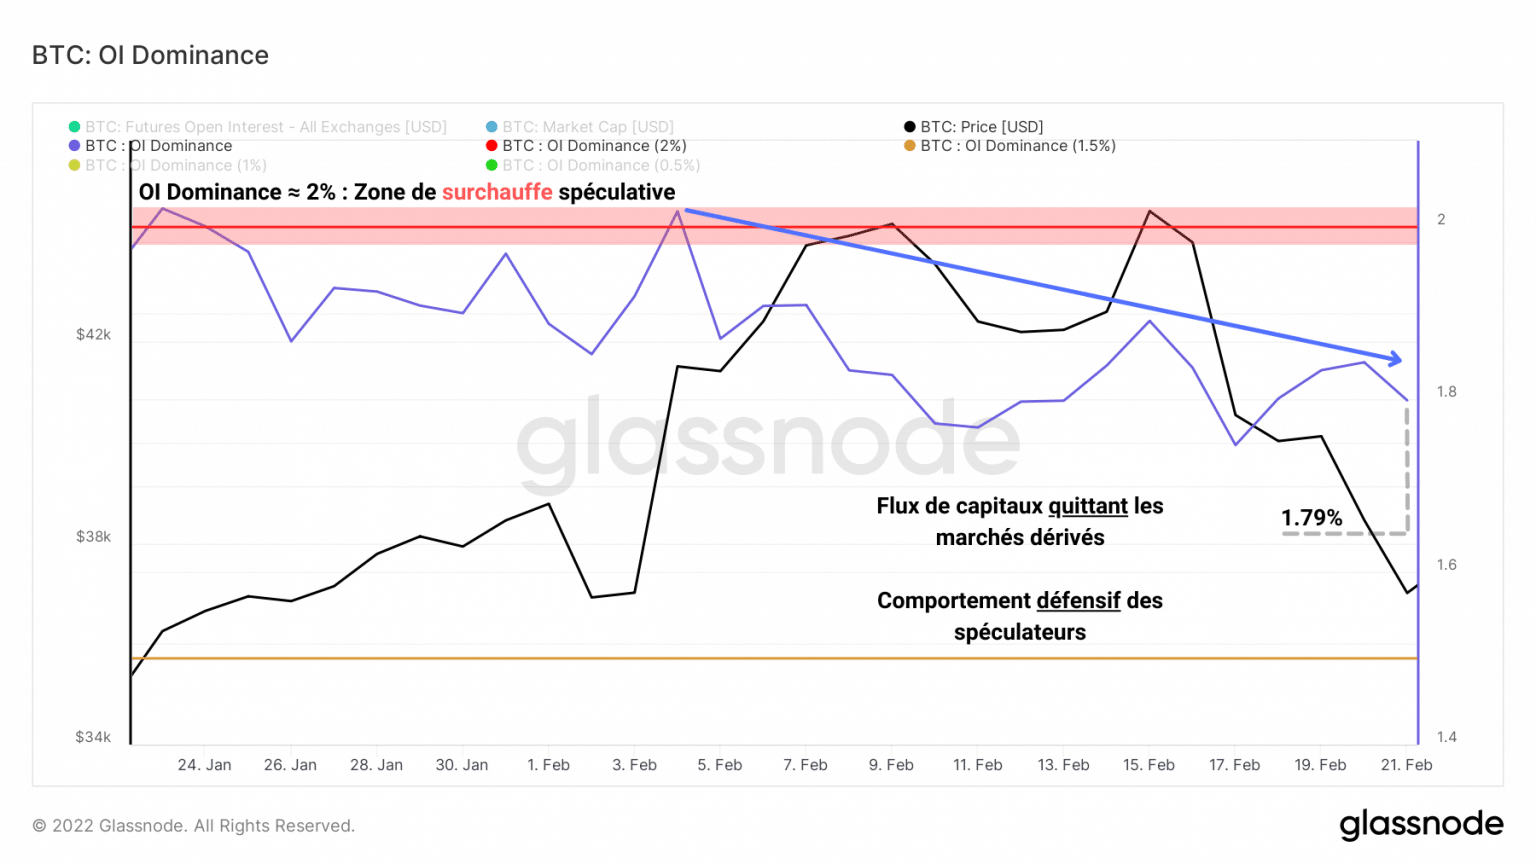
Chart of open interest dominance towards BTC
This defensive behaviour reflects the caution of these participants, preferring to wait for better days before leveraging again.
In addition, the drop in total futures trading volume over the past month indicates reduced speculator activity.
Note, however, that at the time of writing, open interest volume is printing a new weekly ATH, a sign that some participants are reacting strongly to the current price level.
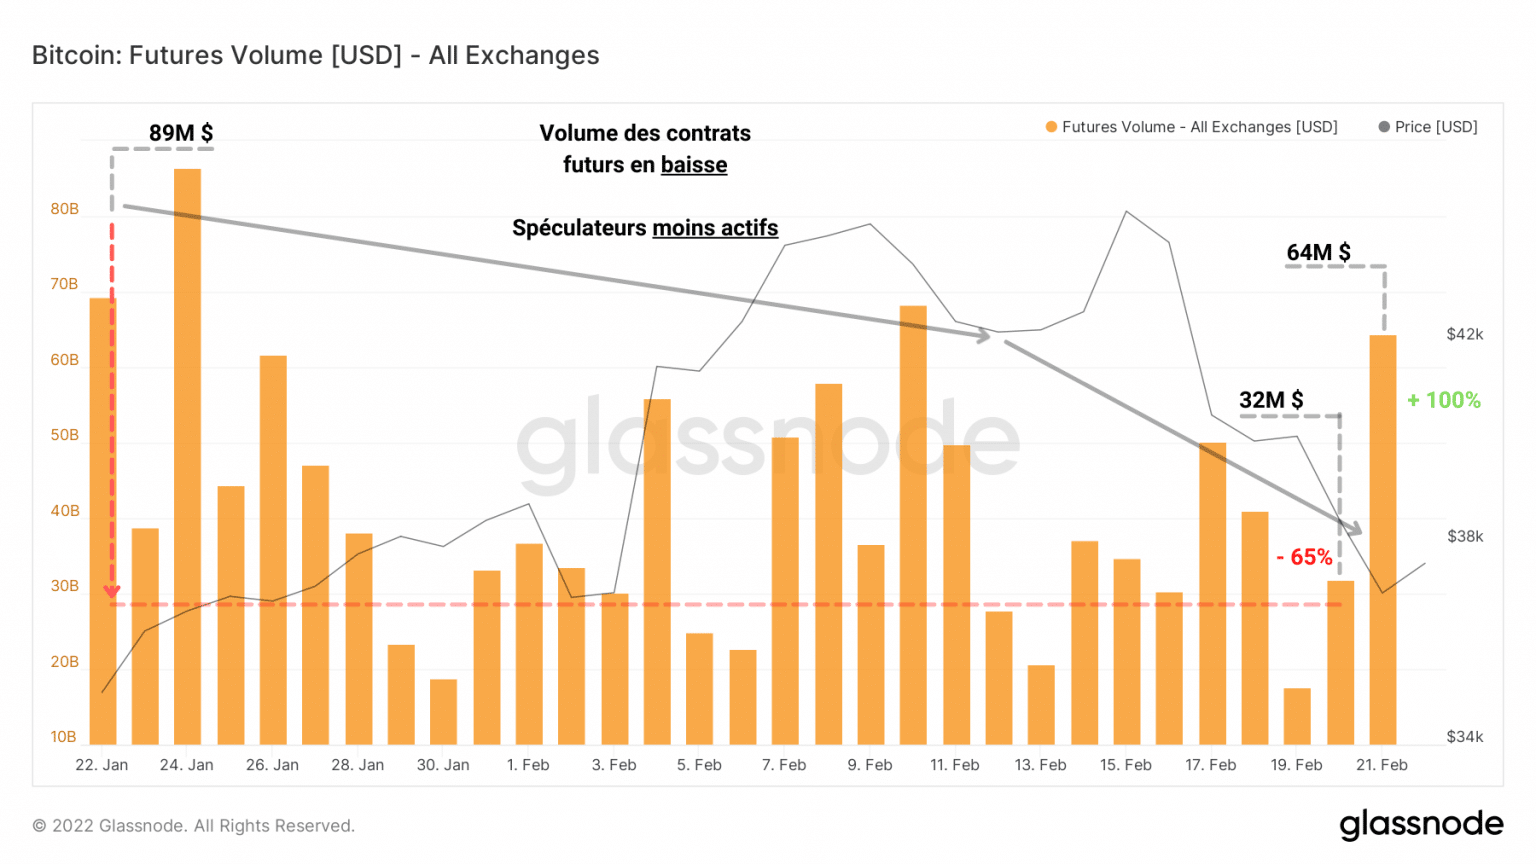
Bitcoin open interest volume chart
Looking more closely at the daily change in open interest in BTC, we can see the erratic nature of its variation over the past few weeks.
All indications are that February has been a period full of surprises for participants in the derivatives markets, with many moments of doubt and strong liquidation events.
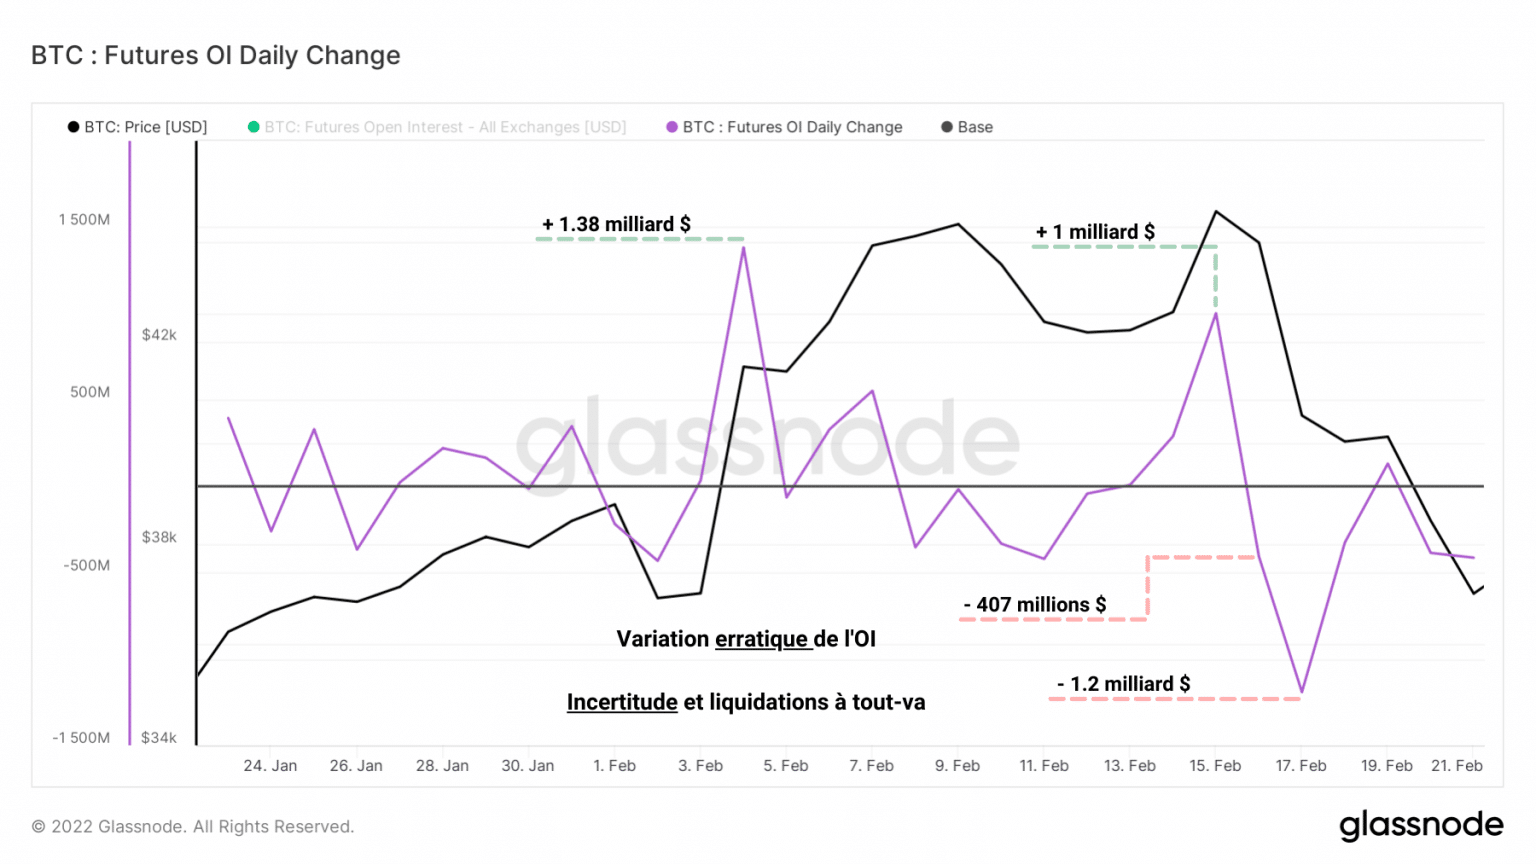
Chart of daily change in open interest
As evidenced by the long liquidation dominance chart, large magnitudes of forced closes have taken place, both on the buy and sell side.
Alternating between large long and short liquidation movements, the market is unable to take a clear direction at the moment.
However, the short to medium term trend in the bitcoin price favours a continuation of the decline should the $36,000 support be invalidated with sufficient power.
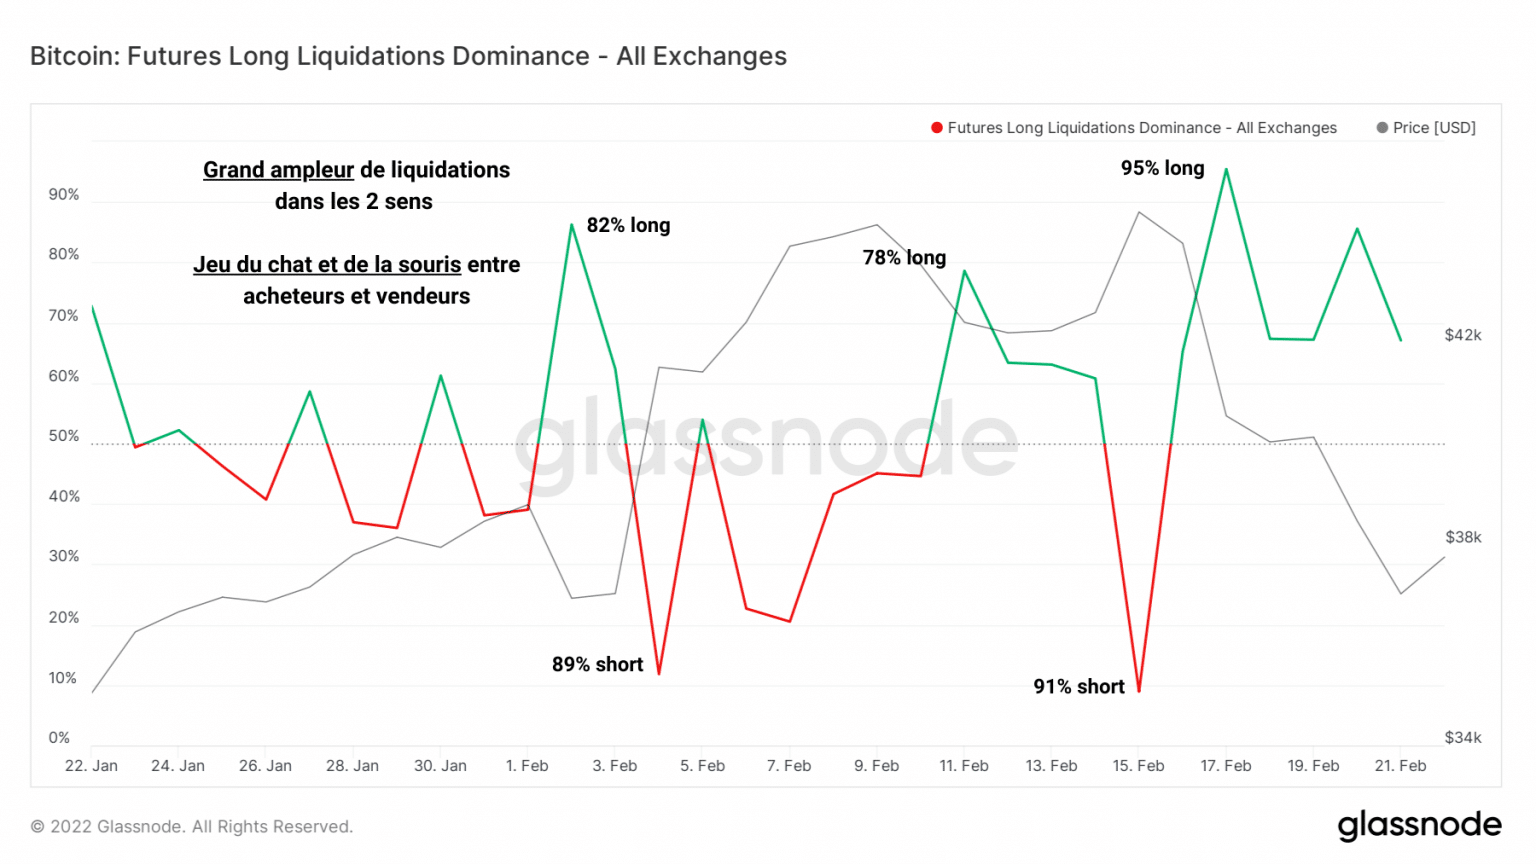
Long liquidation dominance chart
It is therefore in this context of uncertainty and unpredictable price action that speculators in the derivatives markets offload part of their positions in order to reduce their exposure to risk.
Exemplary HODLing behaviour
As for long-term investors, it seems that they are as phlegmatic as usual. Very conservative spending behaviour indicates that few are willing to sell BTC at such low prices.
Based on data provided by bullfromsea, it appears that the days of destroyed tokens (JJD) generated by entities holding at least 100 BTC have continued to decline since November.
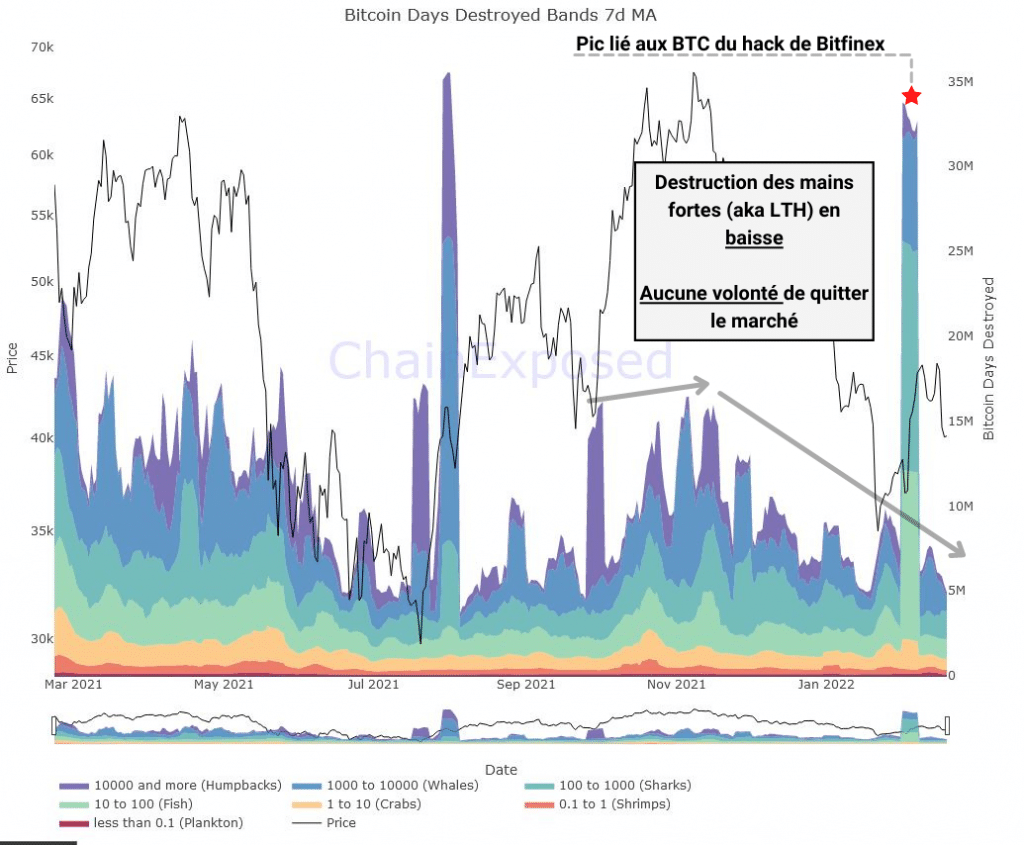
Graph of destroyed token day bands
Apart from the spike in destruction caused by the Bitcoin shift related to the Bitfinex hack, we can observe a steady decline in the JJD count of the majority of cohorts.
Corroborating this observation, the BTC dormancy flow has been forming a generational low since December that is worth mentioning.
This indicator, obtained by dividing the number of JJDs on an annual basis by the market capitalisation of BTC, can be used to determine market lows and assess the spending behaviour of LTH.
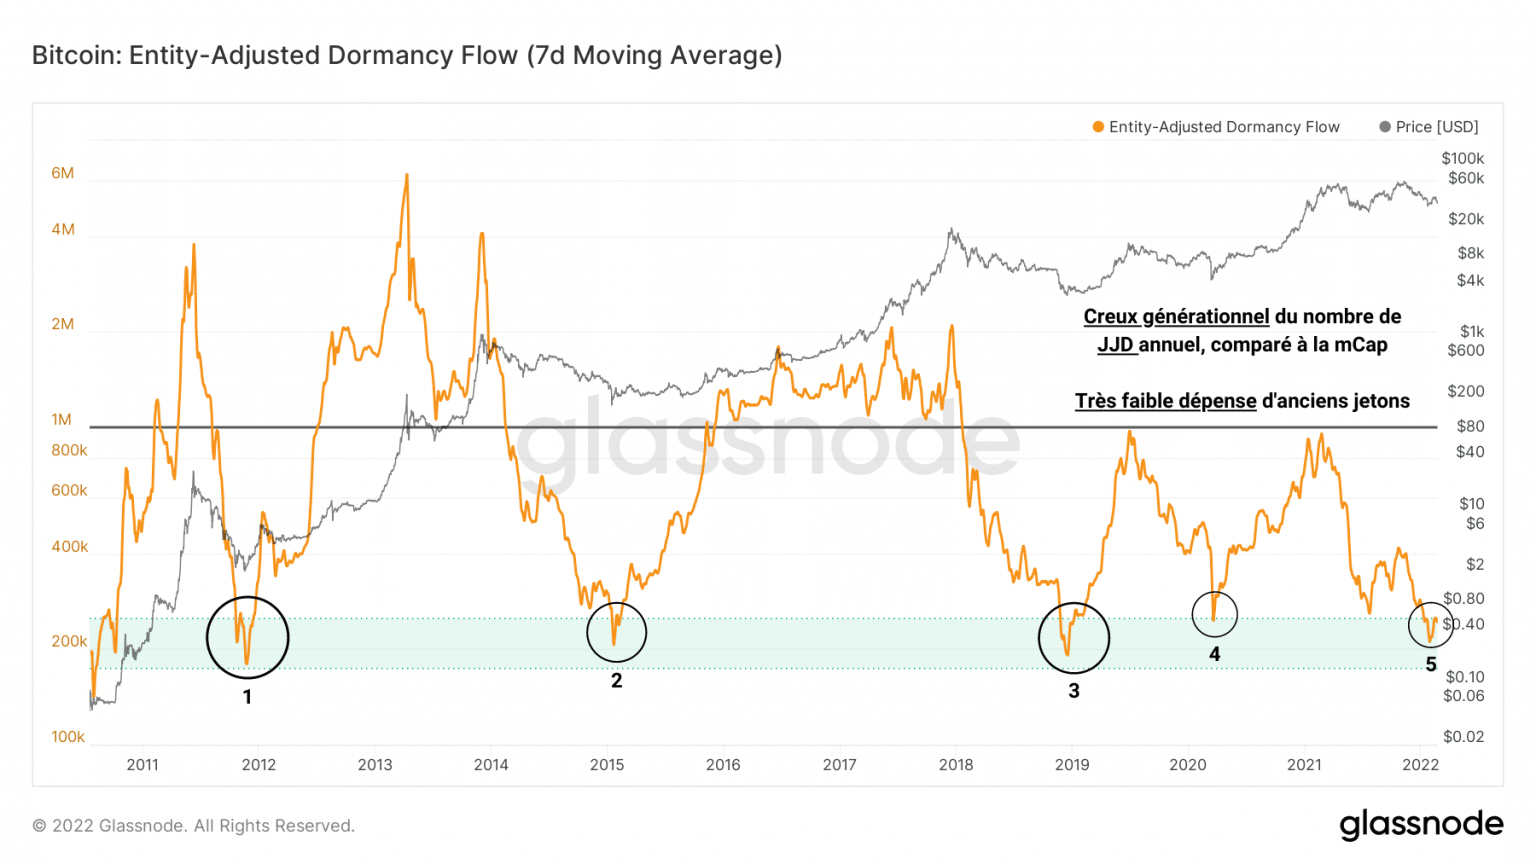
Dormant Flow Chart
Forming a fifth generational trough, it tells us that, despite a sharp drop in mCap, very few old tokens are being put into motion.
A sign of global HODLing behaviour, this indicator allows us to rule out the possibility of a dead cat bounce where seasoned investors dump their tokens in order to leave a suffering market.
Another metric that mitigates our negativity bias while remaining cautious in the short term is the RLV ratio, which has stopped rising and is now falling in tandem with the bitcoin price.
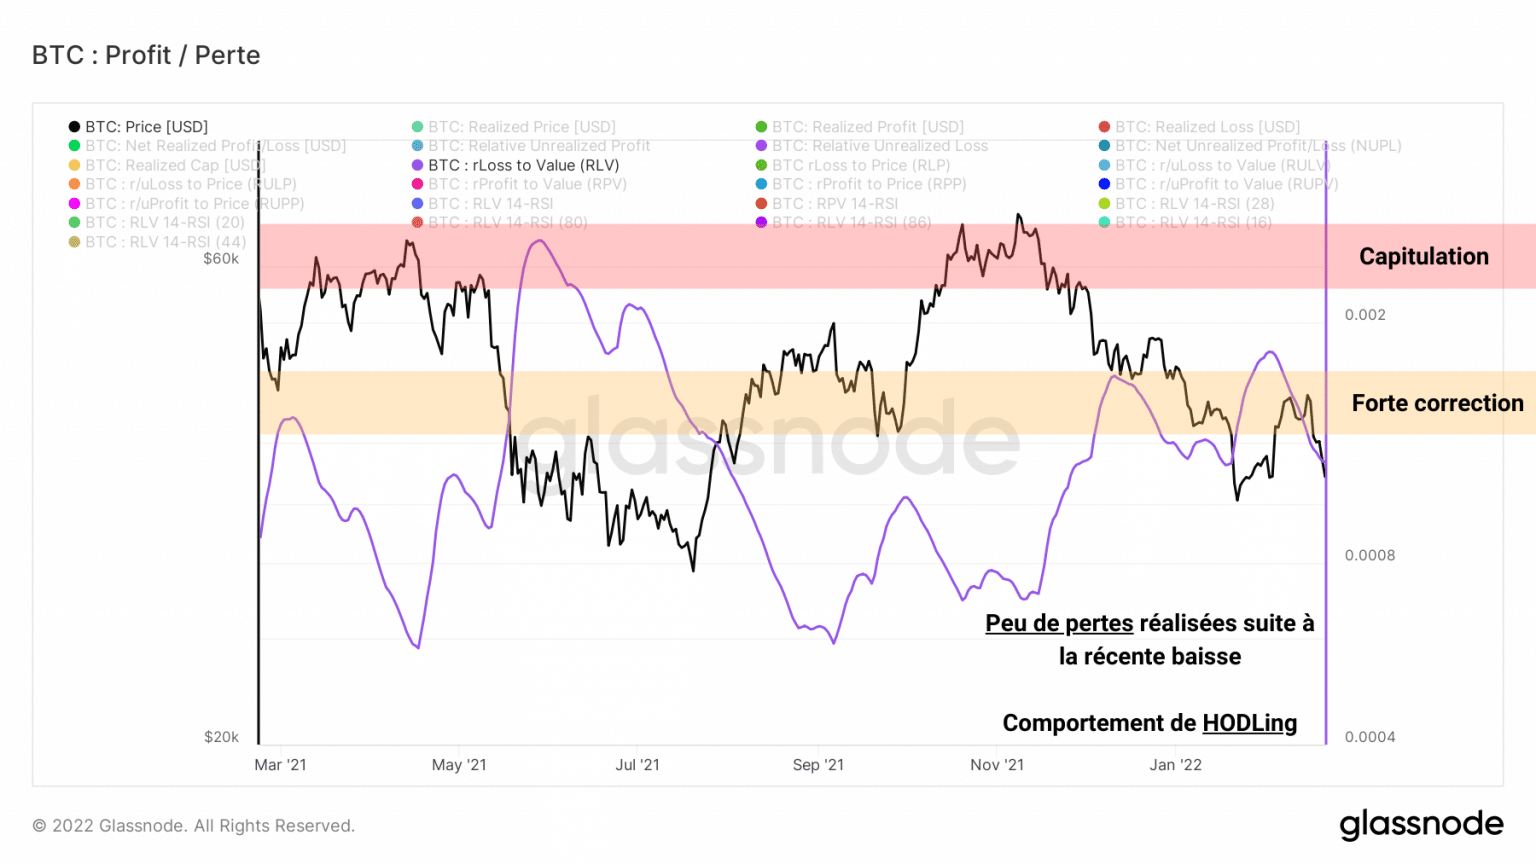
RLV ratio chart
This means that, despite the fall caused by the rejection of the $45,000 resistance, few losses were realized. In other words, although the price is falling again, no significant losses have been recorded by the market.
Once again showing stubborn behaviour, refusing to give in to selling pressure, the market is accumulating latent losses.
It should be noted, however, that these losses could be realised very quickly if the $36,000 level were to give way and could lead to a capitulation event which it is wise not to dismiss unthinkingly.
Finally, the evolution of the reserves of the centralized exchange platforms allows us to add an additional note to this observation.
While many BTC flocked to the exchanges during the May capitulation, with the aim of being sold in panic, this behaviour has not been repeated in the current correction.
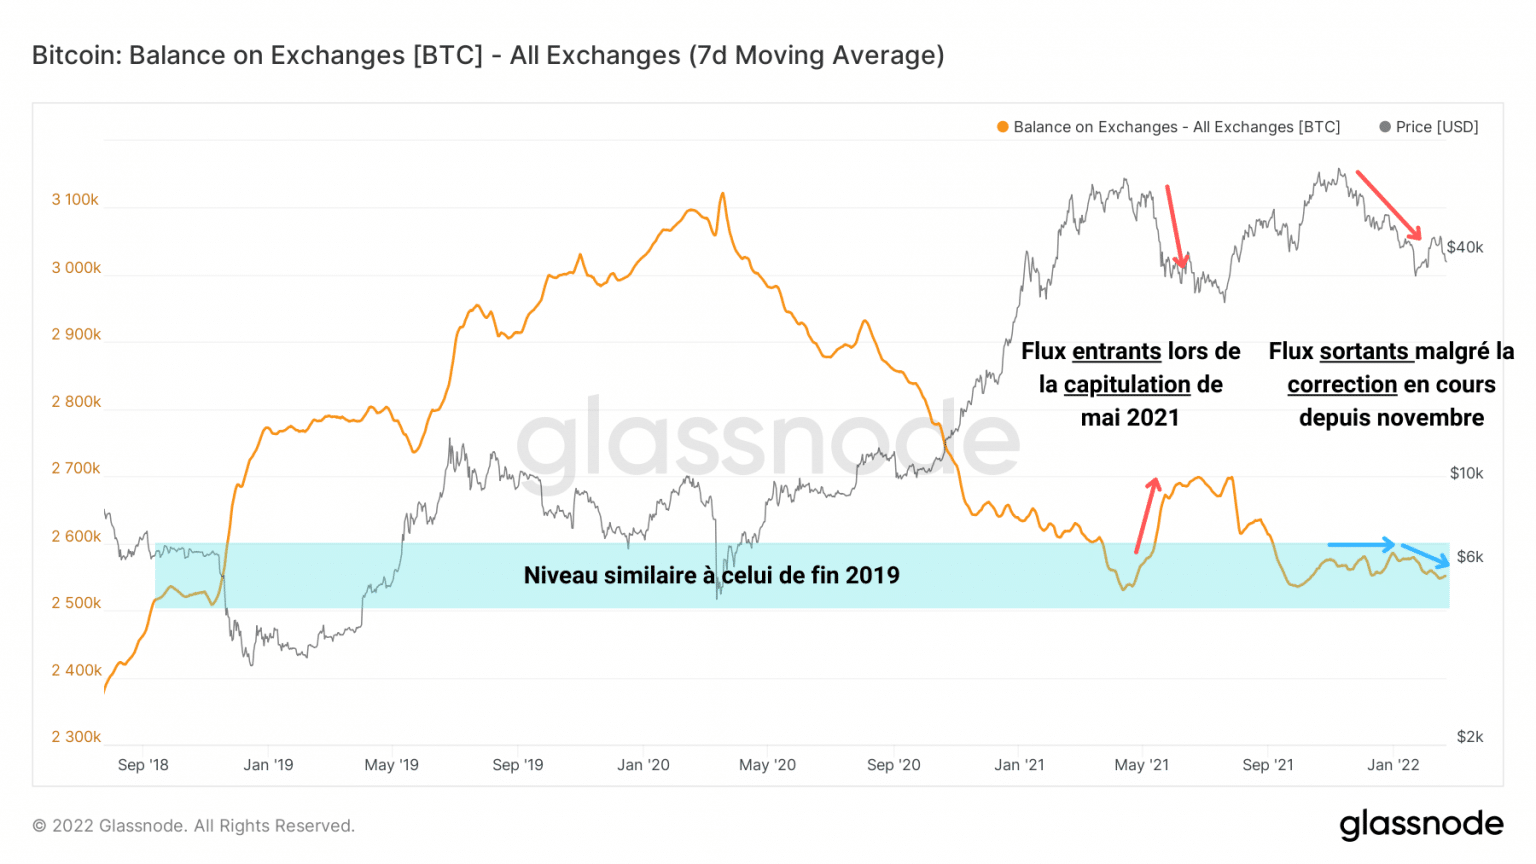
Chart of BTC reserves on trading platforms
In fact, we can even observe the opposite phenomenon: outflows slightly dominate inflows and indicate that the market has not entered a psychological state of panic despite the harshness of the last few months.
It even appears that some entities have taken advantage of the fall in BTC to accumulate more, a sign of strong conviction and a long-term investment strategy.
Fundamentals are growing
Now let’s add to this analysis with a look at some of the key aspects of bitcoin as an asset, but also as a network.
As ecoinometrics points out, the increasing correlation between North American indices and the BTC price does not bode well for the near term.
Indeed, margin calls in traditional markets force participants to sell various assets – including BTC – in order to bring liquidity to their position.
{5/8} Clearly the stock market is not ready for that. Which means there is more pain to come.
But what’s bad for the SP500 is also bad for BTC. Both of them trade in lockstep these days. pic.twitter.com/L75be4qs96
– ecoinometrics (@ecoinometrics) February 21, 2022
Thus, BTC can potentially find itself in trouble as long as the equity markets do not show signs of turning upwards. This is not extremely positive for Bitcoin, whose market value, an aspect too often mentioned to the detriment of its fundamental value, finds itself partly backed by the traditional financial system from which it is supposed to emancipate.
On a more neutral note, the 14-period market gradient has finally broken out of its short-term bullish divergence. Having regained positive momentum in the short term, the medium-term (MRG-28) and long-term (MRG-140) variants of this indicator remain neutral and negative respectively.
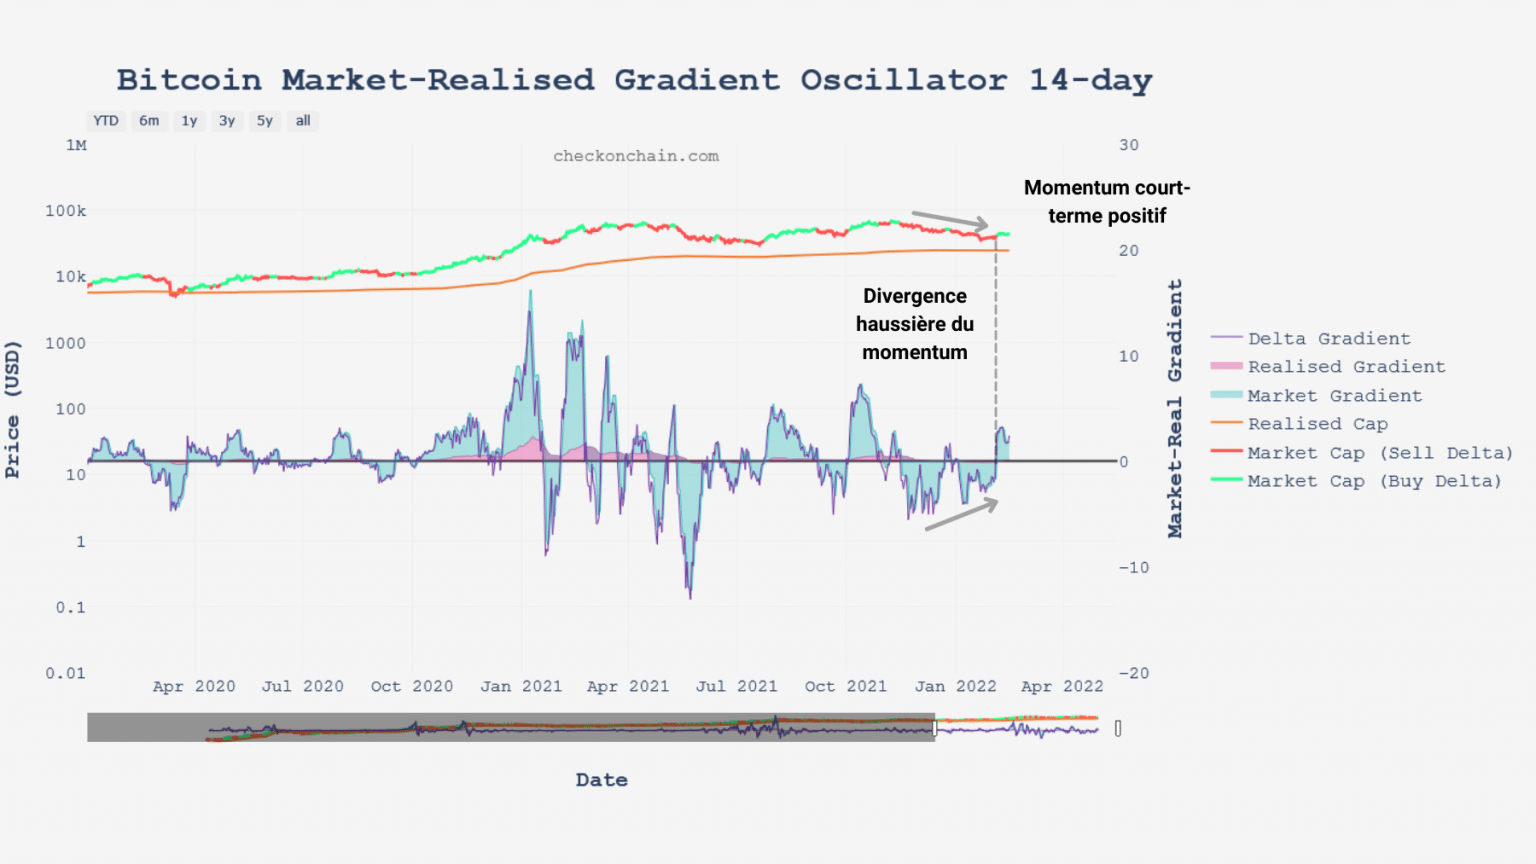
Graph of MRG-14
As a sign that the BTC price is experiencing a moment of truth, it is very likely that the next few weeks will be emotional and will prove to be decisive in terms of long-term momentum dynamics.
Regarding distribution dynamics, it appears once again that LTHs hold nearly 80% of the BTC in circulation.
This level, historically decisive, has served several times as a trigger for strong bullish movements, such as in October 2015 and October 2020.
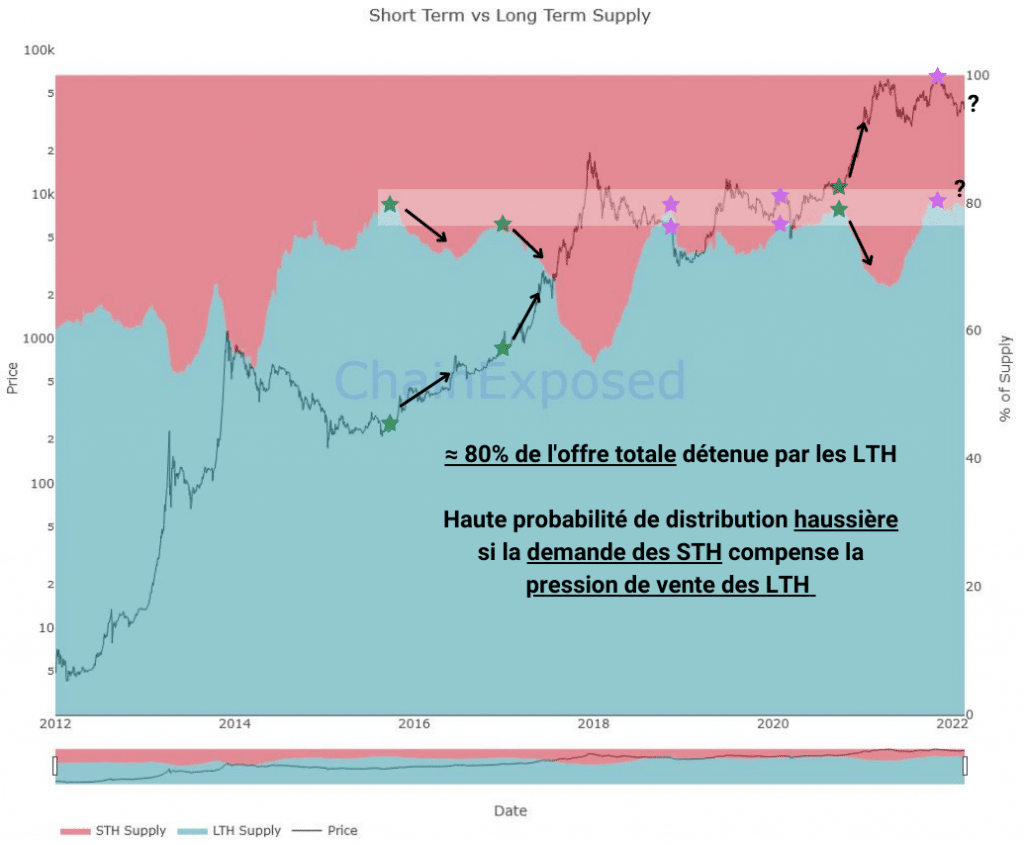
Graph of BTC supply distribution in circulation
Although the current market configuration does not suggest this, the likelihood of a bullish distribution from LTH to STH cannot be ruled out if the price of BTC were to turn around.
Another fact that shows us that the value of a digital asset is not only its market value: the hashrate of the Bitcoin network has just scored a new ATH of 214 ExaHash per second.
Proving once again its resilience, the network will have taken only 212 days to recover all the hash power relocated following the Great Migration of Chinese miners.
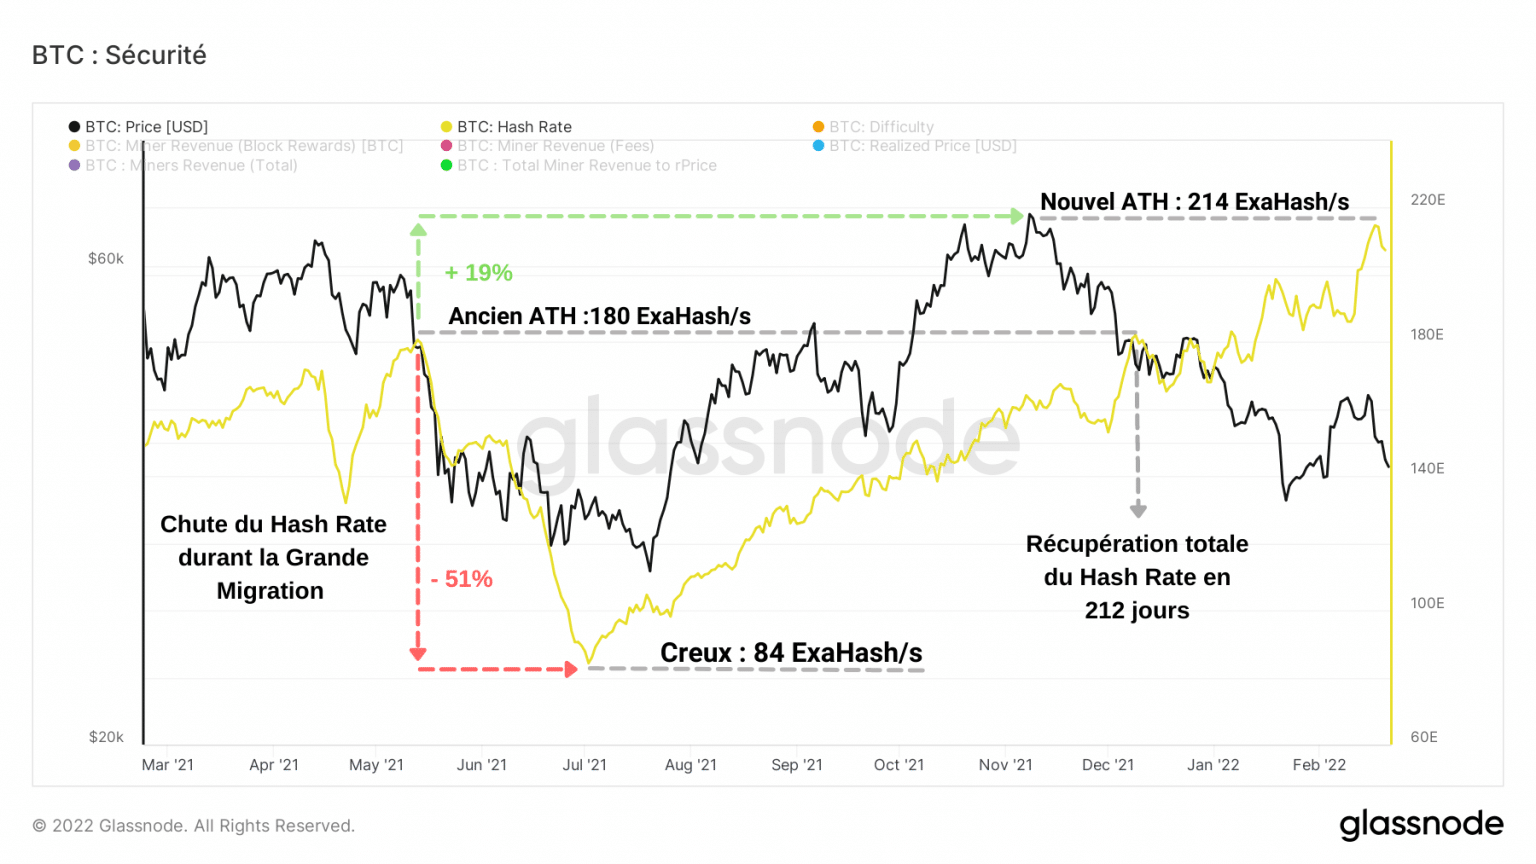
Bitcoin hashrate graph
An oft-cited example of its fundamental value, Bitcoin as a network has never required so much power to be attacked.
Finally, as a sign of slow but steady adoption, the number of active entities on the network now exceeds 275,000 daily users.
While this number is much lower than previous market peaks, Glassnode points to the fact that the floor of active entities continues to grow over time without faltering.
There are currently ~275k daily active entities on the Bitcoin network.
This level of activity is far below bull market highs, indicative of tepid demand from new users.
However, the activity floor continues to climb in bearish markets, reflecting longer-term network effects. pic.twitter.com/qm9wx7Jesk
– glassnode (@glassnode) February 17, 2022
Summary of this on-chain analysis of Bitcoin
Finally, the bitcoin market seems to be sailing in troubled waters. BTC’s correlation with North American indices, coupled with the global economic and political uncertainty, is causing market participants to shed risky positions as a sign of defensive behaviour.
As long as speculators anticipate erratic price action, long-term investors remain calm and show no signs of panic.
Limiting their spending and taking advantage of the recent correction to accumulate BTC on sale, they do not seem ready to leave the market in the current conditions.
Finally, despite BTC’s strong correlation to traditional financial indices, its fundamental values continue to develop and offer the seasoned investor a wealth of data mitigating against its market value alone.