
The Bitcoin (BTC) price continues its trend reversal and hits the next major resistance: the 200-period moving average. The influx of new entities joining the network, coupled with the observation of increasing on-chain activity indicates an encouraging resurgence of interest and commitment. On-chain analysis of the situation
The Bitcoin network is gaining strength
The Bitcoin (BTC) price continues its trend reversal and is bumping into the 200-period moving average. A true indicator of the market’s long-term directional bias, the MA200 is, along with the realized price of STH, the next major resistance that BTC must overcome in order to confirm a recovery.
Approaching a key pivot point, bitcoin seems to be attracting the attention of a large number of participants again, who are leaving signs of their increasing activity and commitment on the blockchain.
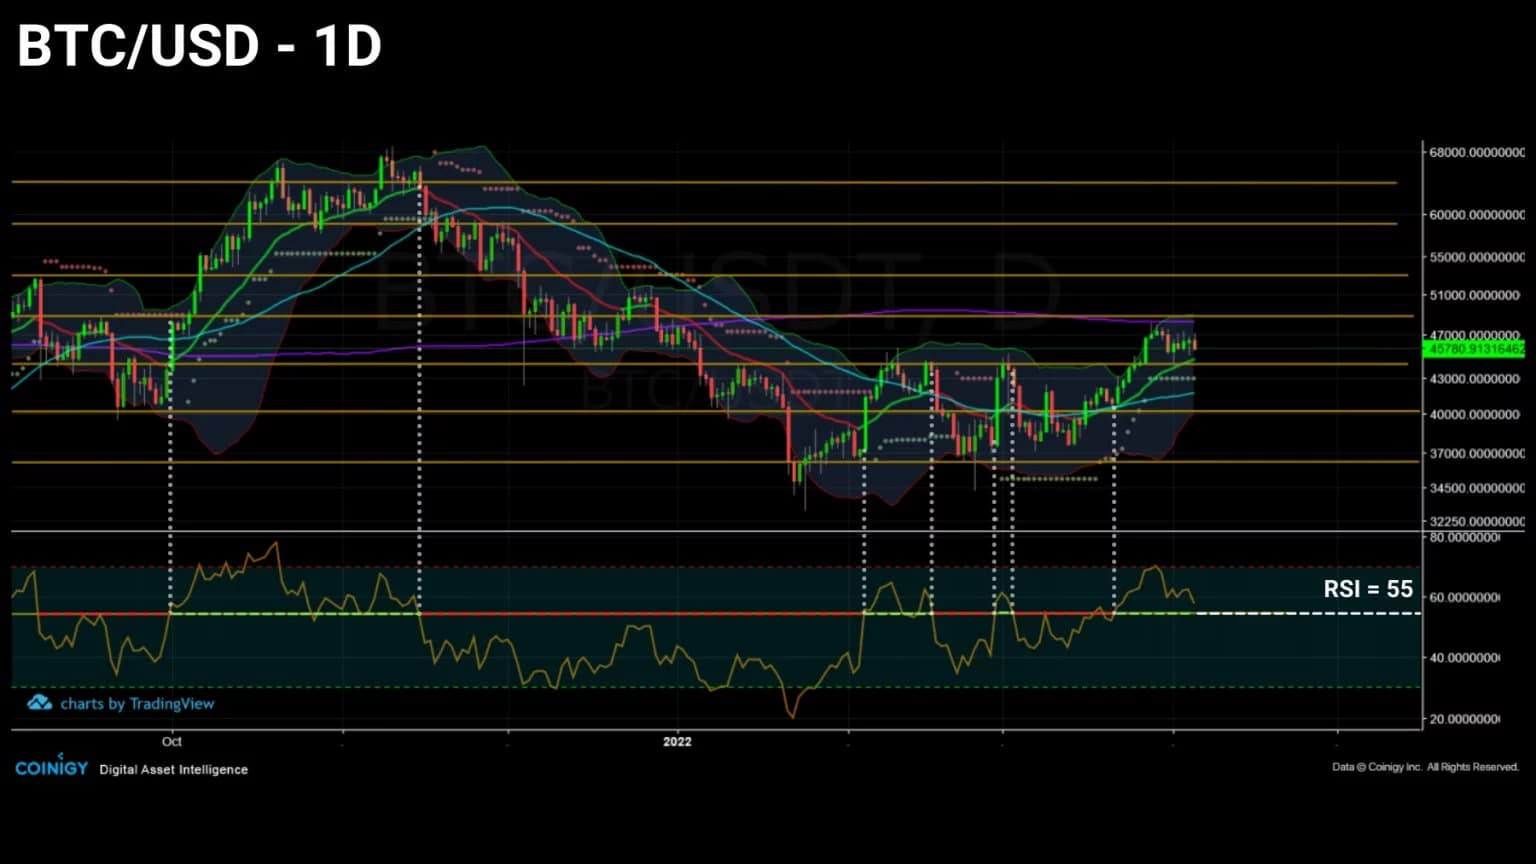
Figure 1: Daily bitcoin (BTC) price
This week, in order to gauge the market’s ability to enter a new bullish phase, we will be looking at:
- the growth of on-chain entities, to quantify the arrival of new entrants to the market;
- to the demand for block space, in order to determine the intensity of economic activity of participants;
- the short, medium and long term market momentum, to determine the directional bias of the BTC price.
Entities are flowing back into the network
Before we get into the nitty-gritty, let’s quickly mention the fact that the BTC price is currently very close to the Short-Term Investor’s Cost Basis (STH), at around $47,000.
As this indicator has historically served as short-term support (blue) or resistance (purple) for the price of bitcoin, it represents one of the most decisive price levels right now.
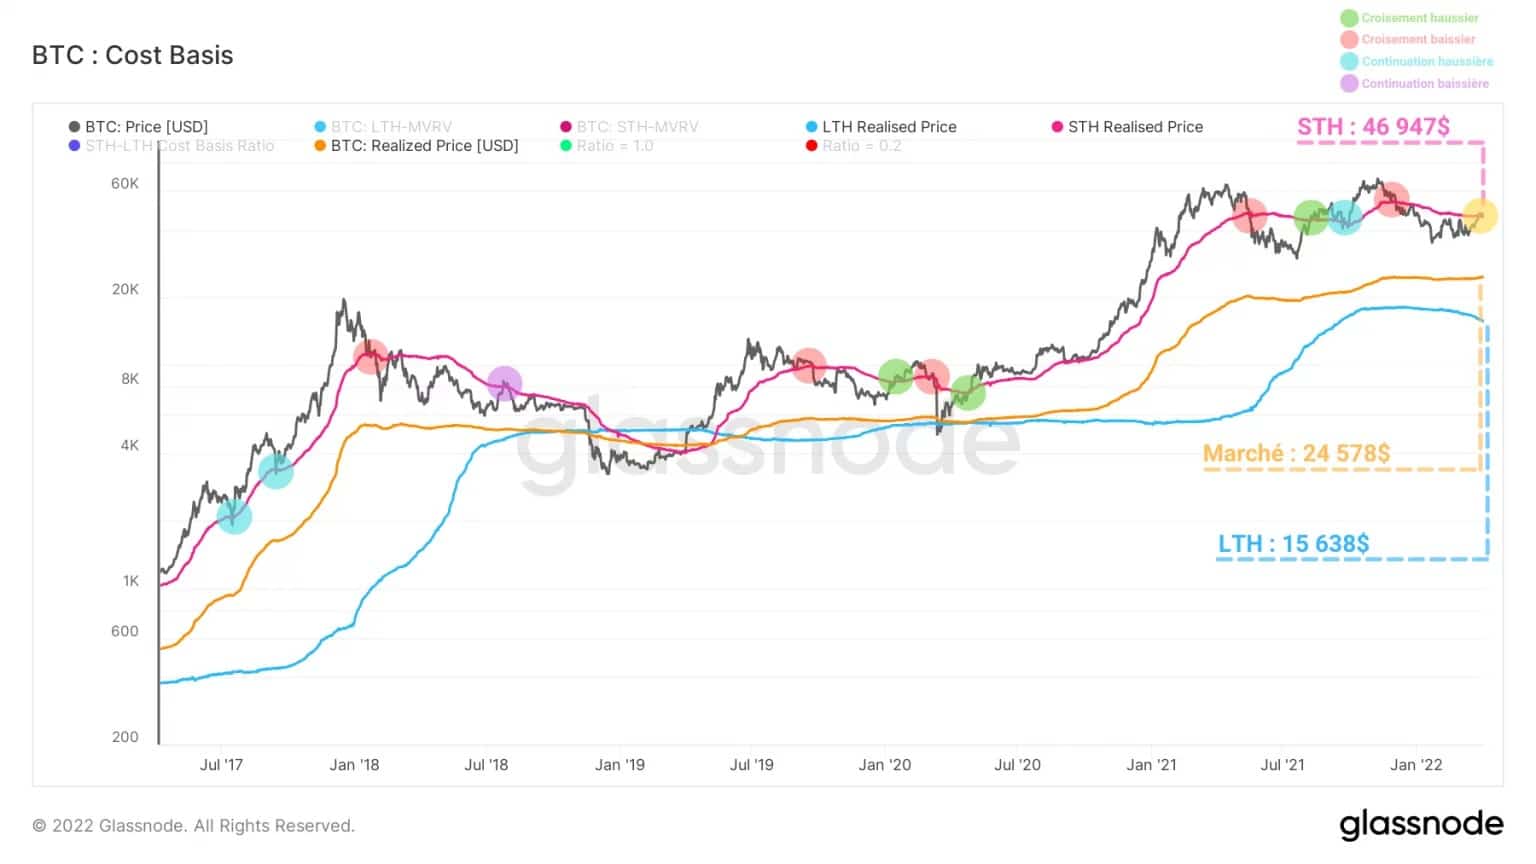
Figure 2: Basic market costs, STH and LTH
Once the cost base of STHs is crossed, the market acquires a profitability structure that is often conducive to the development of powerful upward trends.
Indeed, as soon as a majority of short-term investors find themselves in a profitable state, the overall selling pressure of the STH cohort decreases drastically, limiting upward price resistance.
However, this level is only being tested at the time of writing, so it is best to wait a few more weeks to confirm or deny that a new trend is indeed being triggered in the long term.
However, there is plenty of evidence that a reversal in market structure is underway. This is the case for metrics related to the growth and activity of on-chain entities.
One of the methods used to identify market transitions between bullish and bearish phases is to study the growth of entities on the network.
The graph below tracks the daily number of new entities entering the Bitcoin network for the first time.
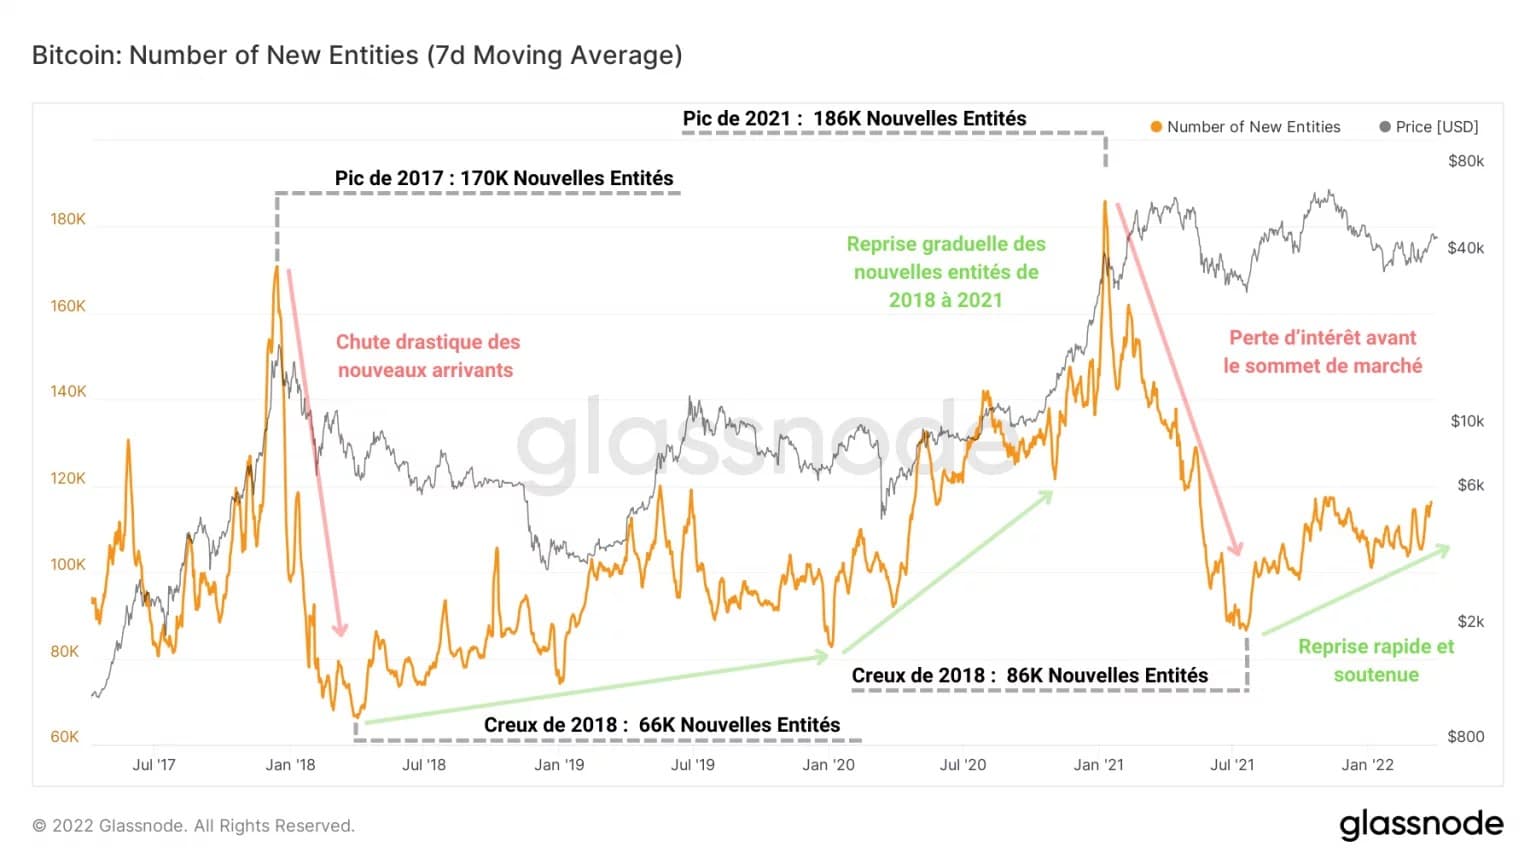
Figure 3: New Entities
While the end of bull markets are typically marked by episodes of drastic falls in the number of new entities (late 2017 and early 2021), the transition of the market into the bull phase is more gradual.
As observed during the last major bear market (2018 – 2020), the number of new entities joining the market grows gradually as the market recovers before entering a parabolic trajectory at the beginning of the final bullish impulse.
It is also worth noting that, unlike the 2017 market peak, the peak of new entities printed in January 2021 was formed before the market peak, signalling a significant loss of interest three months before the correction.
Moreover, since the third quarter of 2021, we can observe a sustained recovery in the inflow of new participants, indicating a revival of interest similar to that of the second quarter of 2018.
Indistinguishable from the metric proposed above, the net growth of on-chain entities is defined as the difference between new entities and “disappearing” entities (entities with a zero balance that had a non-zero balance at the previous timestamp) and provides a relevant signal of investor interest in bitcoin.
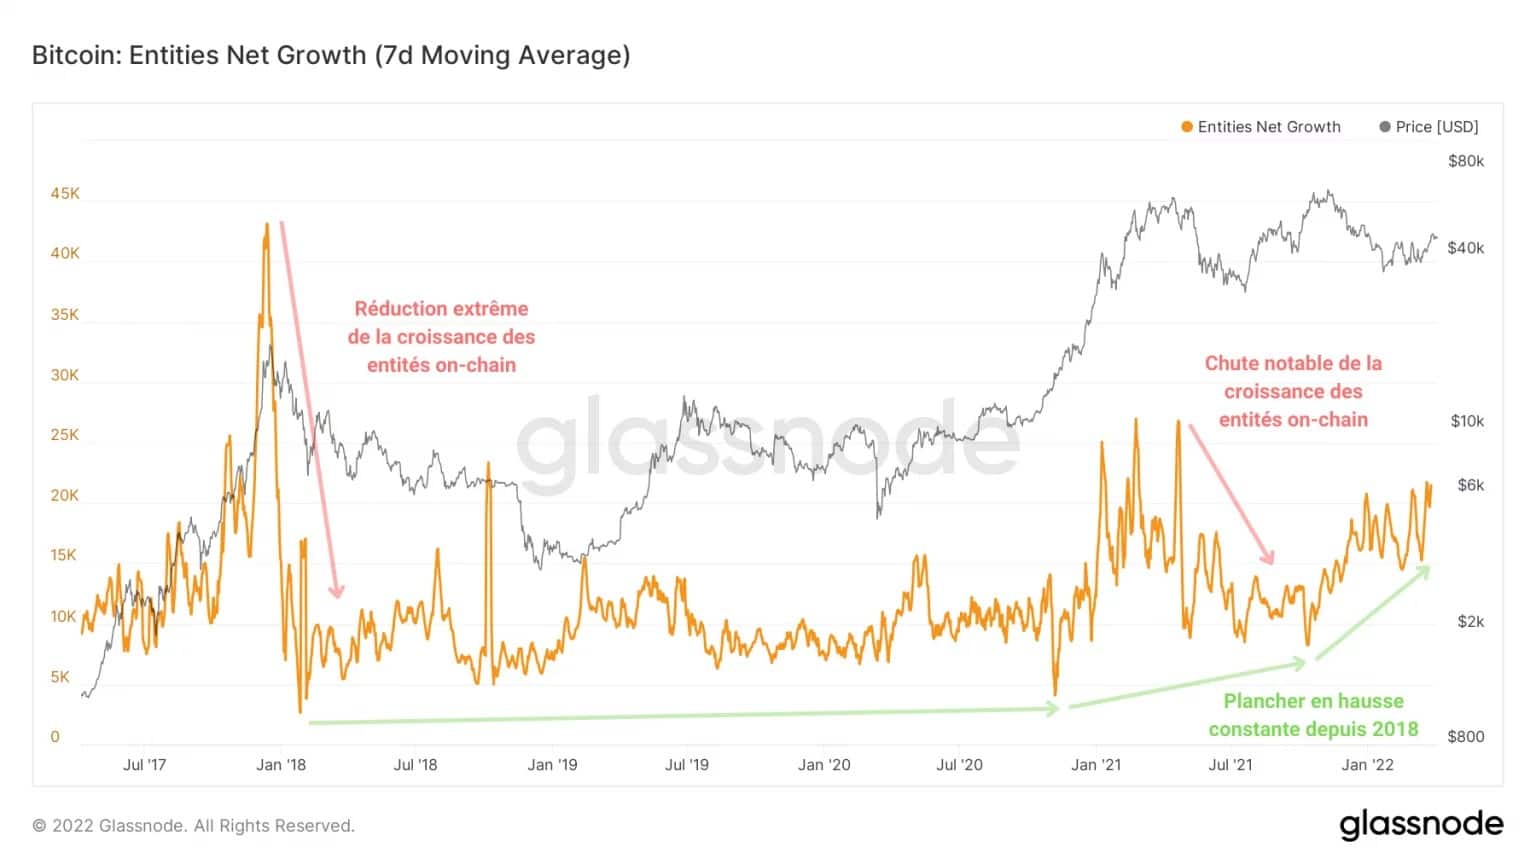
Figure 4: Net Entity Growth
It is apparent from the above chart that, despite several notable reductions in new entrants, the floor of this indicator has been rising steadily since 2018.
As a sign of the interest in BTC, net entity growth is currently at 21,800 new entities daily. Put another way: as many entities are joining the market today as at the time of the final rise in January 2021.
Such an influx of entities following two major corrections indicates strong investor conviction that BTC is an investment worthy asset despite the current macroeconomic and geopolitical tensions.
Moreover, the count of the number of unique entities being active as senders or receivers follows a similar dynamic as the number of new entities.
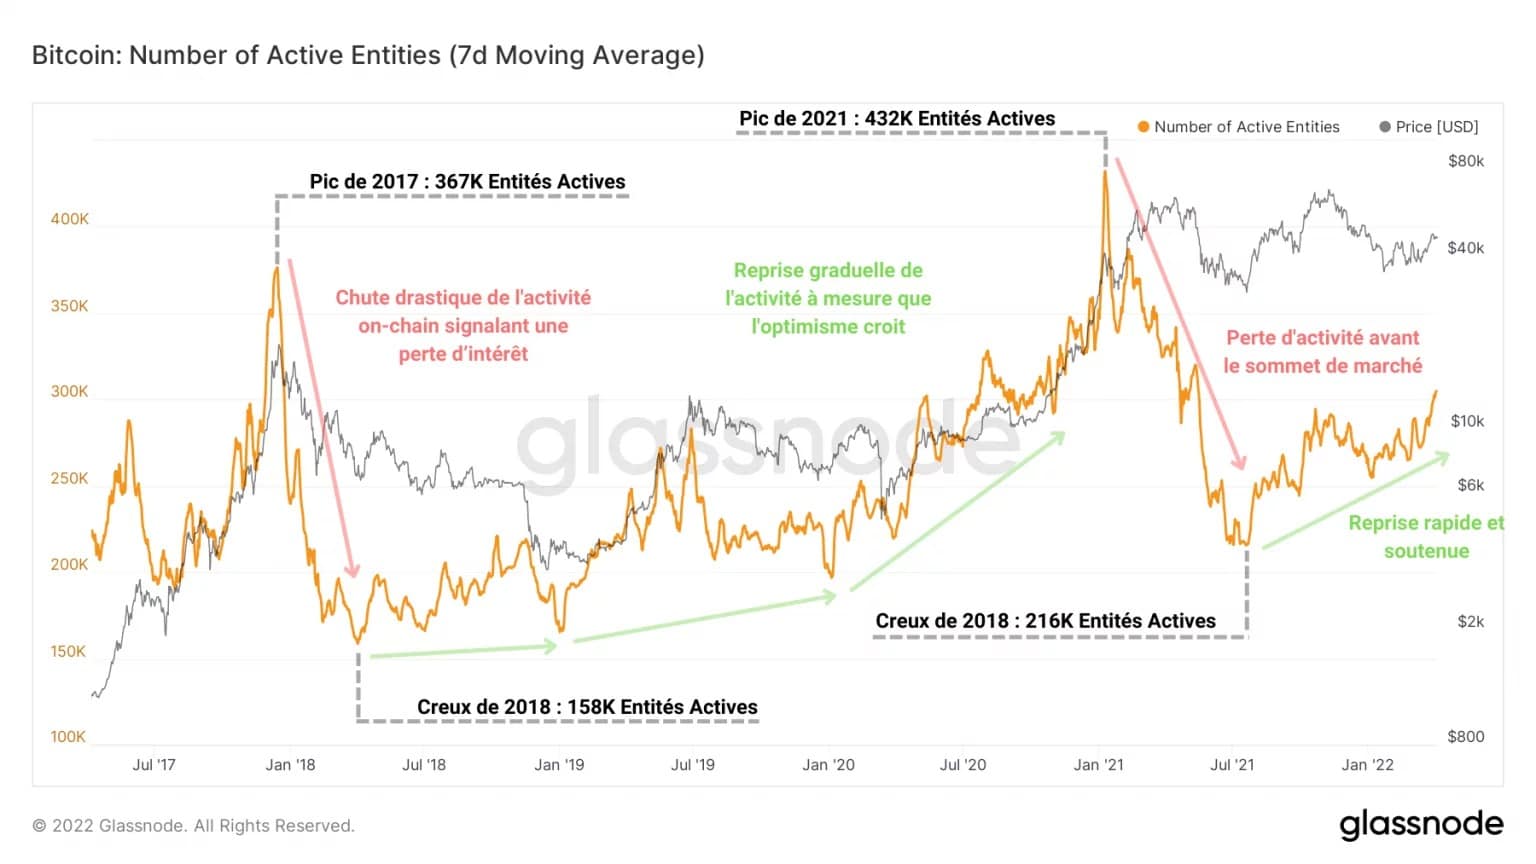
Figure 5: Active Entities
With nearly 312,000 active entities, the Bitcoin network appears to be entering a new phase of sustained economic activity, which is necessary to trigger a new bullish phase.
In fact, many entities are currently active and joining the market with the aim of gaining exposure to the upcoming upside potential for bitcoin (BTC).