
Following last week’s failed bullish recovery, the price of BTC is returning to visit the lower bound of the $18k-$24k demand zone. As investors continue to distribute, indicating their wariness of the bitcoin price in the short term, we explore key levels to watch for a bearish continuation. Onchain analysis of the situation
BTC returns to test bear market floor
Following last week’s failed bullish recovery, BTC is returning to visit the lower bound of the $18k-$24k demand zone.
After taking advantage of the August rally to exit the market, participants are triggering a new wave of distribution as the price approaches the bear market floor established on June 18, 2022.
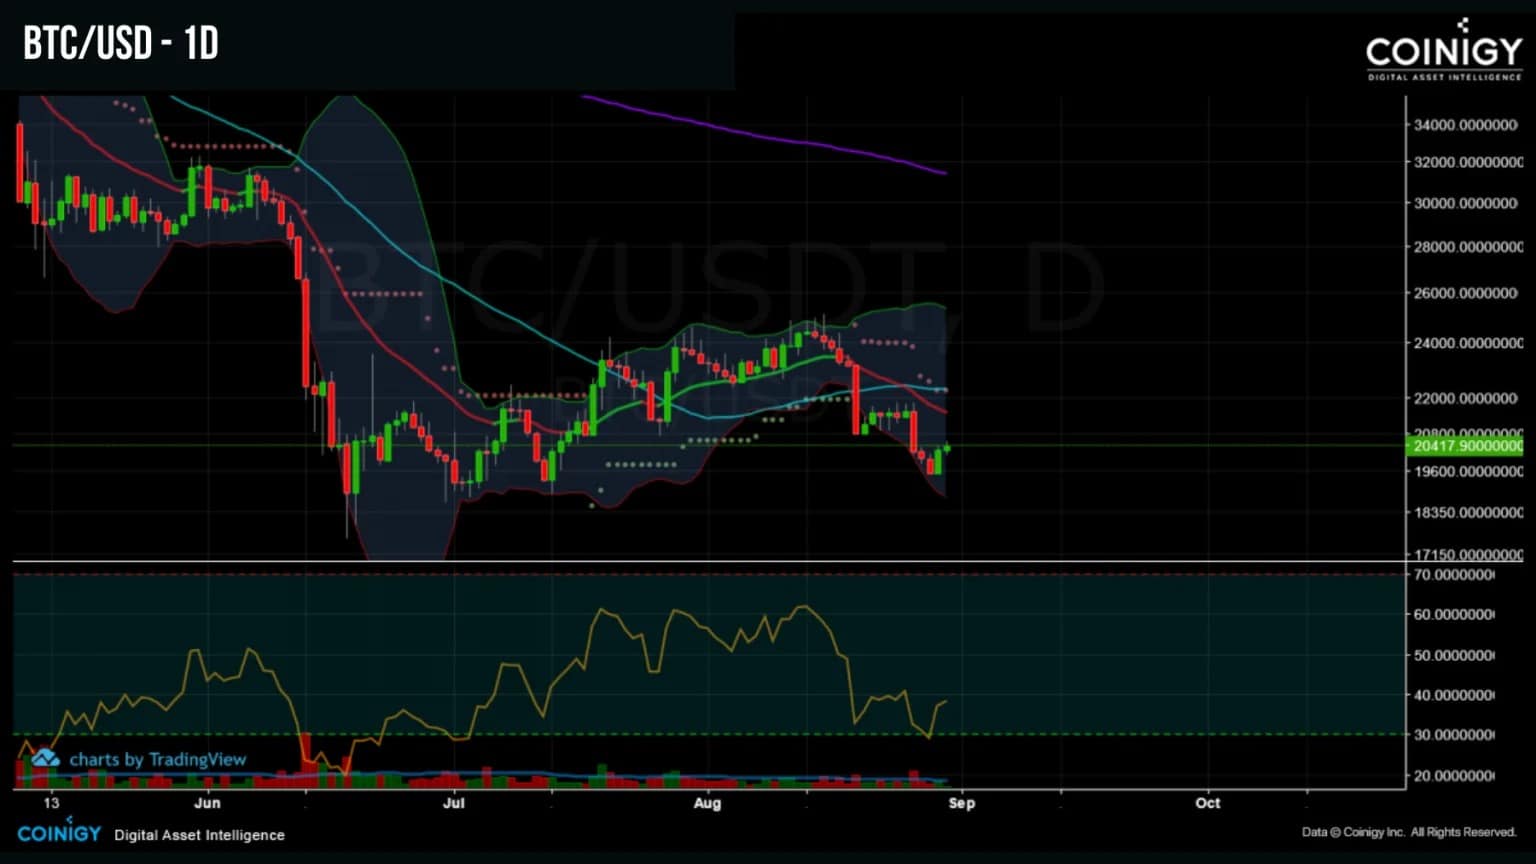
Figure 1: Daily BTC price
This week, considering the possibility of the price invalidating the $18k level, we will see:
- the distribution behaviour of participants;
- the key levels to watch for in case of a bearish continuation.
Confidence and dead cat bounce
While we identified an underlying weakness in the bullish rally back in mid-July, we now have plenty of data to confirm this observation and better understand the recent decline in BTC.
The Accumulation Trend Score, presented below, is a meaningful tool to identify the accumulation/distribution patterns of market participants.
Calculating the daily variation of the balances of different portfolio cohorts, it shows a value close to 0 when participants distribute and a score tending towards 1 when participants favour accumulation.
What is worth highlighting here is the fact that this indicator has been printing values below 0.05 since mid-August, signalling a high distribution and a lack of investor confidence, as described in our previous analyses.
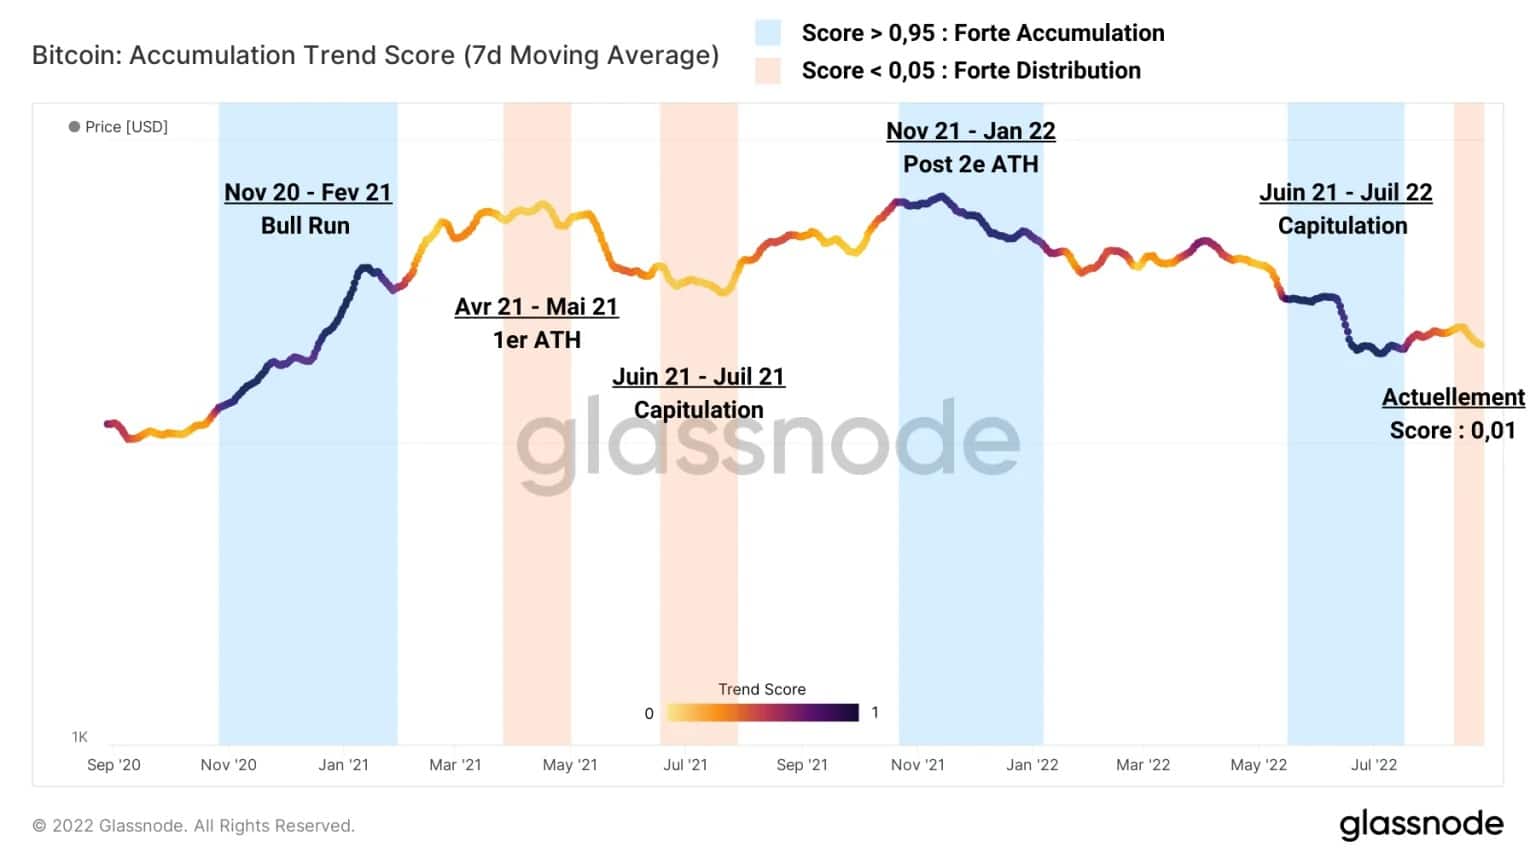
Figure 2: Accumulation Trend Score
Furthermore, we can see through the use of the Short-Term Holder (STH) profitability ratio that participants did take advantage of the July-August rally to exit the market by closing positions close to their cost basis, making modest profits/losses.
The profit-taking episodes of short-term holders are highlighted in red on the following chart. They provide a parallel between the bullish rallies of March-April and July-August, both of which resulted in bearish price reversals.
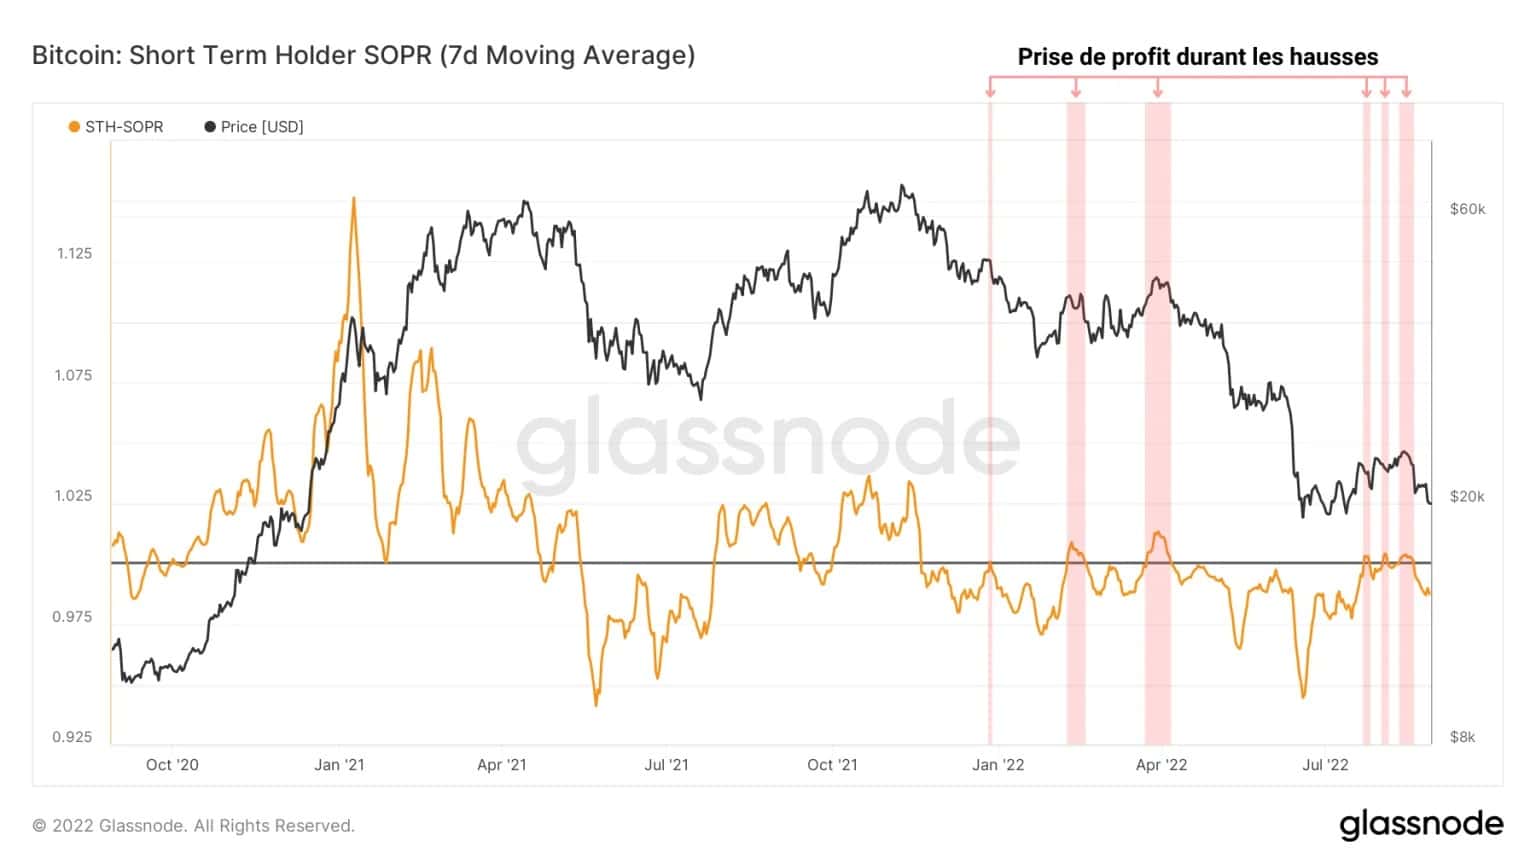
Figure 3: Profitability Ratio of HTS Expenditure
This behaviour is often associated with dead cat bounce events, where participants use brief price relief to exit the market by limiting their losses, causing the bullish move to be quickly exhausted by selling pressure and lack of sufficient buying pressure.
A similar dynamic can be observed among the long-term investor (LTH) cohort, although the profitability of their spending tends to fall as the bear market unfolds.
Indeed, we can detect a spending pattern over the same periods, with the cohort taking advantage of the rises to:
- to make large profits in March-April;
- make limited losses in July – August.
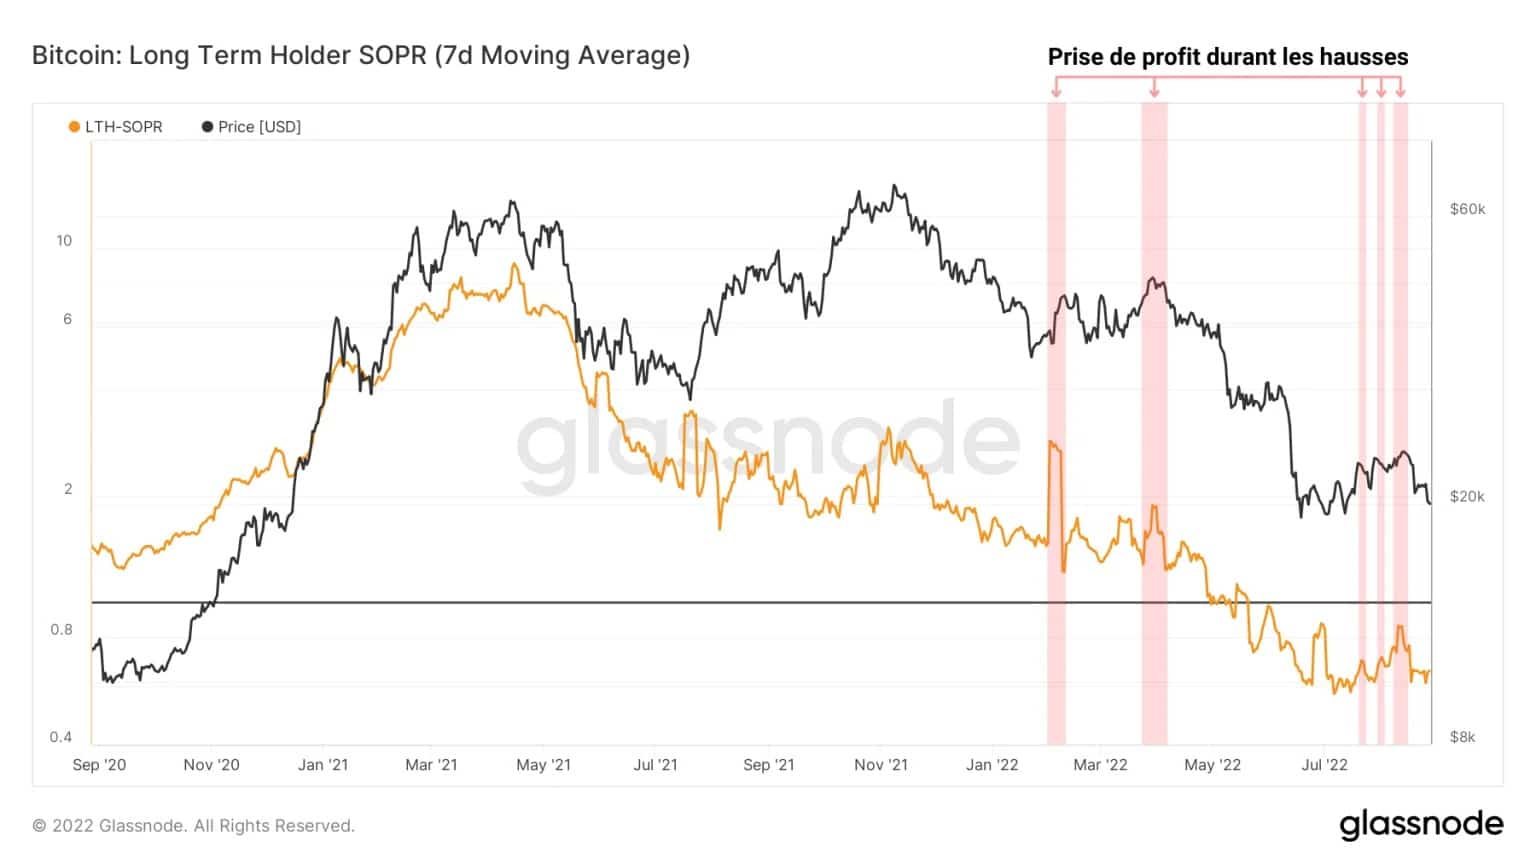
Figure 4: Profitability ratio of LTH expenditure
This pattern of exiting the market, recognisable in both cohorts, confirms the lack of confidence and patience of some participants in the short-term market action and contrasts with the HODLing behaviour identified since the beginning of August.
Price levels to watch
Now that we have identified the spending behaviour of participants and the potential selling pressure that comes with it, let’s try to determine the price areas to which the price might react in the event of a continuation of the downtrend.
By looking at the URPD, we can see that the price is currently near the bottom of the reaccumulation zone identified a fortnight ago. As long as the price hovers within this zone, between $18k and $24k, the likelihood of a bear market bottom forming increases.
Worryingly, however, once the $17k – $18k mark is breached, the volume clusters that could act as downside resistance are almost non-existent. Bitcoin is now on the brink of a precipice that needs to be viewed calmly and pragmatically.
Furthermore, the $21k to $24k price range has a significant chance of acting as short-term resistance to the price rebound, with participants able to take advantage of a new bullish spurt to jump ship and recover their capital.
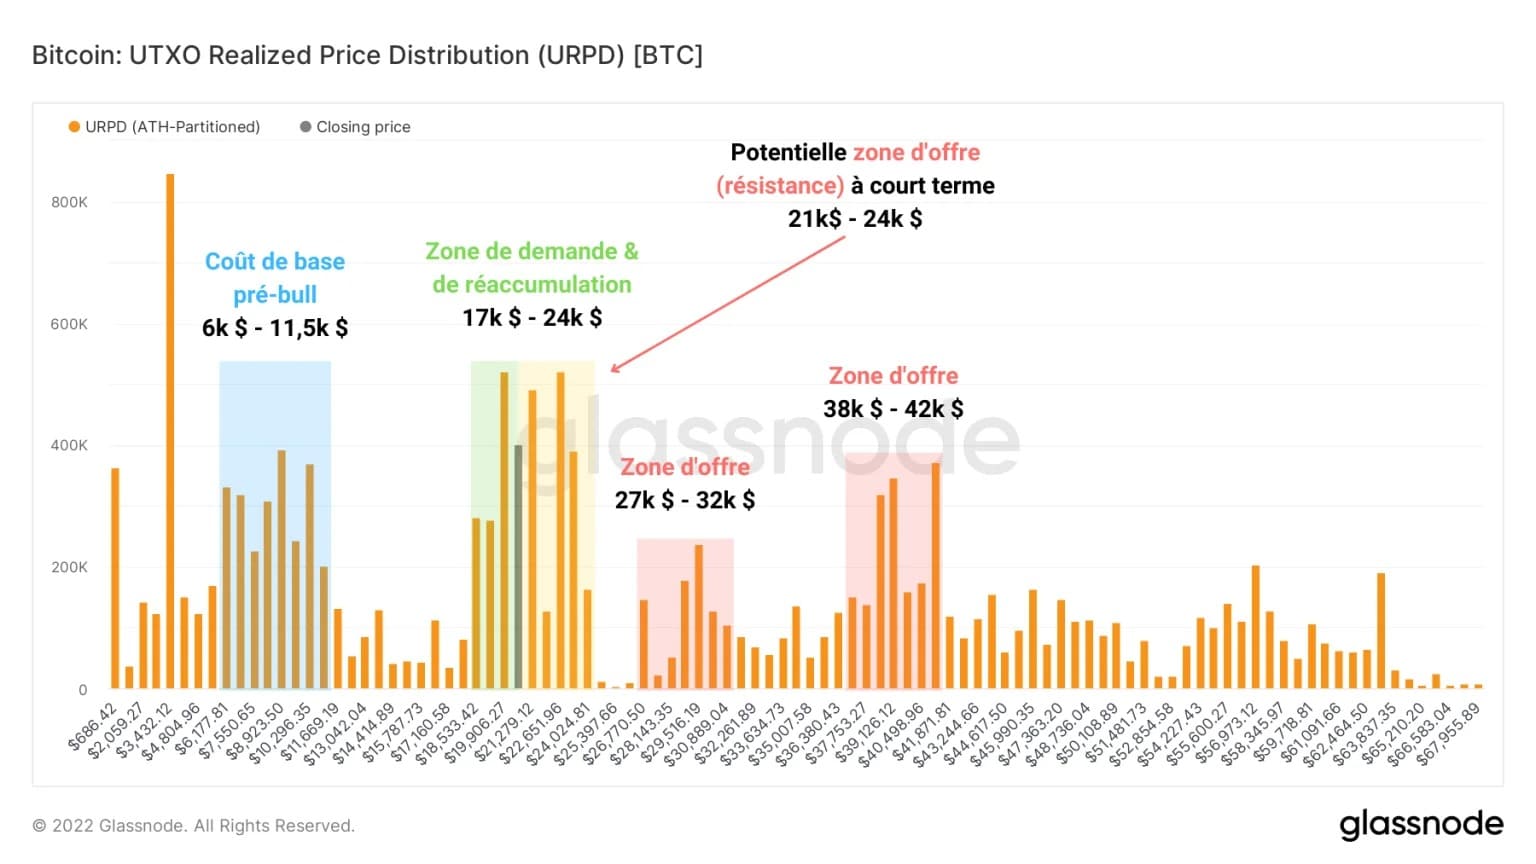
Figure 5: UTXO Realised Price Distribution
Thus, in the event of a bearish continuation, various on-chain support patterns allow us to anticipate the price levels to watch.
The following chart highlights:
- the realised price ($21.6k), which has already been invalidated and indicates that the market is in a state of global undervaluation;
- the balanced price ($17k ), first tested on June 18, 2022 and having temporary support at the price lows of previous down cycles;
- Delta price ($13.6k), serving as a last line of defence against the volatile wicks of down cycles and providing a painful, yet realistic price target.
In order to reach this final level, the BTC price will have to fall another 30% or so, causing investors to completely exhaust their pent-up selling pressure and signaling a historic buying opportunity.
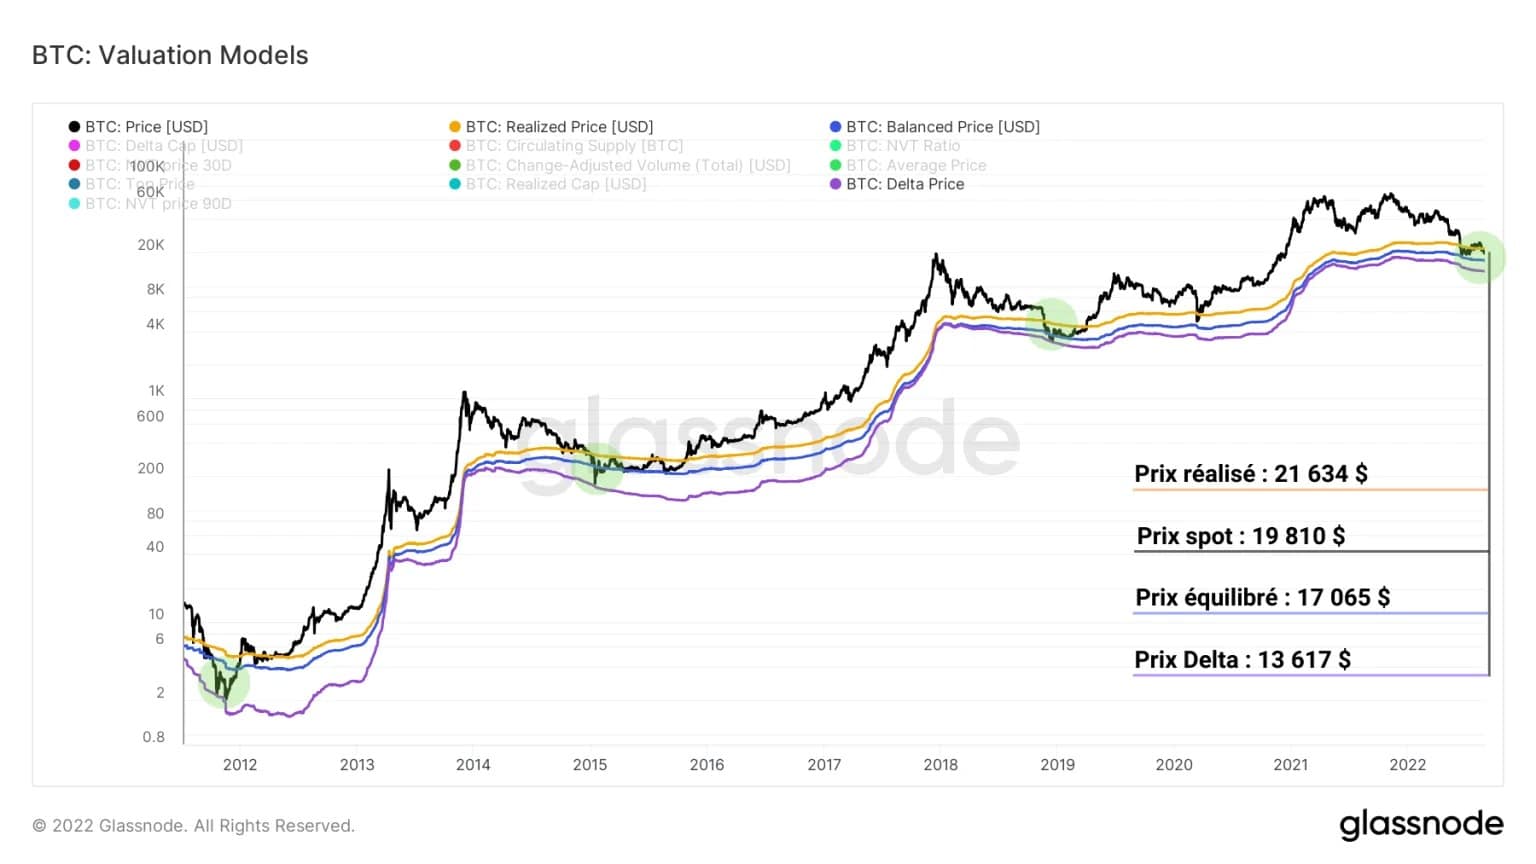
Figure 6: On-Chain Support Models
While this price level may be surprising to some, the on-chain analysis tool WhaleMap provides a price model based on address cohorts, offering an alternative and relevant prism to the data provided by Glassnode.
Looking at the realised price of addresses holding 10 to 100 BTC, we can see that in all previous down cycles, the BTC price has picked up this area and used it to establish a robust price floor.
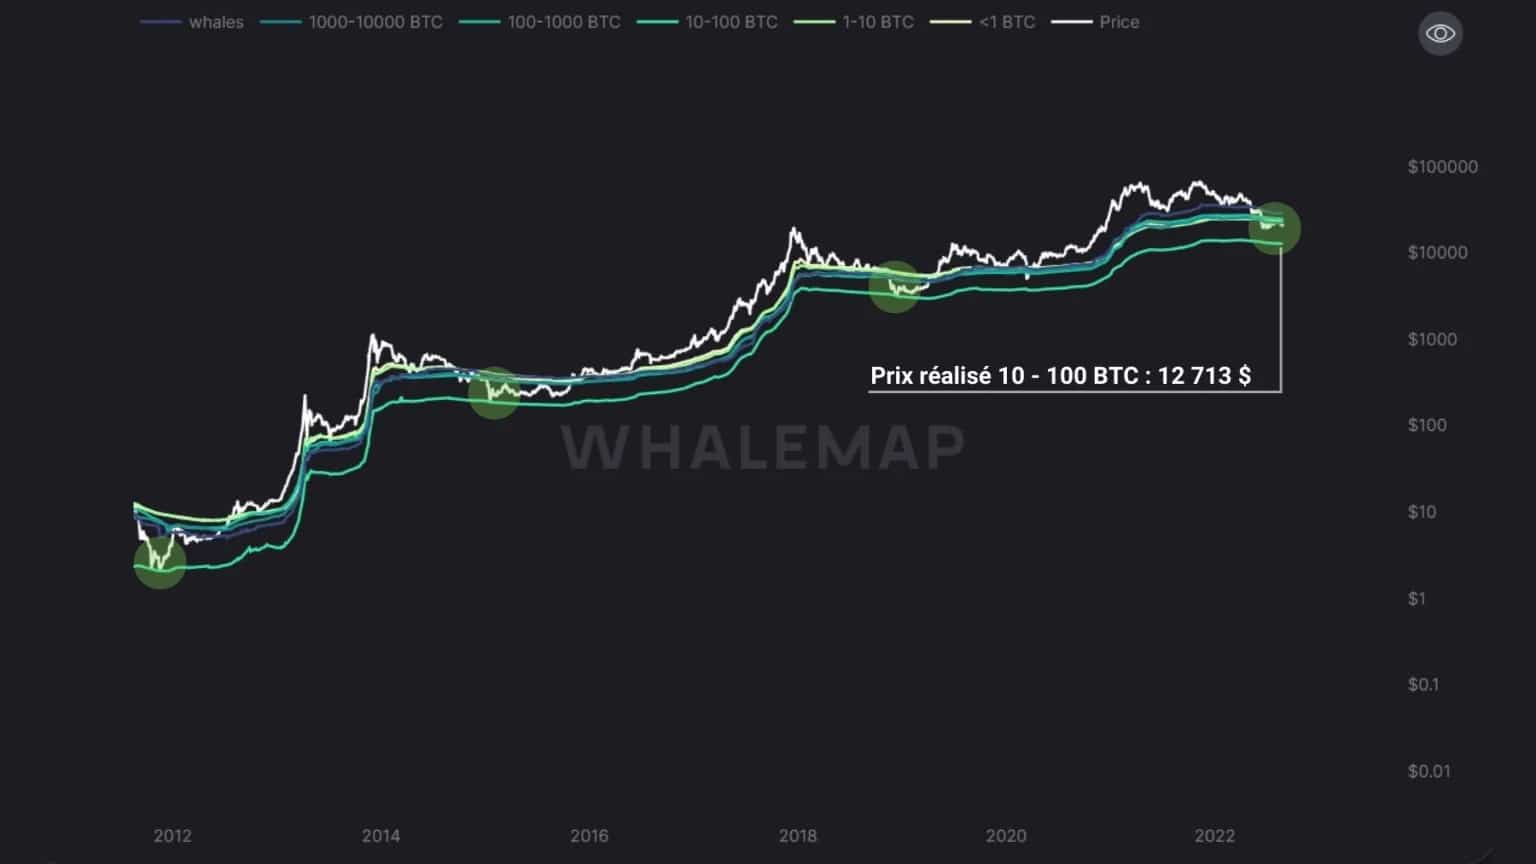
Figure 7: Realized Prices of Address Cohorts
Currently hovering around $12.7k, this indicator signals that a potential bearish move could take us towards the $13k price area where the bear market could find and work its final floor, before giving birth to the bull market to come.
Summary of this onchain analysis
In the end, although this week’s data paints a rather pessimistic picture in the near term, the bear market floor at $17.8k remains intact to this day, despite the fact that the macroeconomic environment and participant behavior is proving deleterious.
Since mid-August, investors have initiated a sharp distribution, showing their distrust of the short-term price fate, accompanied by selling behaviour that led to the dead cat bounce scenarios of May – April and July – August 2022.
Finally, a cross study of historical support patterns using Glassnode and WhaleMap data allows us to identify a potential bear market bottom target around $13k, suggesting a possible price decline of around -30%.