
Despite a fundamental framework that remains very constrained for risky assets in the stock market (equity market & crypto market), resilient inflation and a non-negligible probability of a recession 12 months out, the bitcoin price is holding sideways below the major technical resistance of $25300. Let’s take a look at the fundamentals and charting.
Bitcoin’s strong link to the cost of money and the US dollar trend
Inflation is still public enemy number one for financial markets for 18 months now. Its initial vertical surge and then its current decline, which is still considered too slow by the Central Banks, is keeping financing costs at a very high level and on an upward trend.
It is actually quite surprising (a good surprise) that the crypto market has managed to show resilience in the face of the latest US inflation rate update. The latter is certainly down from 6.5% (annualized and for the CPI price index) to 6.4% but the downward momentum is slowing. Incidentally, the Friday 24 February session (the anniversary of the outbreak of war in Ukraine) will see the update of the PCE price index, the one most watched by the US Federal Reserve (FED).
In order for the bullish recovery in the Bitcoin (BTC) price to continue, it is necessary to see the development of the decline in inflation rates over time.
But back to the point. In my article last week, I highlighted the very strong link between the evolution of the price of cryptos and the evolution of overall net liquidity within the Western financial system. The latter is linked to the monetary policies practiced by the FED and the ECB.
Above this global net liquidity factor, in the architecture of the BTC underlying trend, are two keystones. If you remove these two key pieces, then everything falls apart, they are:
- The trend of the US dollar in the forex market;
- The absolute value and dynamics of financing costs, in other words the interest rate cycle in the market.
By studying the bitcoin price trend over the past 14 years, it is now clear that the major bull market phases for BTC are linked to periods when the US dollar is not in a strong uptrend against Forex and interest rates tend to stay low.
The first chart below reveals the strong link between these two metrics and BTC since the beginning of the health crisis in 2020. As you can see, the inverse correlation relationship is quite obvious.
In conclusion, in order for the bitcoin price to break above the extreme technical resistance of $25300, it is imperative that market interest rates do not make new annual records in the short term.
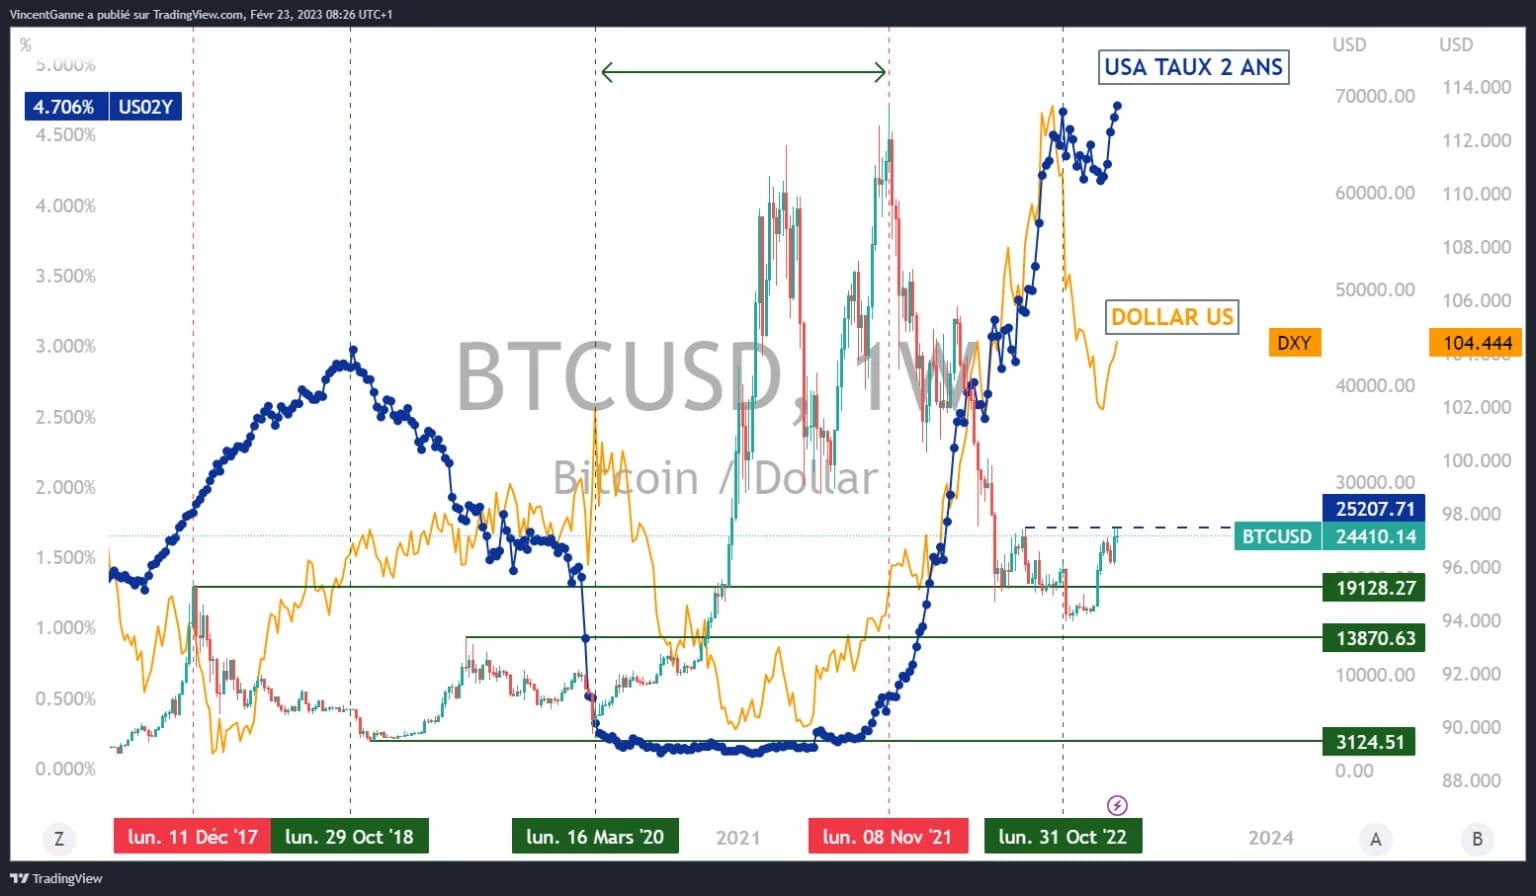
Chart that juxtaposes 3 pieces of information: the price of bitcoin in weekly Japanese candles, the US dollar on Forex and the cost of money represented by the US 2-year bond interest rate.
Bitcoin, short term technical point
Now back to the technical analysis of the bitcoin price which is holding below major resistance at $25300 as I write this. This chartist level represents a very strong polarity change threshold, the lows of last spring and the peak of the summer 2022 rebound. The market would need to record a significant daily close with trading volume for this lock to break, which is no small feat.
To summarize, here are the important chart levels of the moment:
- The $20000/$2,200 support area below which the rebound would be invalidated;
- Short-term support at $2300;
- A major resistance at $25300.
For fun, if resistance is breached, then the next significant level would be at $28800.
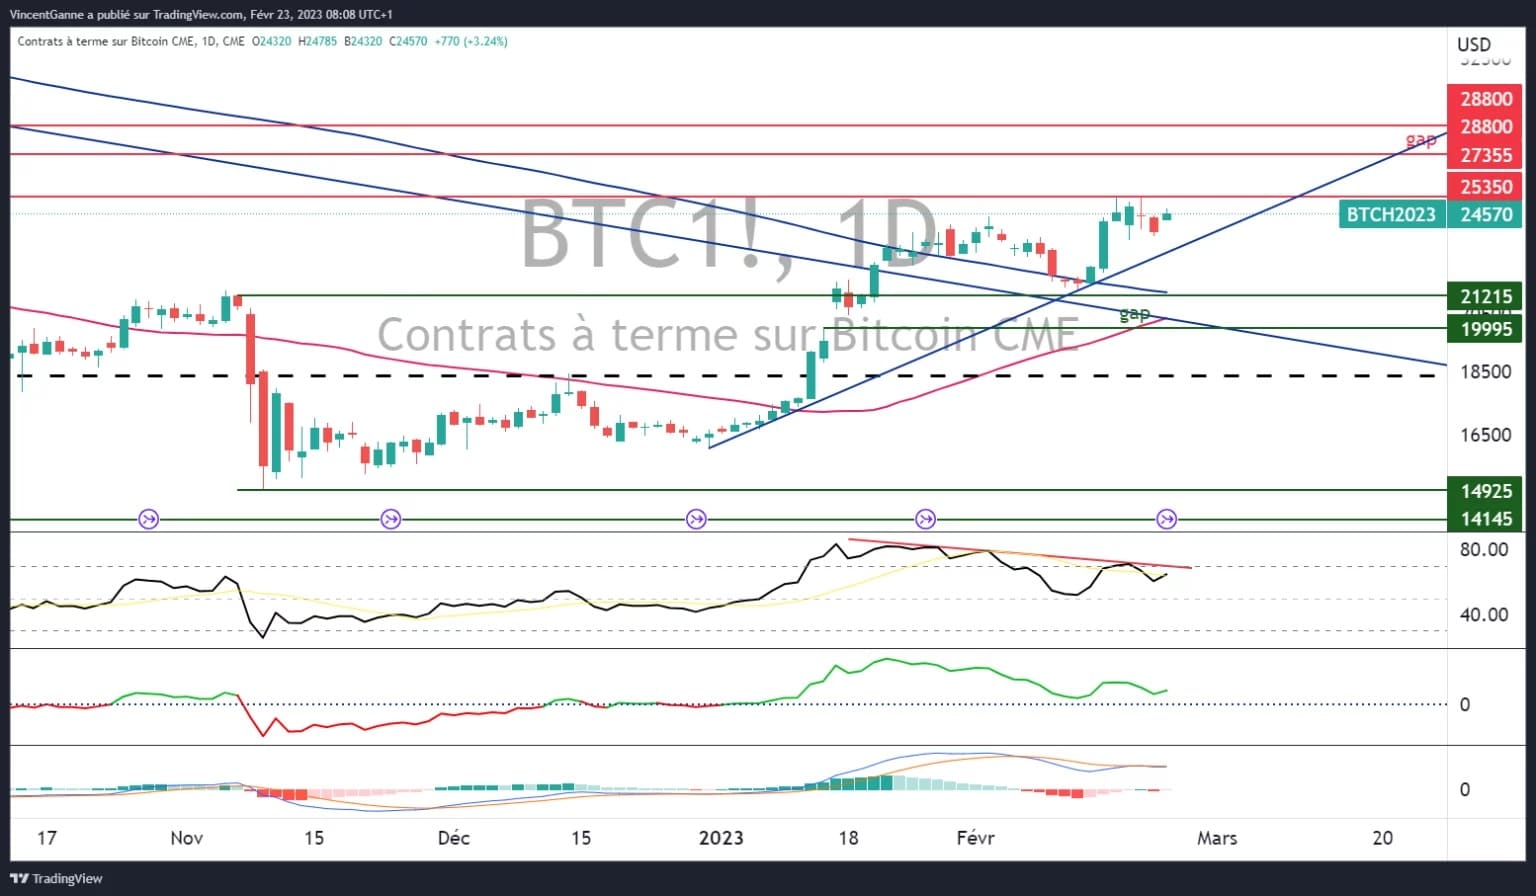
Chart that exposes the daily Japanese candles of the Bitcoin futures contract on the Chicago Stock Exchange