
The crypto market’s rebound surprised the vast majority of technical analysts at the start of 2023, most of whom saw bitcoin sinking fast towards $10,000. Bucking the majority prognosis, BTC has bounced back several thousand dollars. On the other hand, some market metrics are still raising fears of a bull trap.
One major fear: the trading volume of the rebound remains disappointing
Crypto market price action is very favorable at the start of the year, with Bitcoin (BTC) and Ethereum (ETH) up more than 35%, a performance that compares to four consecutive quarters of declines last year.
This bullish recovery is primarily based on inter-market correlation factors with:
- The continuation of the US dollar’s downward trend against a basket of major currencies (more than 12% drop in the USD since its record high last September);
- The uptrend in major stock market indices, particularly European indices which are outperforming Wall Street;
- Nominal interest rates no longer rising in the credit market in the major Western countries.
The rebound is then based on a fundamental investor expectation of a soft landing in 2023, coupled with gradual disinflation, a forward-looking economic framework that would rule out an economic recession scenario.
This is probably where the market is taking a risk, because if the macroeconomic consensus were to be caught on the wrong side of the ledger, then the price of risky assets on the stock market, including cryptos, would come under very strong downward pressure. But let’s assume that the economists are right, then the rise in the price of BTC can be justified from that perspective.
Caution is still warranted, however, as evidenced by the divergent relationship between price action and participation/volume data. In order to validate a structural technical bullish reversal, it is imperative that volume shows a clear upward trend, as was the case for example in the first part of 2019. At this stage, although the month is not yet over, trading volume is still a bit low to validate the price rise.
Added to this is the lack of bullish reversal in the deposit/withdrawal balance within the centralised crypto platforms, as shown in the second chart below:
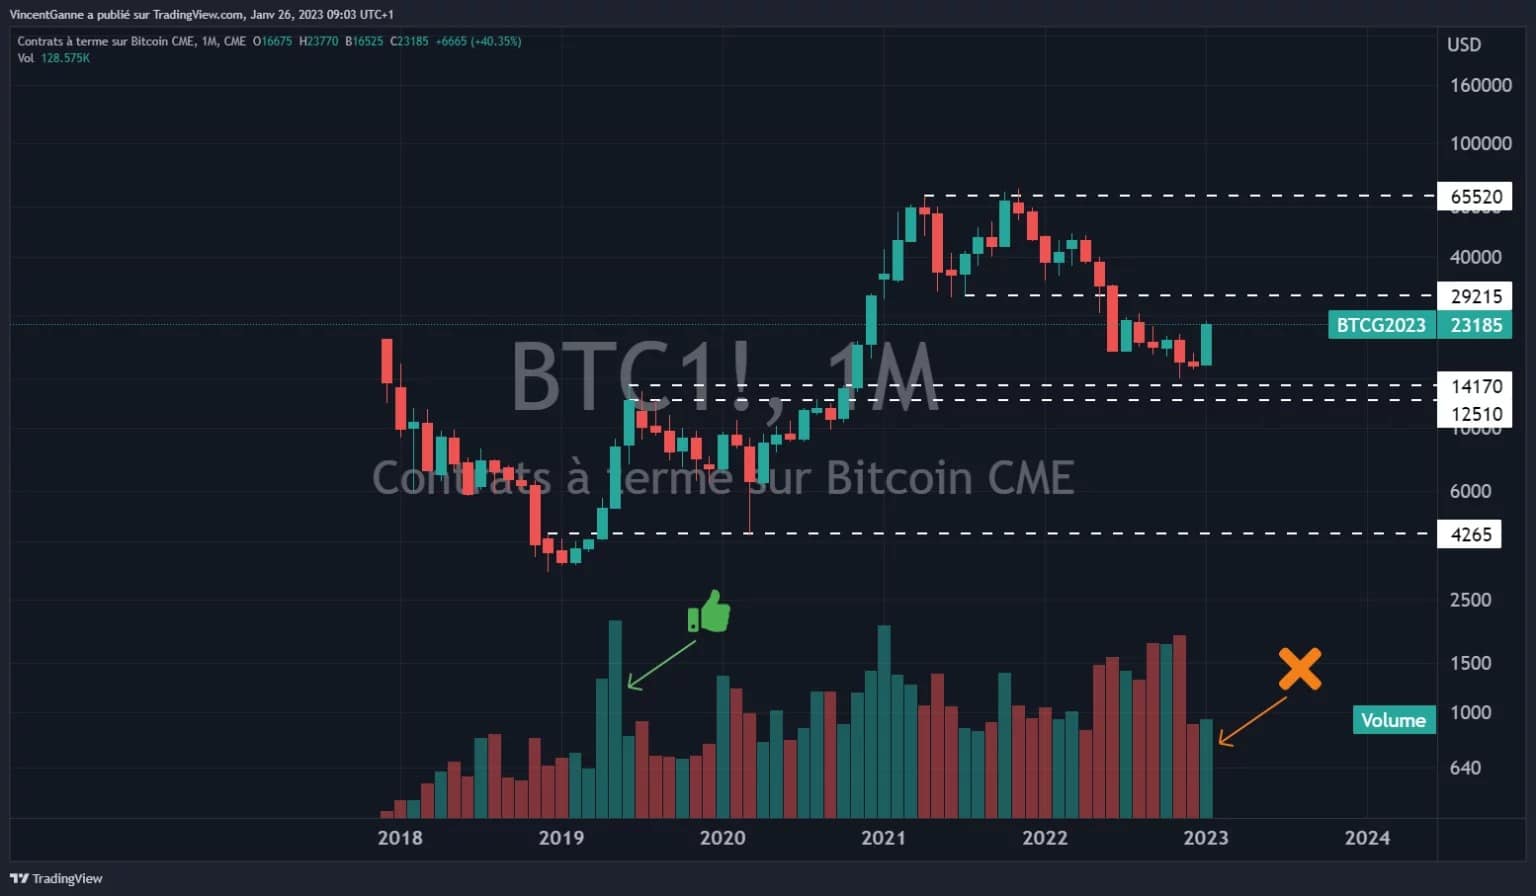
Chart revealing the monthly Japanese candlestick price of the Chicago Stock Exchange (CME) bitcoin future contract
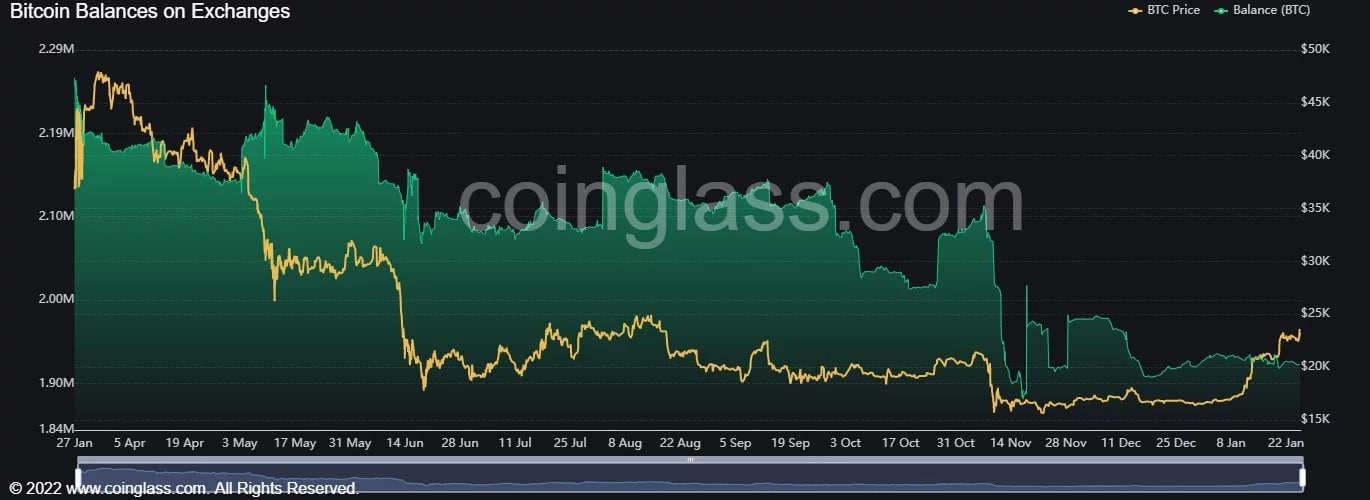
Chart that exposes the evolution of the deposit/withdrawal balance of centralized crypto platforms
A contrarian opportunity: the rebound is far from consensus
On the other hand, I note a technical market data that favours the continuation of the rebound towards the $25,000 chart resistance, and that is the evolution of US retail investor sentiment towards risky assets in the stock market.
It is a given (all the studies since 1990) that individual traders are mostly losers in trading, so the study of the dynamics of their positioning has a contrarian analysis vocation (contrarian analysis is a discipline of technical analysis of the financial markets).
The latest report published on Wednesday evening by the American Association of Individual Investors (AAII) shows bearish sentiment increasing with the price rebound, this is a factor in favour of more amplitude for the rebound. A retracement sequence towards $21,000 could take place ahead of the test of $25,000 resistance.
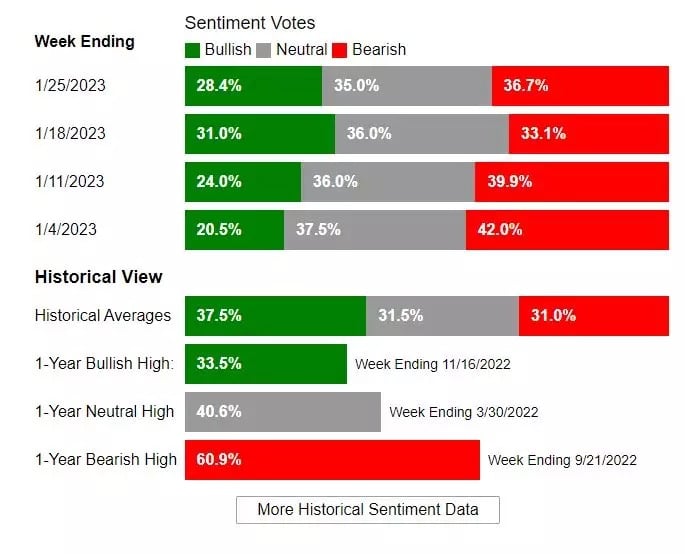
US Retail Investor Sentiment Histogram from the American Association of Retail Investors (AAII)