
The market is currently saturated with conflicting signals. Let’s let the movement settle and observe the buying and selling dynamics of various geographic market areas, as well as various cohorts of holders, to answer the question, “Who are the current buyers and sellers? “
Bitcoin sends mixed signals
Bitcoin (BTC) price maintains its short-term bullish momentum. Testing the upper bound of the range ($19k – $22k) as support, the price is giving hope for a recovery although the underlying trend remains bearish.
Given the subdued on-chain activity, recent long-term investor spending, rising speculative risk and short-term momentum reversal, the market is now saturated with mixed signals.
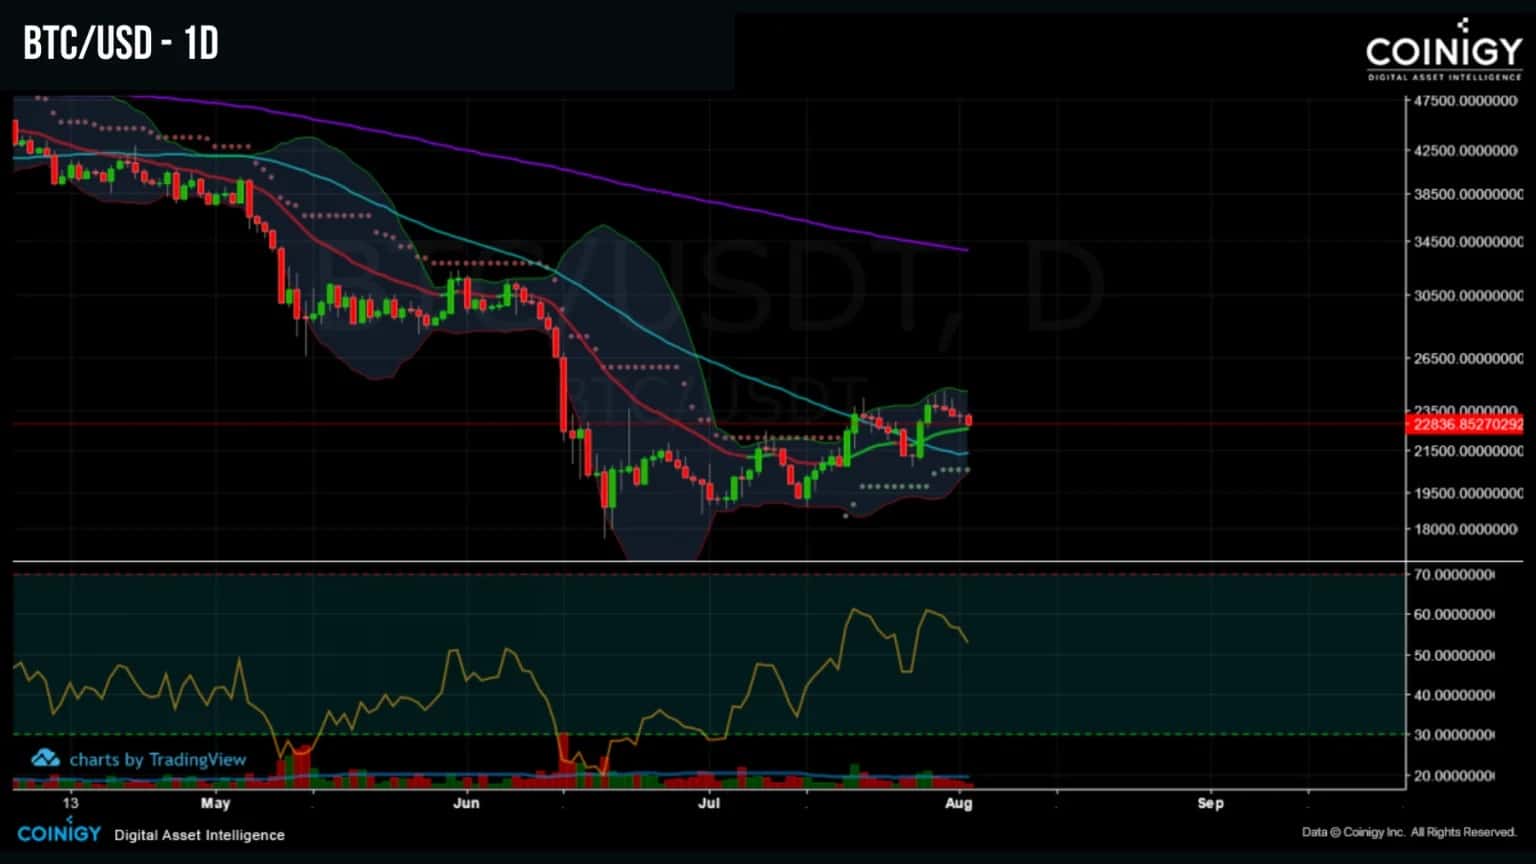
Figure 1: Daily BTC price
So, in order to let the current movement decant, this week’s analysis will focus on the buying and selling dynamics of the various geographical market areas, and then on the triptych of Individuals – Traders – Whales, in order to answer the following question:
The geographical market areas
Introduced by Glassnode in March 2022, a series of metrics that track cumulative price movements during trading hours in the US, Europe and Asia provide insight into which geographies are leading or lagging in terms of market pressure.
They allow us to observe the reactions of the various players to the structuring changes in the market and to the BTC price action.
A triptych composed of the US (orange), the EU (blue) and Asia (green), these heterogeneously fluctuating metrics currently indicate that global behaviour is buying, although the Asian market is showing a slight bearish bias.
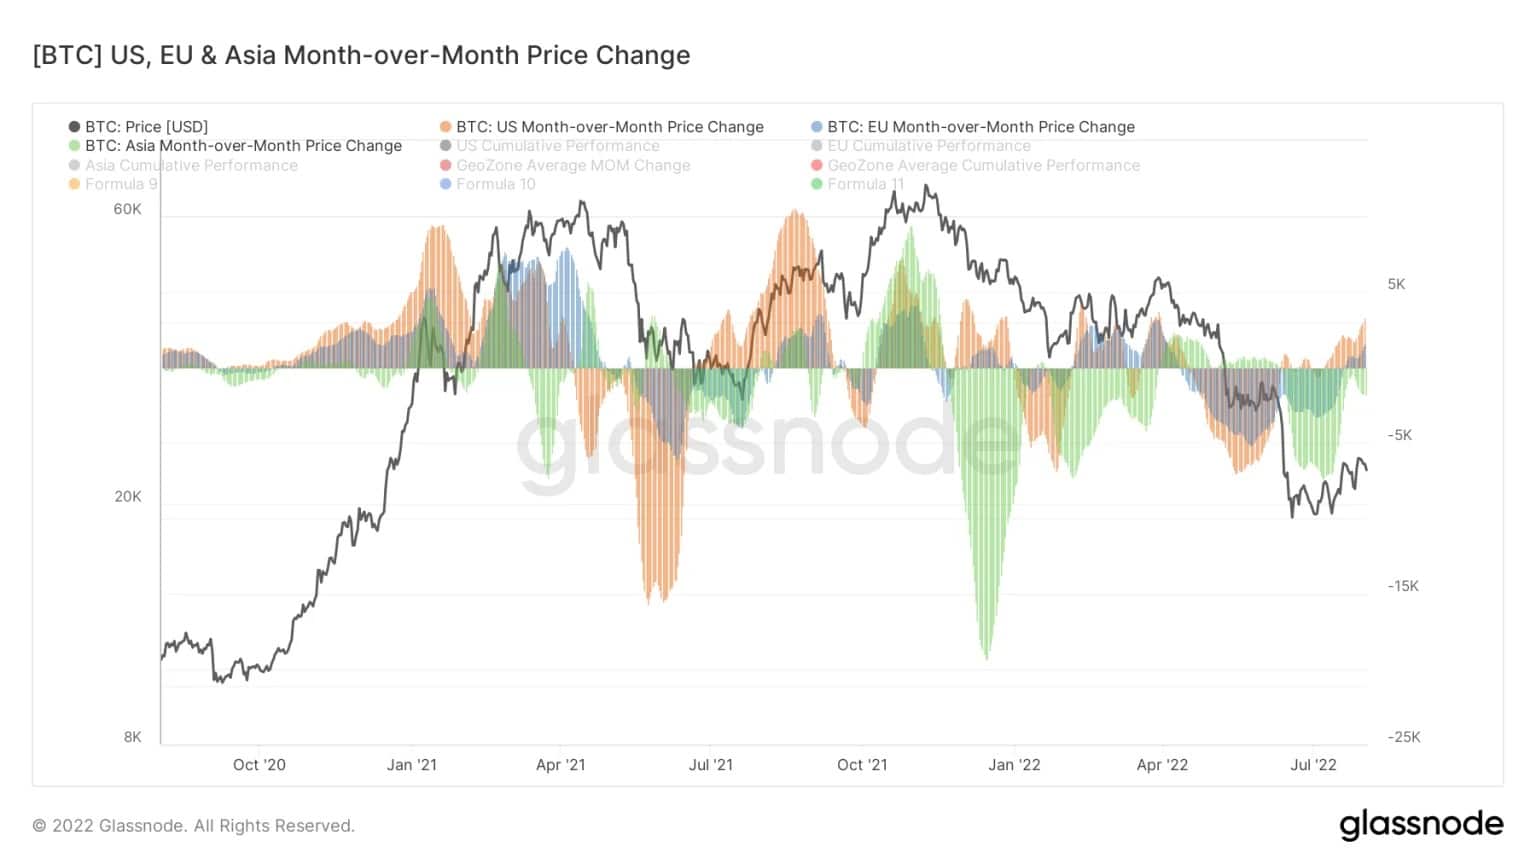
Figure 2: Geographic market areas
Starting by looking at the buying/selling behaviour of the US markets, it appears that they accumulated strongly during the early 2021 rally before slowing down along with the BTC price.
They sell off from May to July 2021 with record sales, then quickly re-accumulate during the September rally, before limiting their purchases (blue arrow) from November 2021 to July 2022.
Note that North American markets dominate the sell-off following the Terra/LUNA collapse from May to June, before adopting a mixed pattern of hot and cold during the downturn that brought the BTC price to current levels.
Currently, the US is leading the way with moderate buying pressure on the market
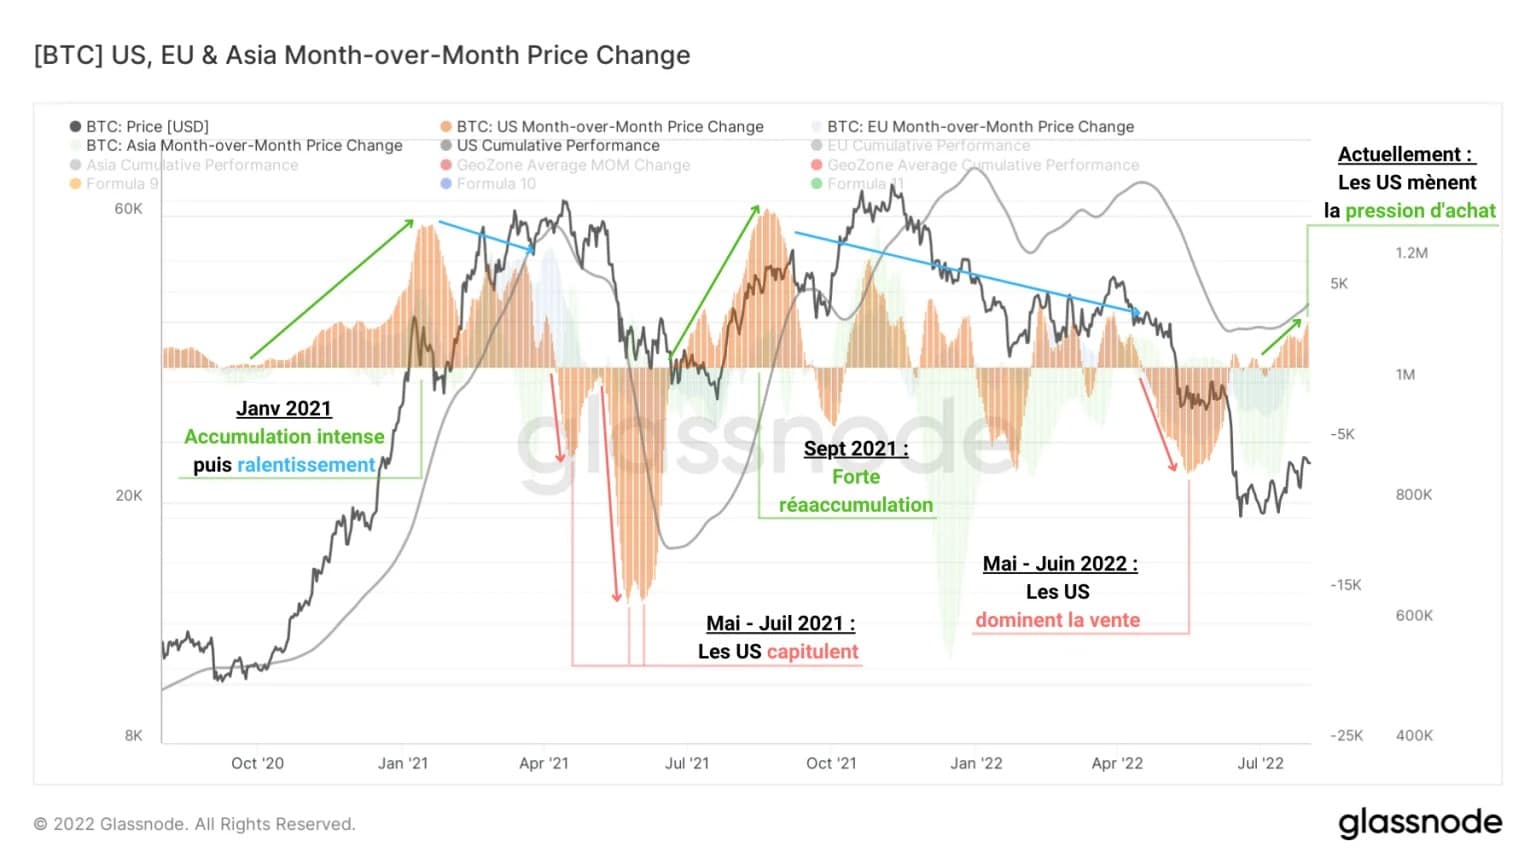
Figure 3: Change in US market position
Globally, the European Union seems to be following the behaviour of their counterparts across the Atlantic, albeit with a less intense approach.
Following the US build-up in early 2021, Europe increases its exposure at the March and April highs, yet sells off moderately during the May to July 2021 period.
Inducing little buying pressure as BTC rallies towards the $69k ATH, European markets behave moderately, sometimes bullish, sometimes bearish, in relatively small amounts.
Selling off gradually in May 2022, Europe eases its bearish pressure during June (yellow arrow), before cautiously following the US buying bias since last week.
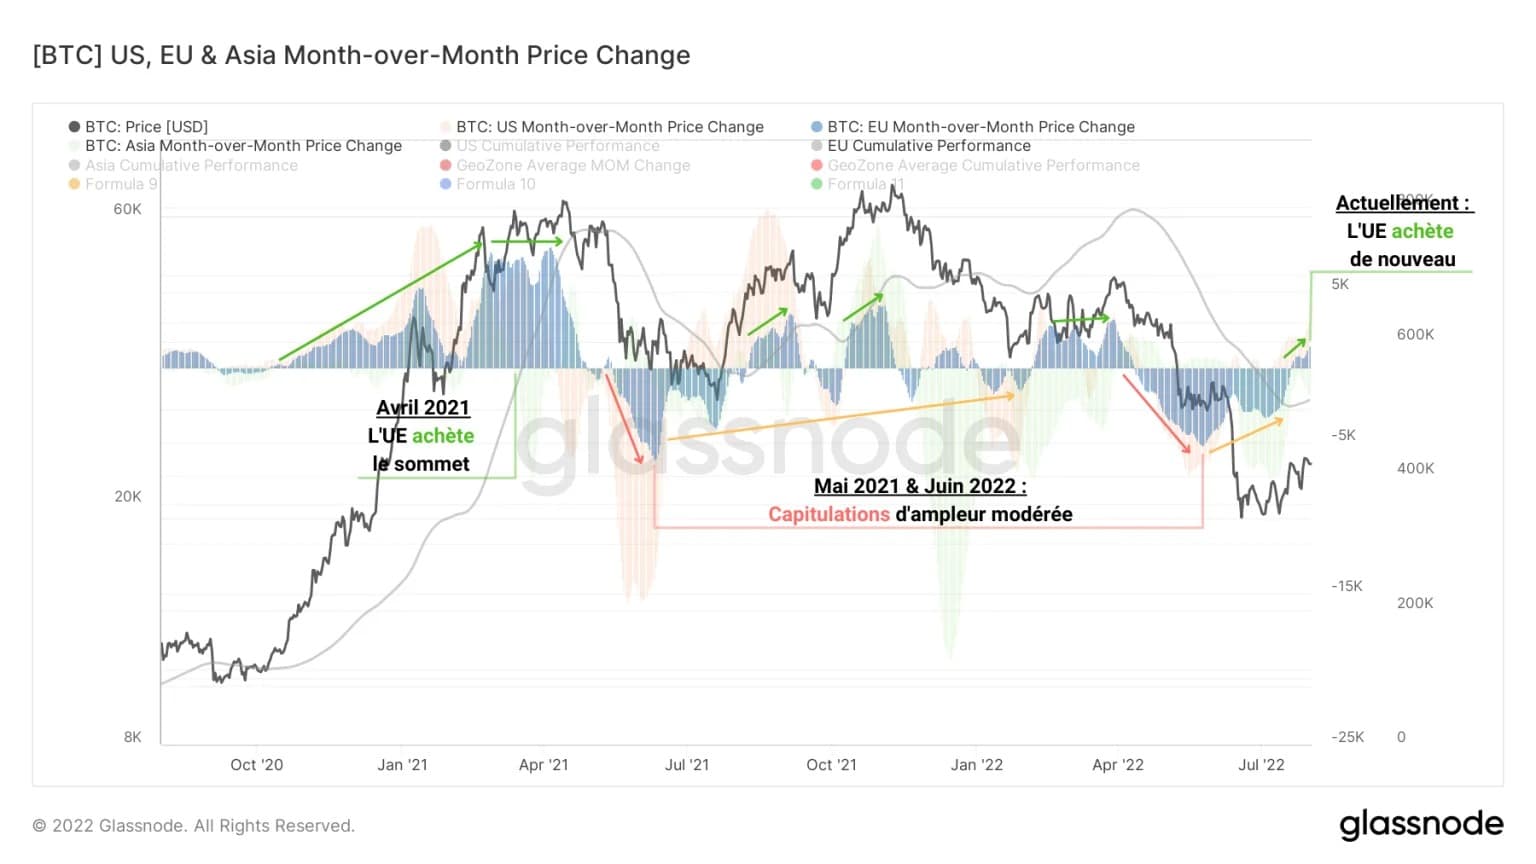
Figure 4: European markets change position
Asian markets have their own dynamics, which sometimes run counter to Western markets.
Indeed, Asia only participates late in the early 2021 rally and induces limited selling pressure during the May-July 2021 decline.
Leading the buy near the November ATH, Asia reverses to record selling in late 2021, before repeating this behaviour in May 2022, capitulating further in July.
Current Asian market positions are still short, although the extent of their downward pressure has diminished.
With a negative overall performance, Asia appears to be the worst performing region over the past two years.
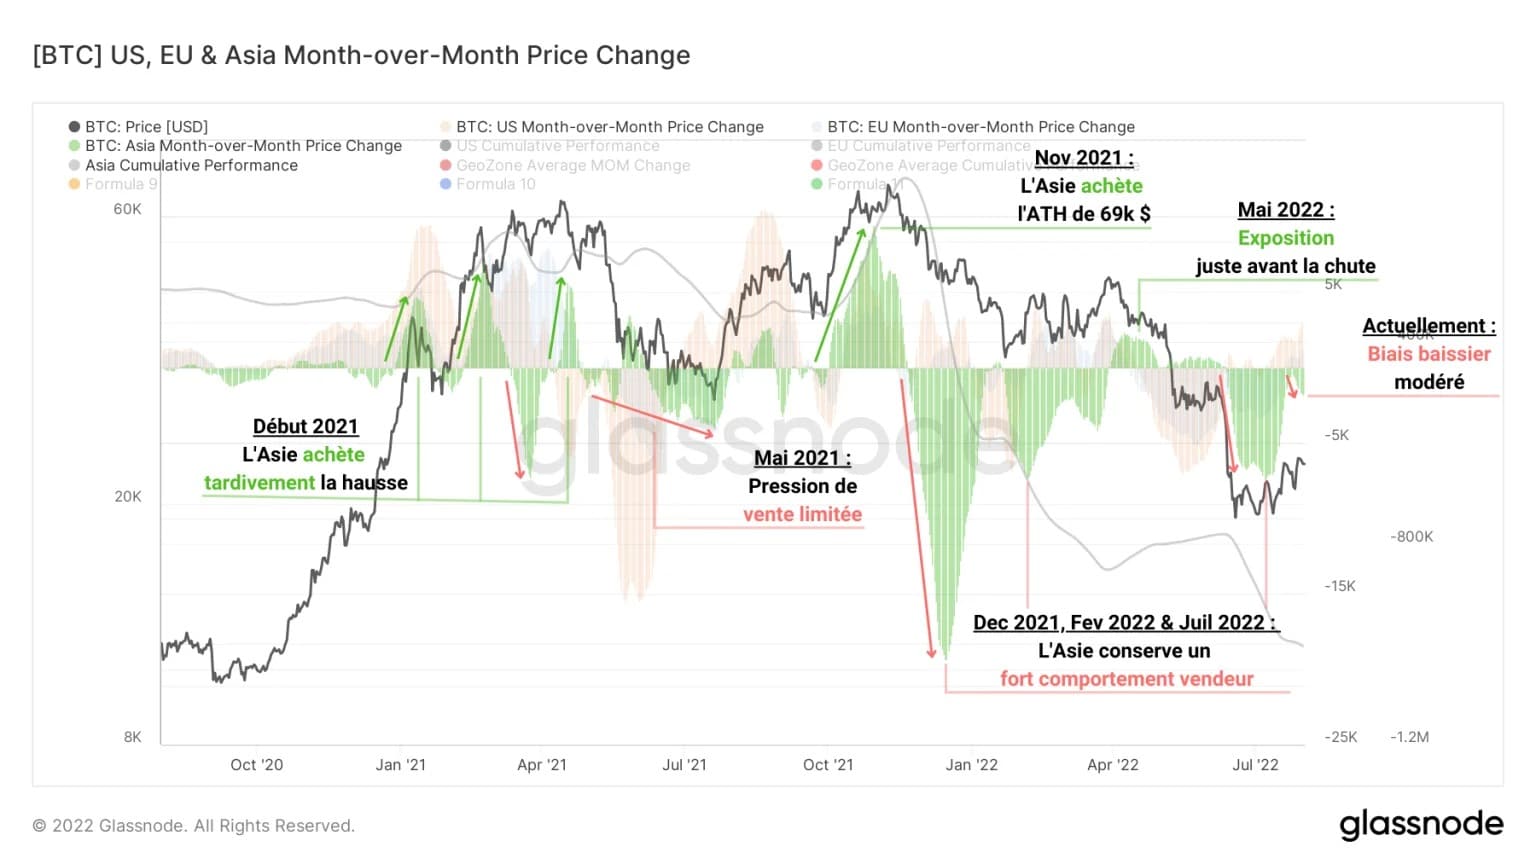
Figure 5: Change in position of Asian markets
Small hands accumulate, big hands distribute
Now let’s take this study a step further by analyzing three cohorts of participants based on their BTC holdings.
By leveraging Glassnode’s heuristics, we can gain insight into the number of entities with between 0.001 BTC and 1 BTC on the chain.
This cohort, named “Individuals” or sometimes “Shrimps” represents entities owning small amounts of BTC and not having a professional activity of selling/buying/keeping bitcoins.
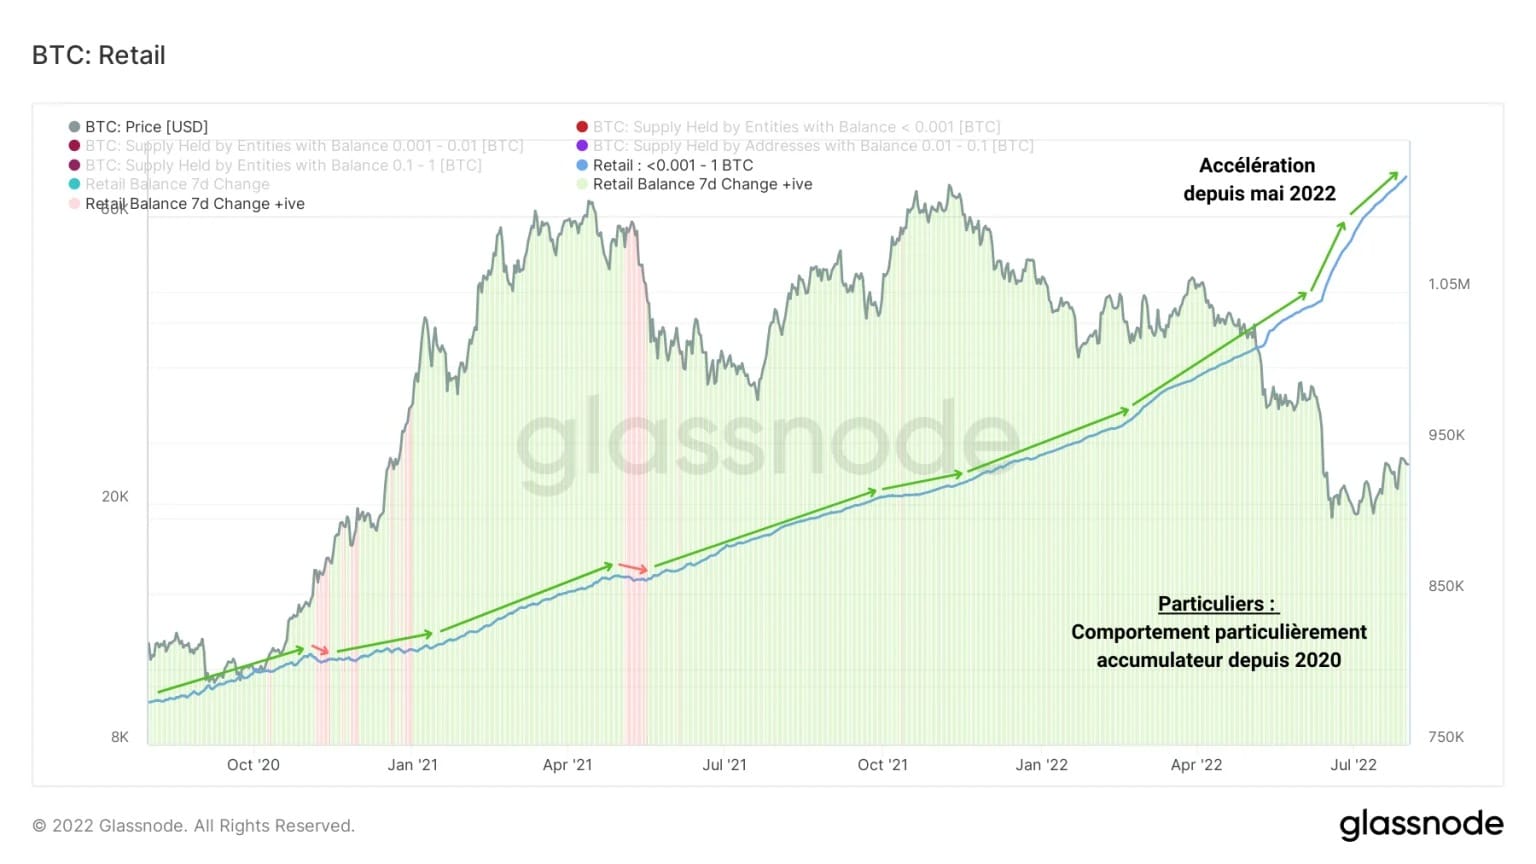
Figure 6: Supply held by Individuals
From the chart above, it is clear that the small portfolio cohort has been exhibiting strong accumulative behaviour over the past few years. Note that current price levels are particularly attractive to these entities.
The second cohort, presented below, is the “Traders”. Composed of entities holding between 1 and 1000 BTC, this group gathers some large individual fortunes but mostly businesses, having custody of large sums of bitcoins, for themselves or for their customers.
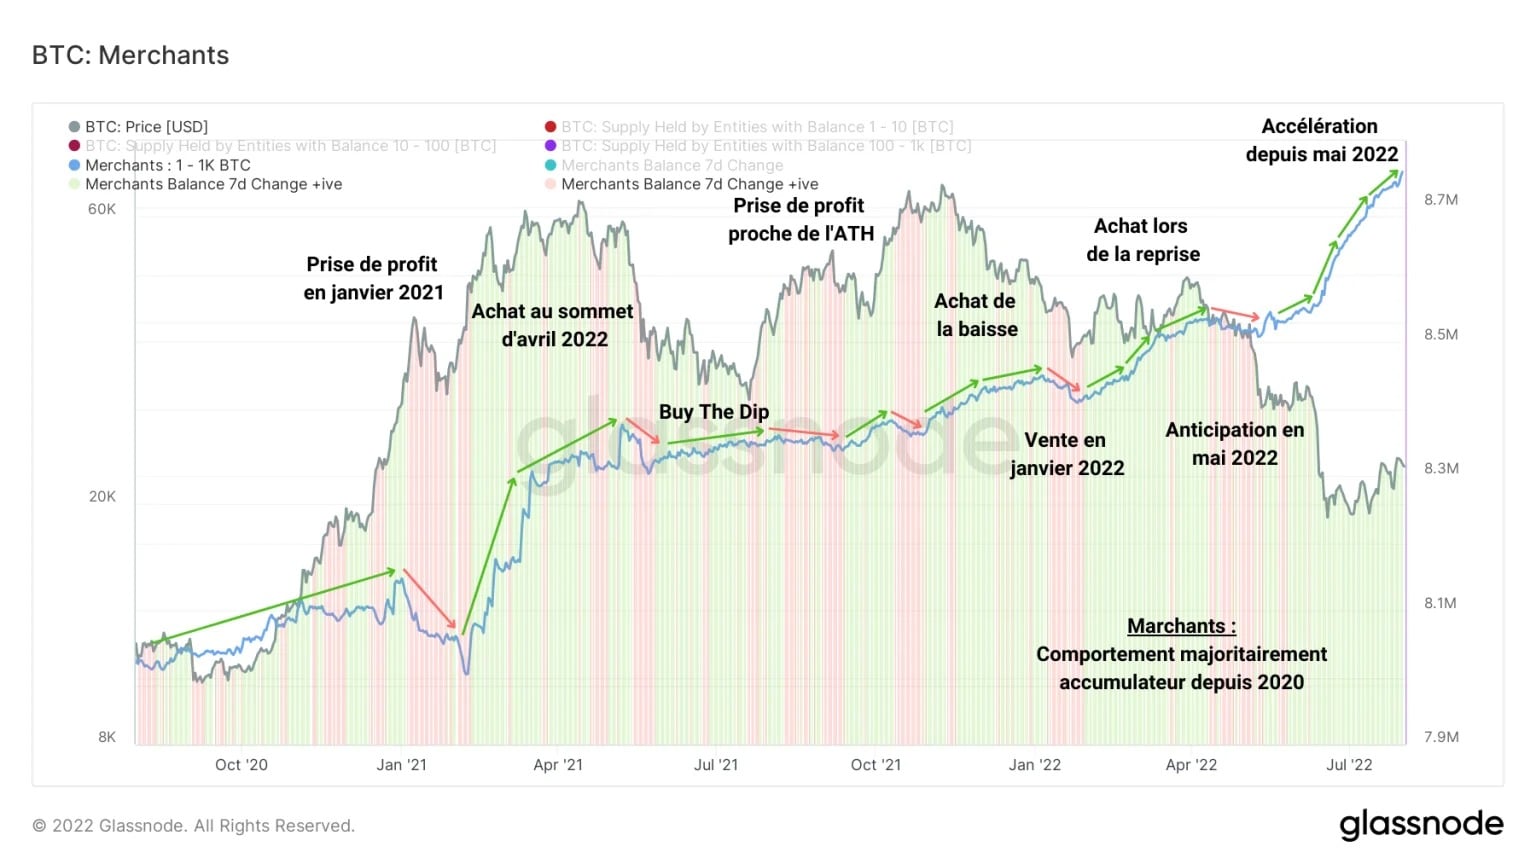
Figure 7: Supply held by Merchants
Despite being more sensitive to market movements, the holdings of this cohort are in a long-term uptrend, which has also accelerated since May.
Finally, the cohort holding more than 1000 BTC, gathering the entities known as “Whales”, has a behaviour opposite to the two previous ones.
After taking profits at the March and April 2021 highs, the supply held by this cohort rose slightly before exhibiting distributor behaviour from November 2021.
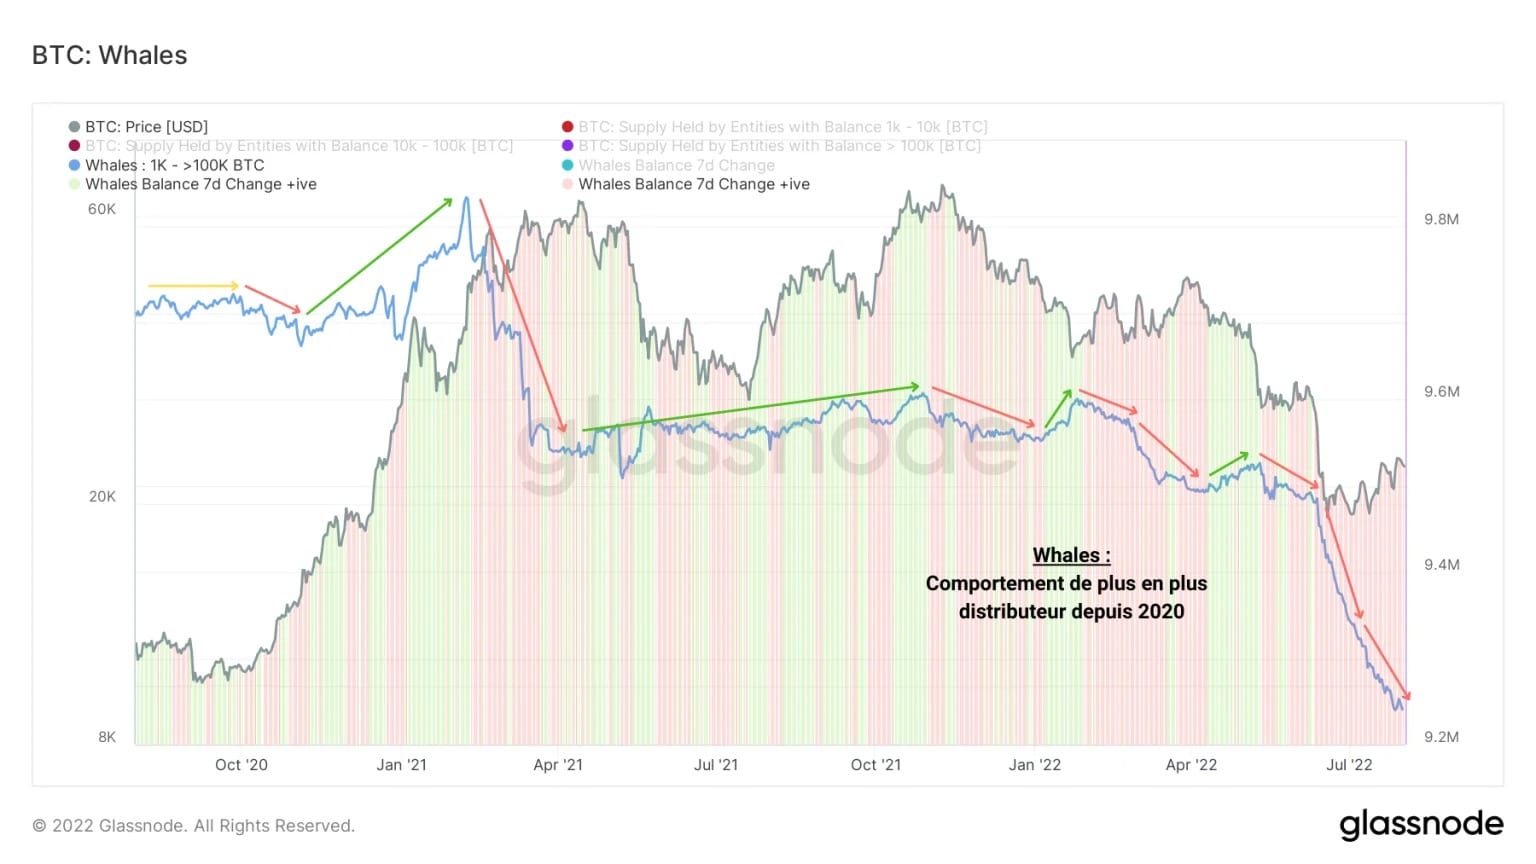
Figure 8: Supply held by Whales
This dynamic then increased until it reached a peak in distribution in June and July 2022. Thus, it appears that this cohort has largely participated in the sales pressure and supply redistribution process over the past two years.
Summary of this onchain analysis
In sum, this week’s data indicates that there are significant divergences in behaviour between different geographic market areas.
The US markets, aggressive bettors, are often the first to buy a rise and slow down when the move fades. This does not prevent them from making significant losses, such as during the capitulation from May to July 2021.
The European Union plays the role of a moderate follower, following the US trends, albeit on a controlled scale.
On the other hand, the Asian markets often behave in the opposite way to the Western markets, with a negative overall performance.
Furthermore, the study of cohorts of holders according to their assets allows us to determine that individuals and traders adopt a major accumulation behaviour, while whales tend to distribute, actively participating in the distribution of capital.
Sources – Figures 2 to 8: Glassnode