 on-chain analysis: Bitcoiners wary of exchanges?")
Centralized exchanges play a major role in the BTC market. Yet, since 2020, distrust of exchanges has been growing as BTC holders apply the maxim “not your keys not your coins”. This behavior was exacerbated by the fall of FTX. On-chain analysis of the situation
Exchanges: intermediaries with diminishing influence
Since 2010, centralized exchanges (CEX) have played a major role in the BTC market, providing entry and exit solutions for retail, private and institutional investors.
Yet, for several years now, mistrust of CEXs has been growing as BTC holders apply the maxim “not your keys not your coins” by holding their wealth autonomously.
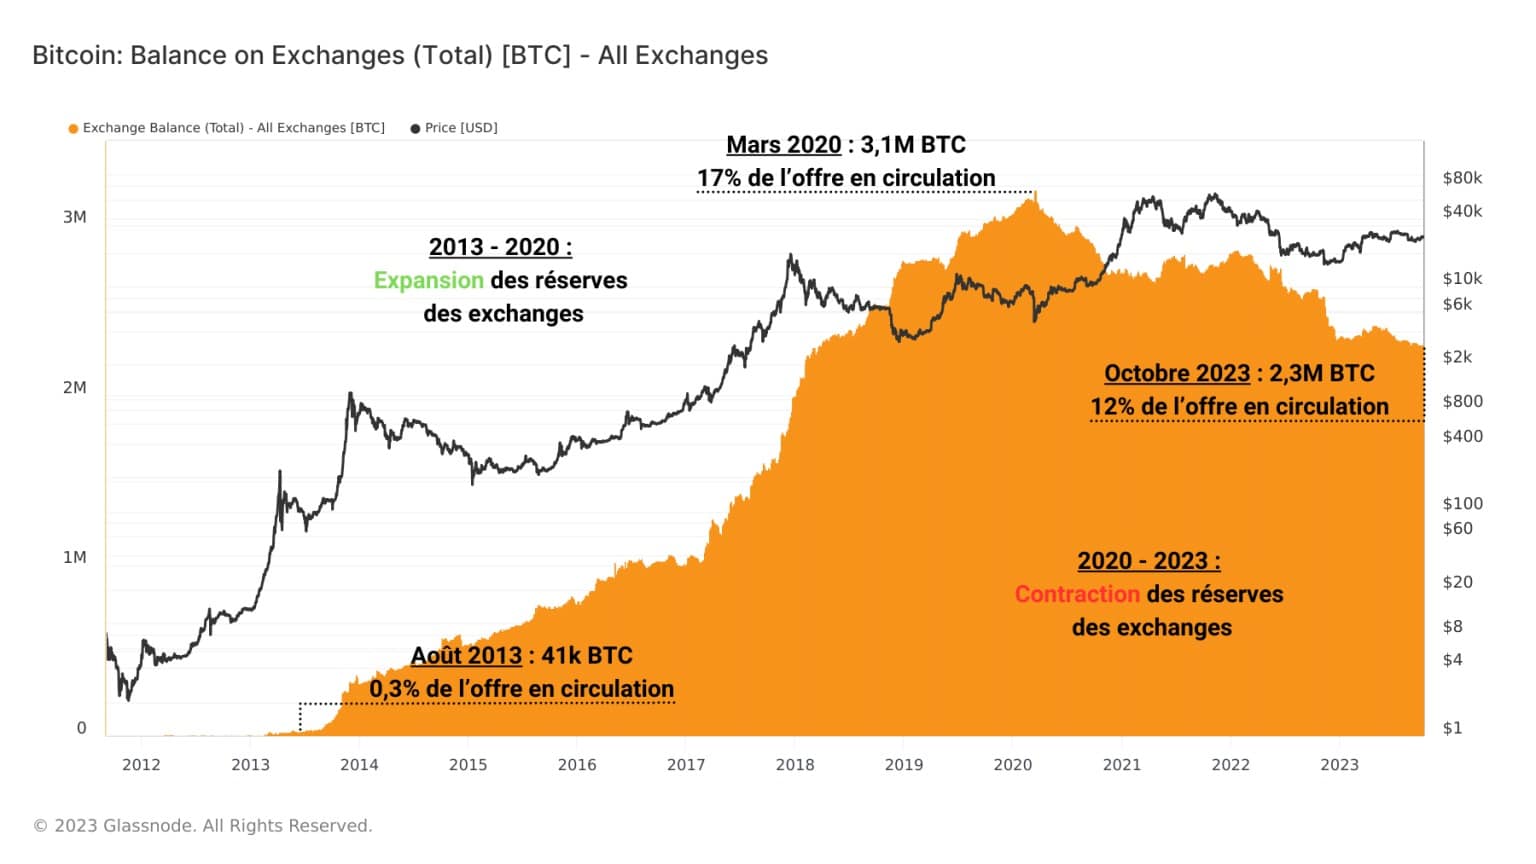
Figure 1: BTC reserves of exchanges
Today we’ll be analyzing the dynamics of CEX reserve flows and the relationships of short-term (STH) and long-term (LTH) investors with these platforms.
First point: since March 2020, total exchange reserves have fallen from 3.1 million BTC to almost 2.3 million BTC currently, representing 12% of the supply in circulation.
As a result, the overwhelming majority of existing BTC remain autonomously held, with their only relationship to exchanges being their potential utility in facilitating entries and exits.
Reserves and outflows from exchanges
Separating the supply held between the various exchanges, it seems that a handful of them actually concentrate a majority of reserves.
Indeed, the three exchanges with the largest BTC reserves (Binance, Coinbase and Kraken) alone account for over 60% of the total supply associated with the exchanges.
The Binance platform accounts for almost 30% of all BTC deposited or held on the CEXs, with 670,000 BTC under its control.
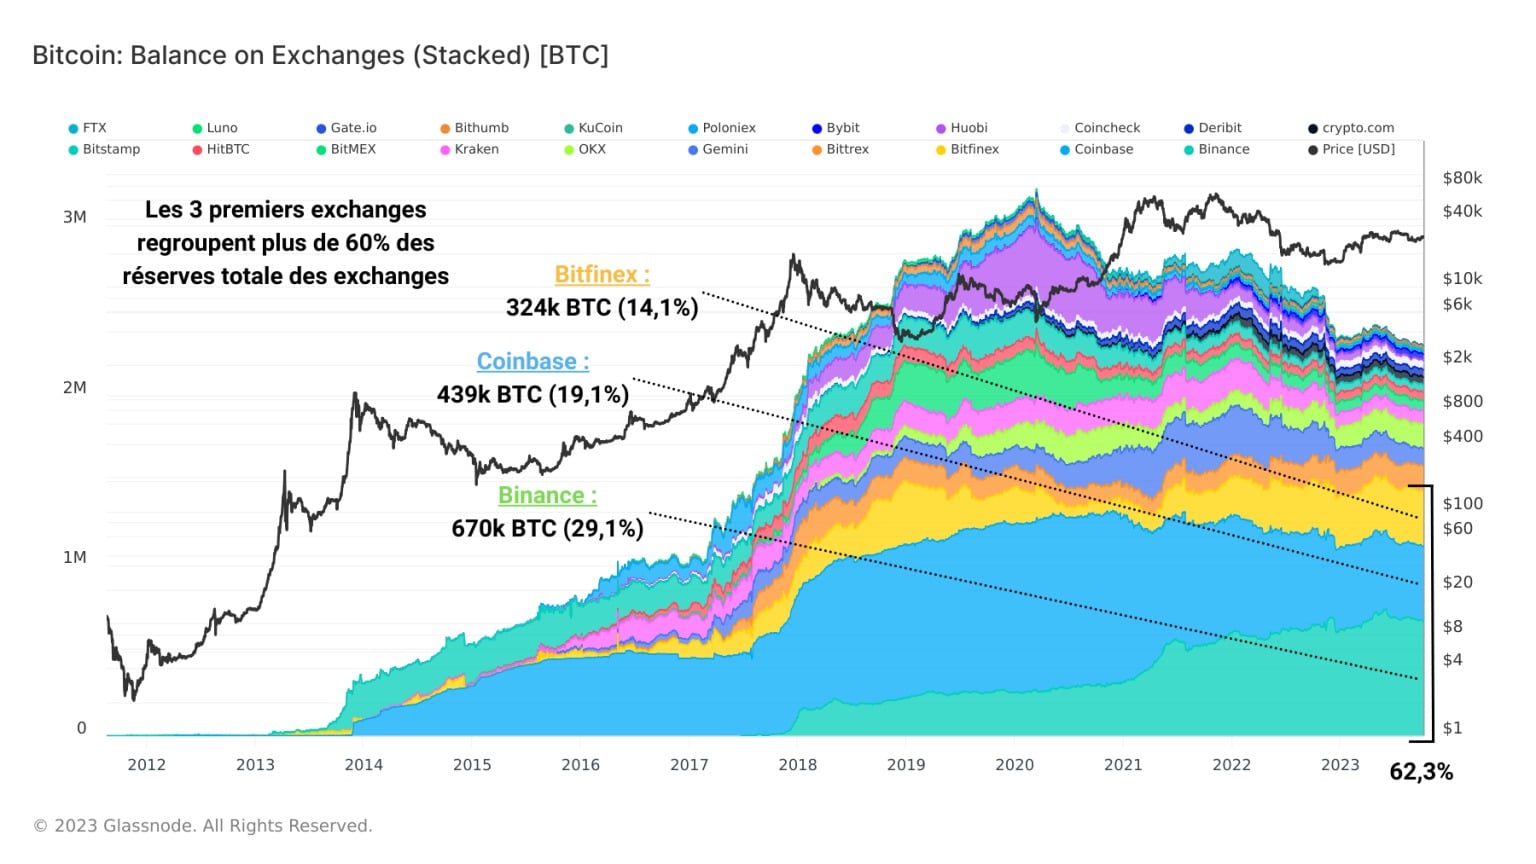
Figure 2: BTC reserves of exchanges
Measuring the monthly average of net flows (deposits – withdrawals) for all exchanges, we can highlight two periods with distinct characteristics:
- 2013 to 2020: Expansion of exchange reserves and net dominance of deposits. The young BTC market is flooded with BTC from miners, often passing through exchanges before being acquired by investors;
- Since March 2020: Contraction of exchange reserves and net dominance of withdrawals. The BTC market is maturing and BTC holders are gradually moving towards independent custody of their assets.
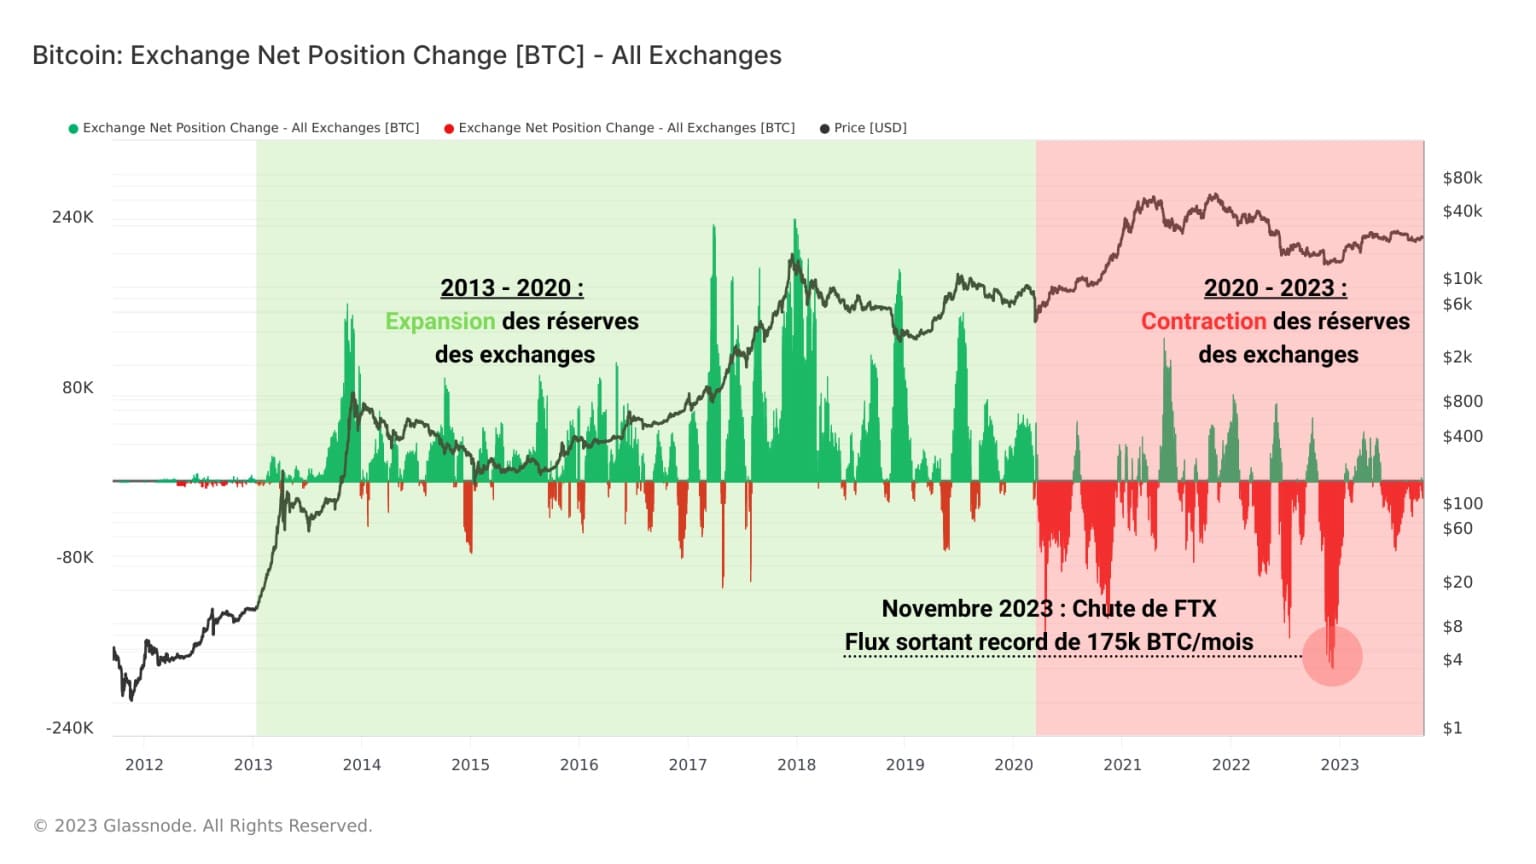
Figure 3: Net flows from exchanges
The current withdrawal dynamic reached its peak in November 2023 with the collapse of the FTX exchange. In less than a month, over 150,000 BTC left CEX, the majority visibly exiting Coinbase.
Incoming flows and short-term holders
Looking at the current dynamics of incoming flows on exchanges allows us to determine which groups of individuals interact most with these platforms and are looking for liquidity.
Since July and the second rise in the BTC price towards $30,000, flows directed from the portfolios of short-term investors (STH) to the CEX have almost doubled and currently account for over 60% of daily deposits.
It seems that this cohort is the most active on the exchanges, to the detriment of long-term investors (LTH), who record very low deposit volumes.
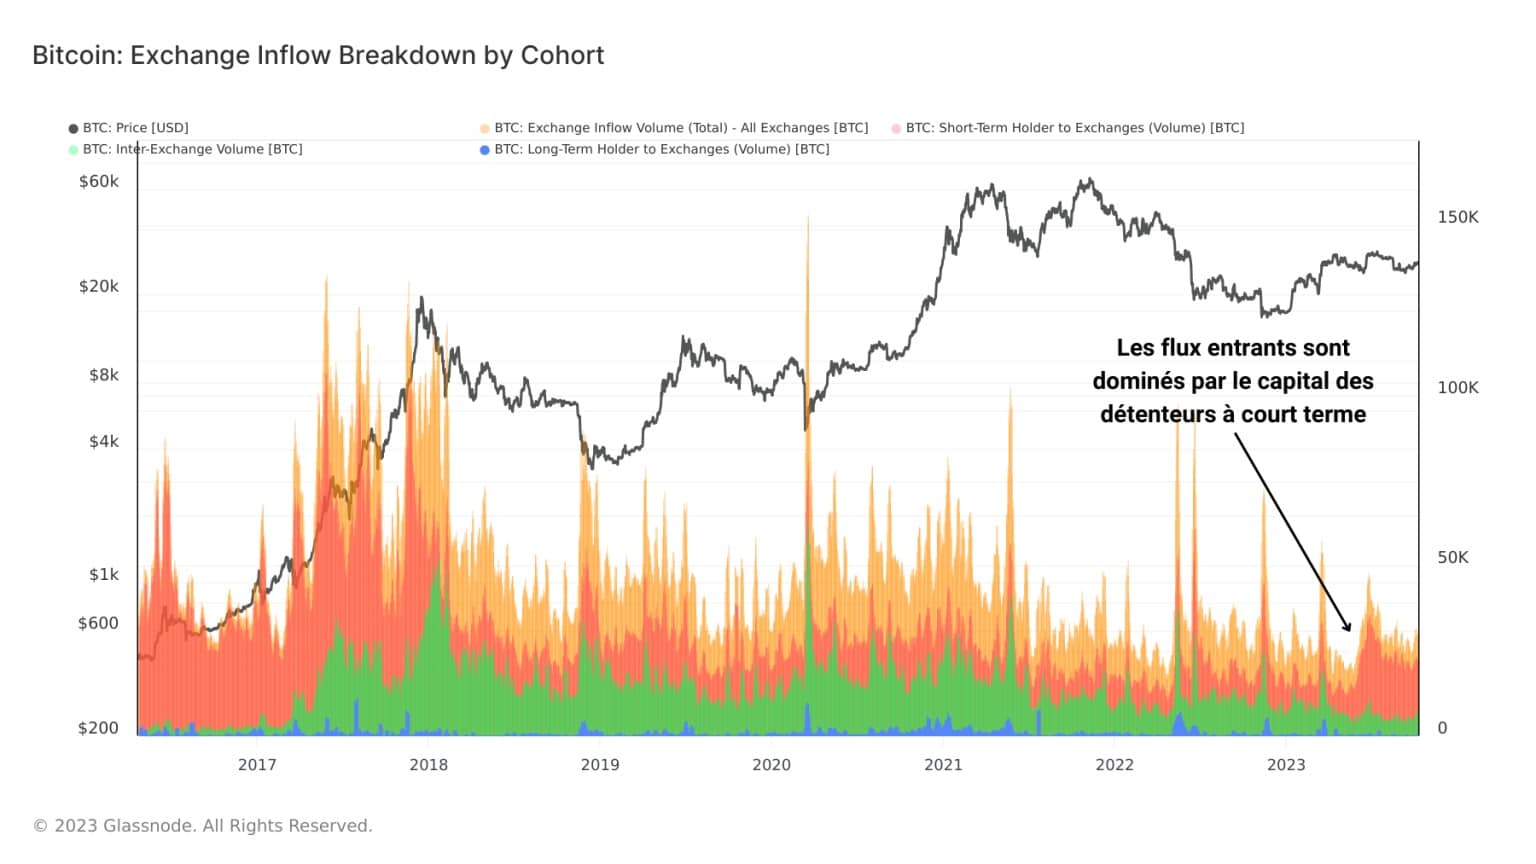
Figure 4: Exchange inflows
By isolating the incoming flows from STH to exchanges, we can note two observations:
- Peak STH deposit volumes signal periods of heavy spending caused by episodes of high bullish volatility (profit-taking) or bearish volatility (loss-taking);
- Since taking a profit in July at around $30,000, STH deposit volumes have risen from around 10,000 BTC per day to over 20,000 BTC per day.
This activity is worth keeping a close eye on as it may enable us, by measuring the degree of profit/loss sent on CEXs, to obtain a proxy for cohort sentiment and its influence on the BTC price.
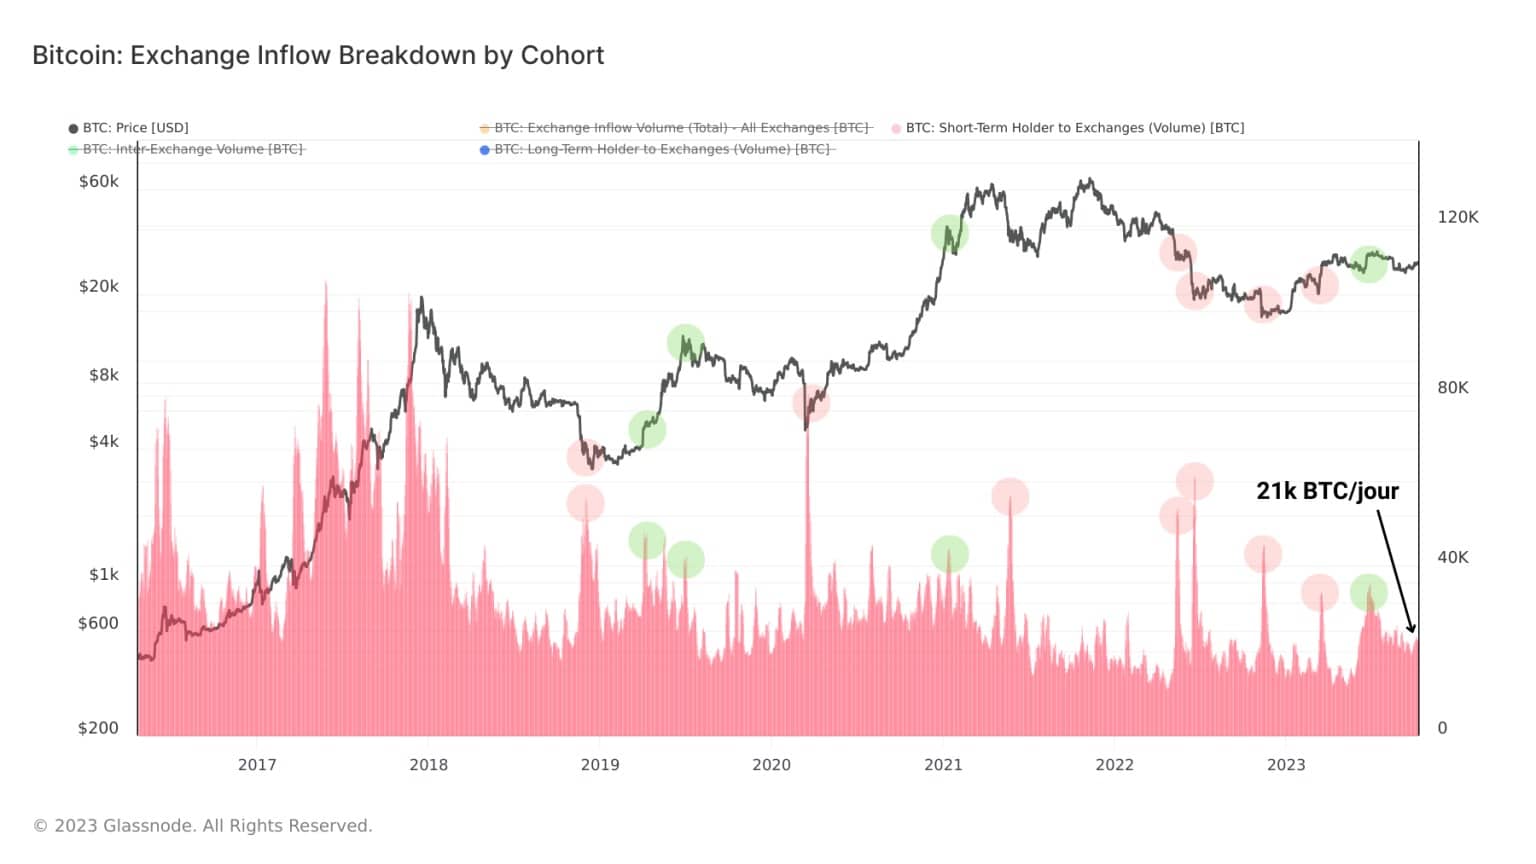
Figure 5: Inflows from short-term holders
The following graph shows the volumes of BTC in profit/loss sent to exchanges by STHs. By calculating the net profit or loss (volume in profit – volume in loss), we obtain a clear representation of the cohort’s spending behavior.
In this way, we can highlight periods of high loss-taking (negative sentiment) and high profit-taking (positive sentiment).
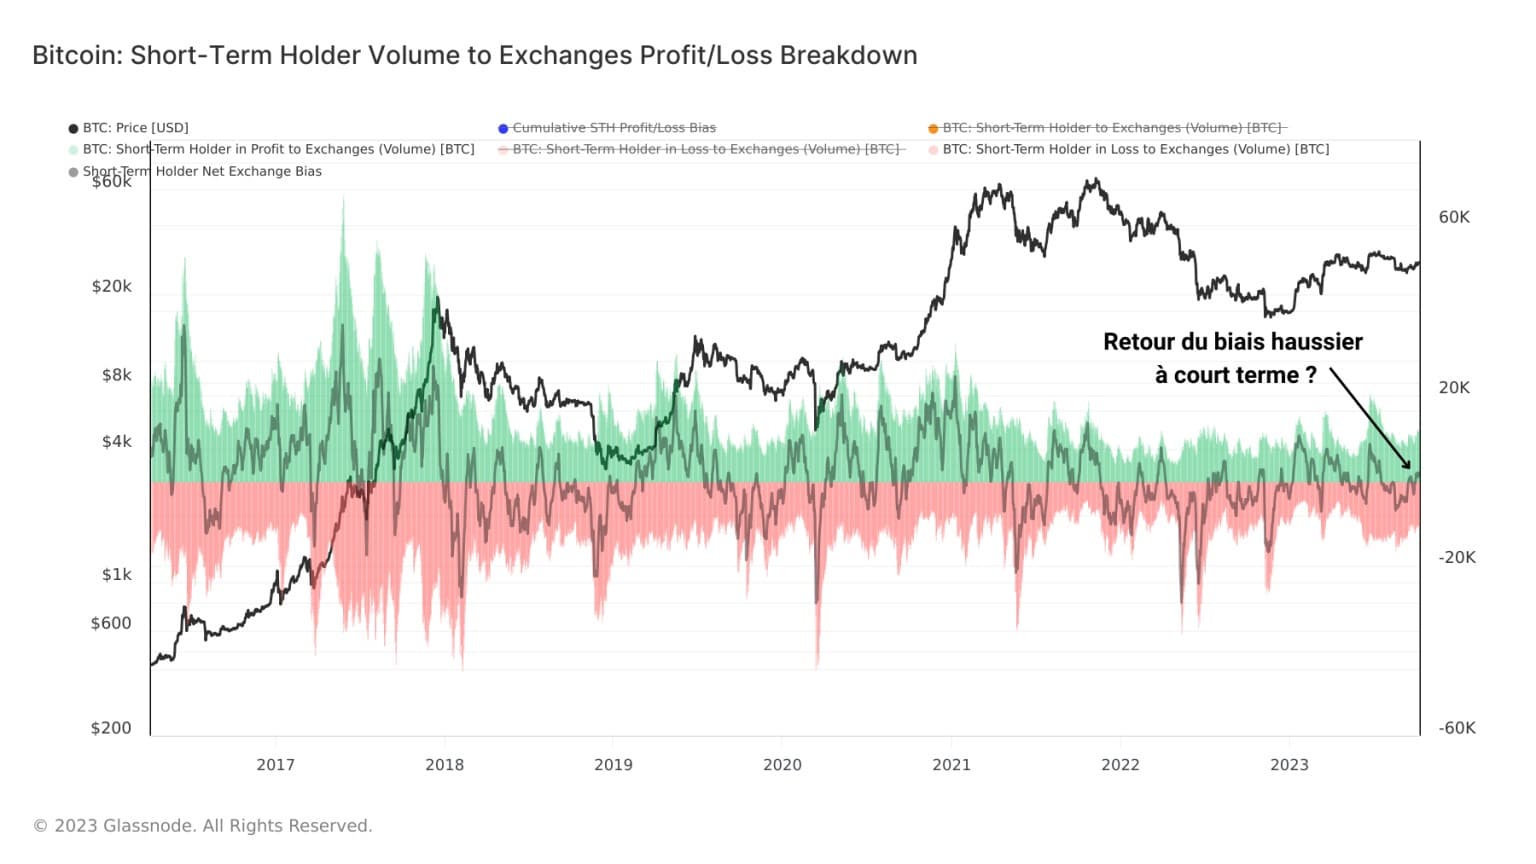
Figure 6: Net profit/loss flows of short-term holders
We can then note that 2023 was marked by a succession of profit-taking periods in January, March, April and July, before a period of moderate loss-taking set in between August and September.
Currently, the dominance of profit-taking volumes indicates the return of positive sentiment, which favors the formation of a short-term bullish bias on the market.
Summary of this on-chain analysis of Bitcoin
This week’s data shows that the influence of exchanges on the BTC supply and market has been falling since 2020, as evidenced by the massive exodus of BTC to sovereign wallets.
This behavior has been exacerbated by the fall of FTX, which has triggered a return of mistrust and a real exodus of BTC holders from CEXs.
While Binance, Coinbase and Bitfinex alone account for almost 62% of total exchange reserves, it seems that the majority of BTC withdrawn from centralized platforms since 2020 has originated from Coinbase.
Today, the entities making the most use of the CEX are short-term holders, who have recently been sending large numbers of BTC in profit, signalling the return of positive short-term sentiment.