
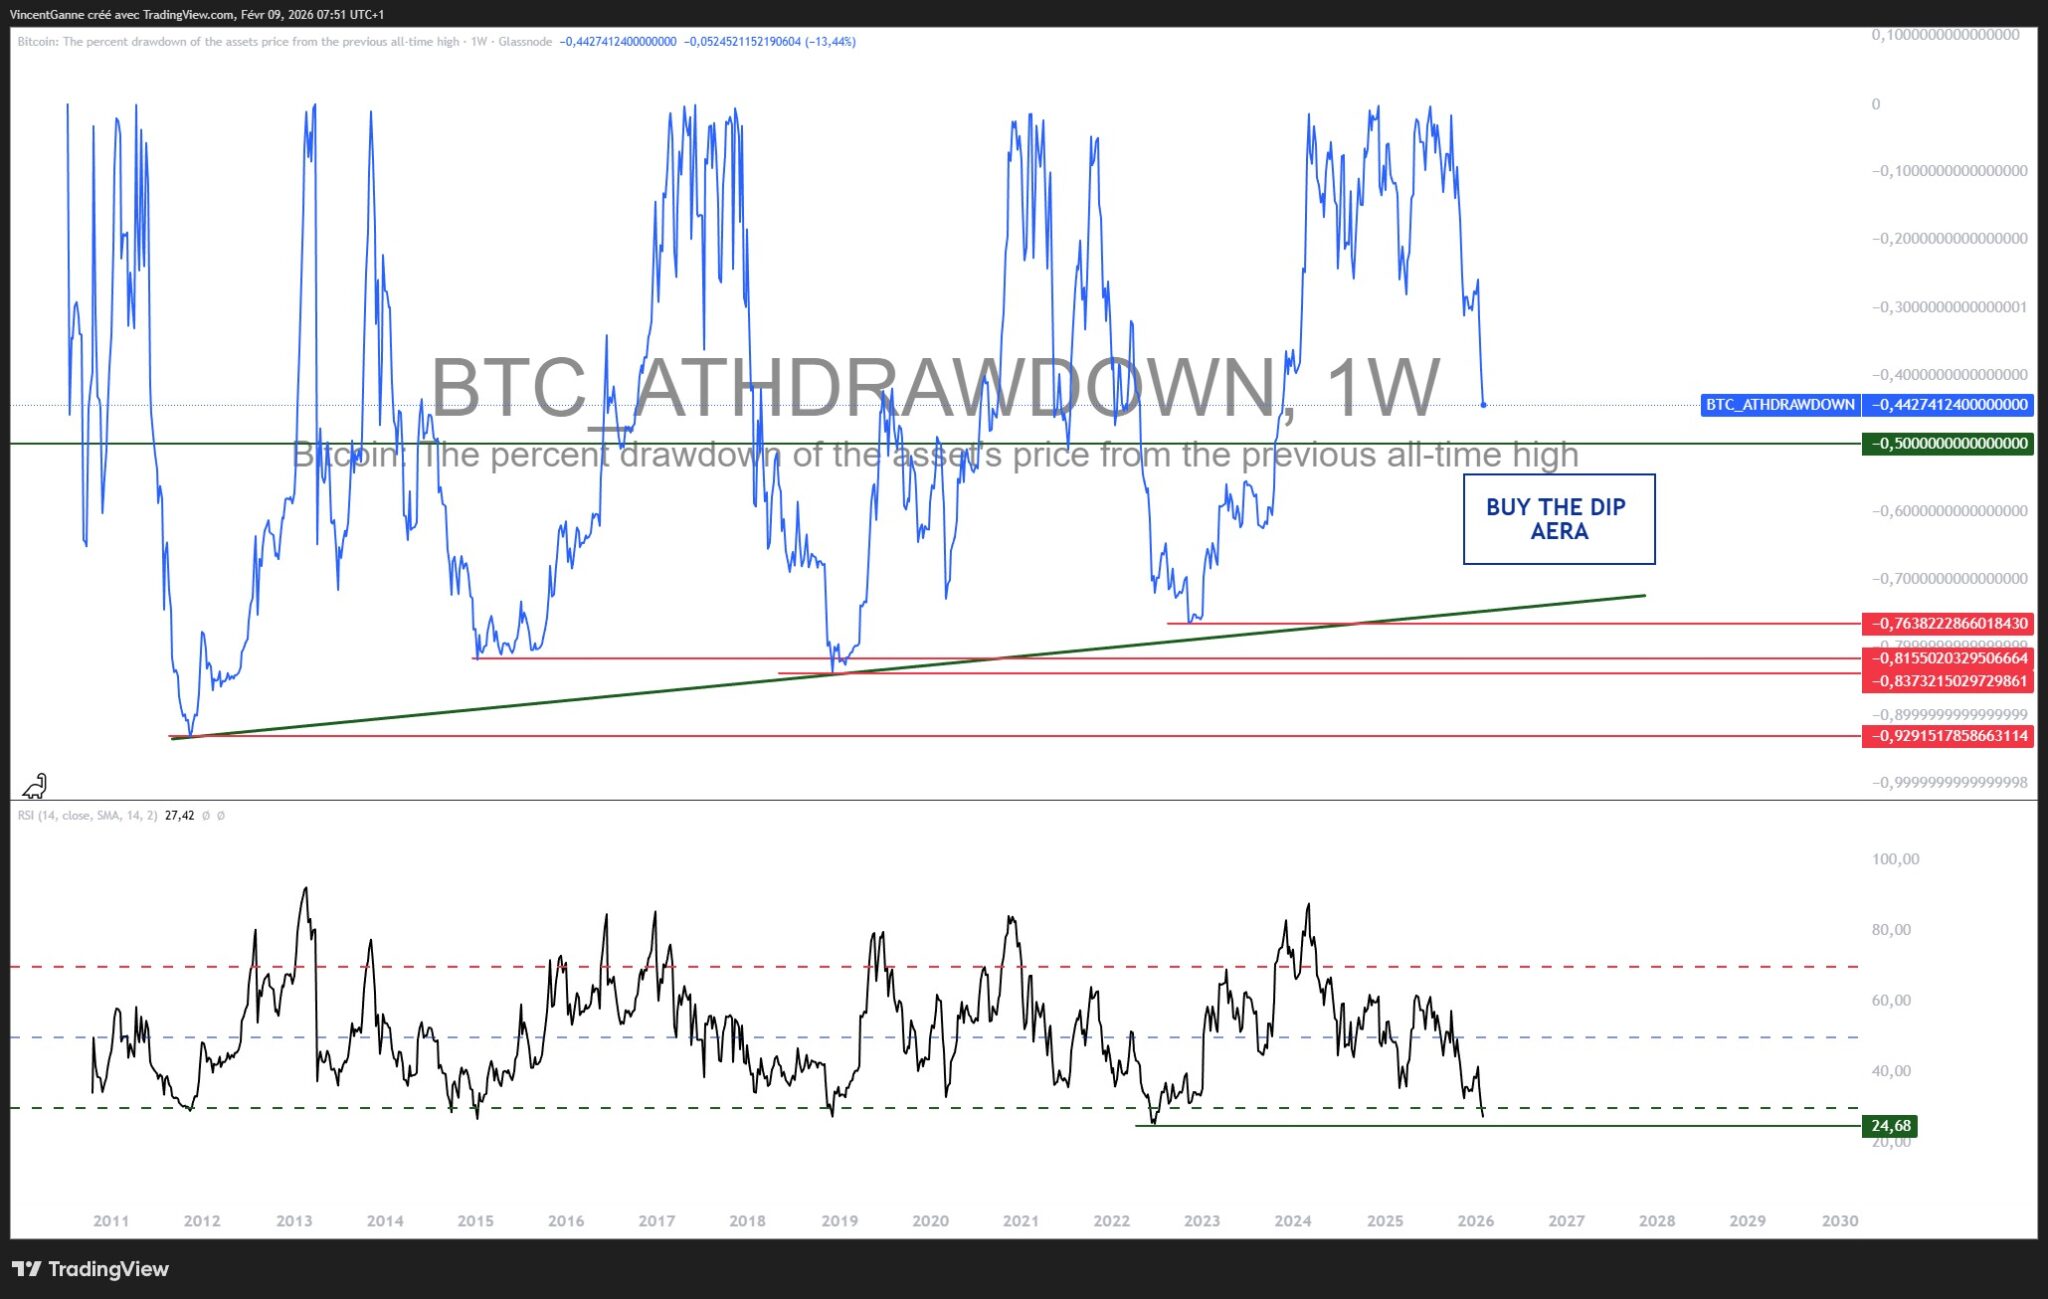
The Bitcoin price entered its bear market 126 days ago and, as of last week, had fallen 52% from its all-time high of $126,000. Is this enough to say that the cyclical bear market is over?
Is the Bitcoin bear market already over?
In a cyclical bear market for Bitcoin, there are two aspects to consider:
- The price aspect, the drawdown, and the structure of the bear market;
- The time aspect, i.e., the total duration of the bear market before it transitions into a cyclical bull phase.
Naturally, the market does not transition directly from a downtrend to a new uptrend. In every instance, Bitcoin’s history shows that there has been a long accumulation phase lasting several months—that is, the building of a technical foundation to resume an upward trend in a very healthy manner.
Have we already entered this sideways accumulation phase? It’s possible from the perspective of the drawdown and the three-wave downtrend structure, but it’s still unlikely from a time perspective, as 126 days is still a bit short.
Nevertheless, many technical tools and approaches suggest that a Bitcoin price between $50,000 and $60,000 represents a Dollar Cost Averaging (DCA) opportunity for the medium to long term?
Dollar Cost Averaging (DCA) involves gradually investing a fixed amount at regular intervals, regardless of price. This approach helps smooth out the entry price, reduce the impact of volatility, and, above all, avoid emotional decisions, which are particularly common during bear markets.
When applied to Bitcoin, DCA makes the most sense during advanced drawdown phases, when pessimism is dominant and long-term indicators have reached a technical oversold zone. Historically, zones between –50% and –70% drawdown relative to the previous peak have often been very favorable accumulation zones for patient investors.
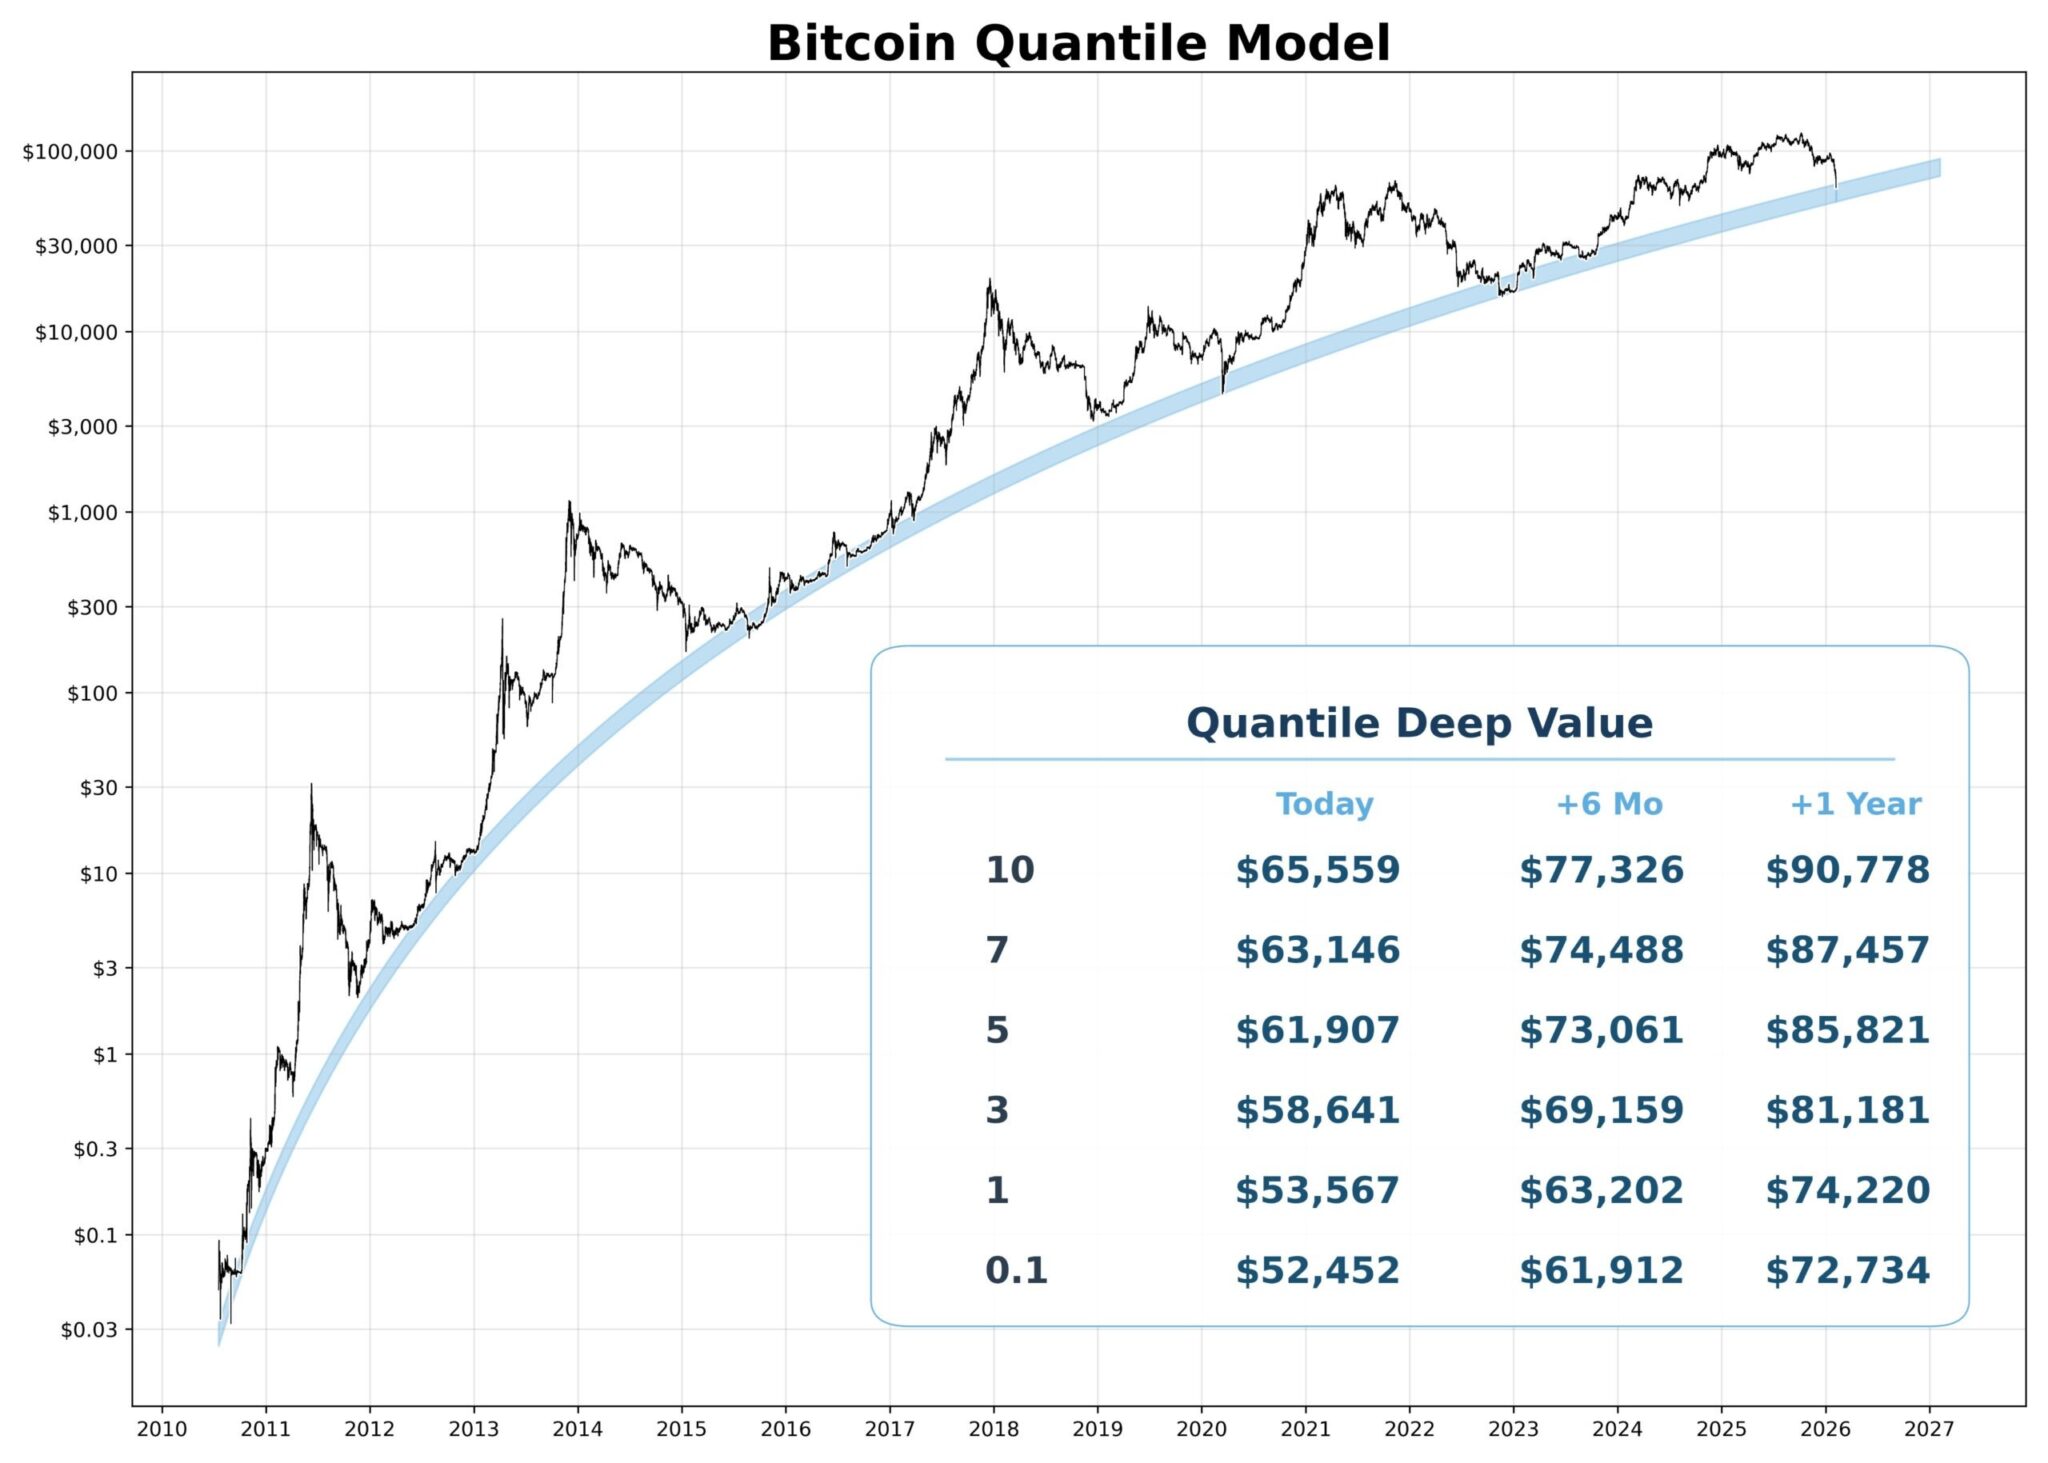
From a quantitative perspective, logarithmic regression and price quantile models currently place the $50,000–$60,000 range in the lower bands of relative valuation, consistent with a phase of cyclical undervaluation.
These levels also correspond to former major support levels established during the previous expansion phase, reinforcing their technical credibility.
There is no reason to believe that last week’s low of $60,000 is the final low of the bear market, and it is entirely possible that this level will be retested in the coming months. However, most long-term BTC forecasting models, such as the Quantile model based on the power law, describe the $50,000–$60,000 range as an area where a dollar-cost averaging (DCA) strategy has a high probability of being profitable in the long term.
Finally, the time factor remains key. Bitcoin bear markets have rarely been quick. They are most often characterized by alternating technical rebounds, frustrating sideways phases, and late capitulations, and on average they have lasted 12 months, which brings us to around September/October of next year. It is precisely in this context of patience that DCA proves its worth, allowing investors to gain exposure without trying to anticipate the perfect low point in terms of price and timing.
In conclusion, the range between $50,000 and $60,000 does not guarantee that the bear market is over, but it represents a consistent zone of gradual accumulation for medium- and long-term investors.