Following The Merge update to the Ethereum blockchain, measures of chain demand and validator responsiveness are falling, while ETH 2.0 custodians are still underwater, showing an average latent loss of -30%. On-chain analysis of the situation
The Merge concludes with a remarkable technical success
More than a month after The Merge and the Ethereum network’s move from the PoW (Proof of Work) consensus mechanism to PoS (Proof of Stake), the price of Ether (ETH) dropped to a low of $1200 before recently rising back to $1500.
Following our analysis of speculators’ positioning in the ETH derivatives markets just prior to The Merge, today we will look at the health of the Ethereum network following the move to PoS, across various metrics to paint a broad picture of the on-chain situation of the industry’s second-largest cryptocurrency.
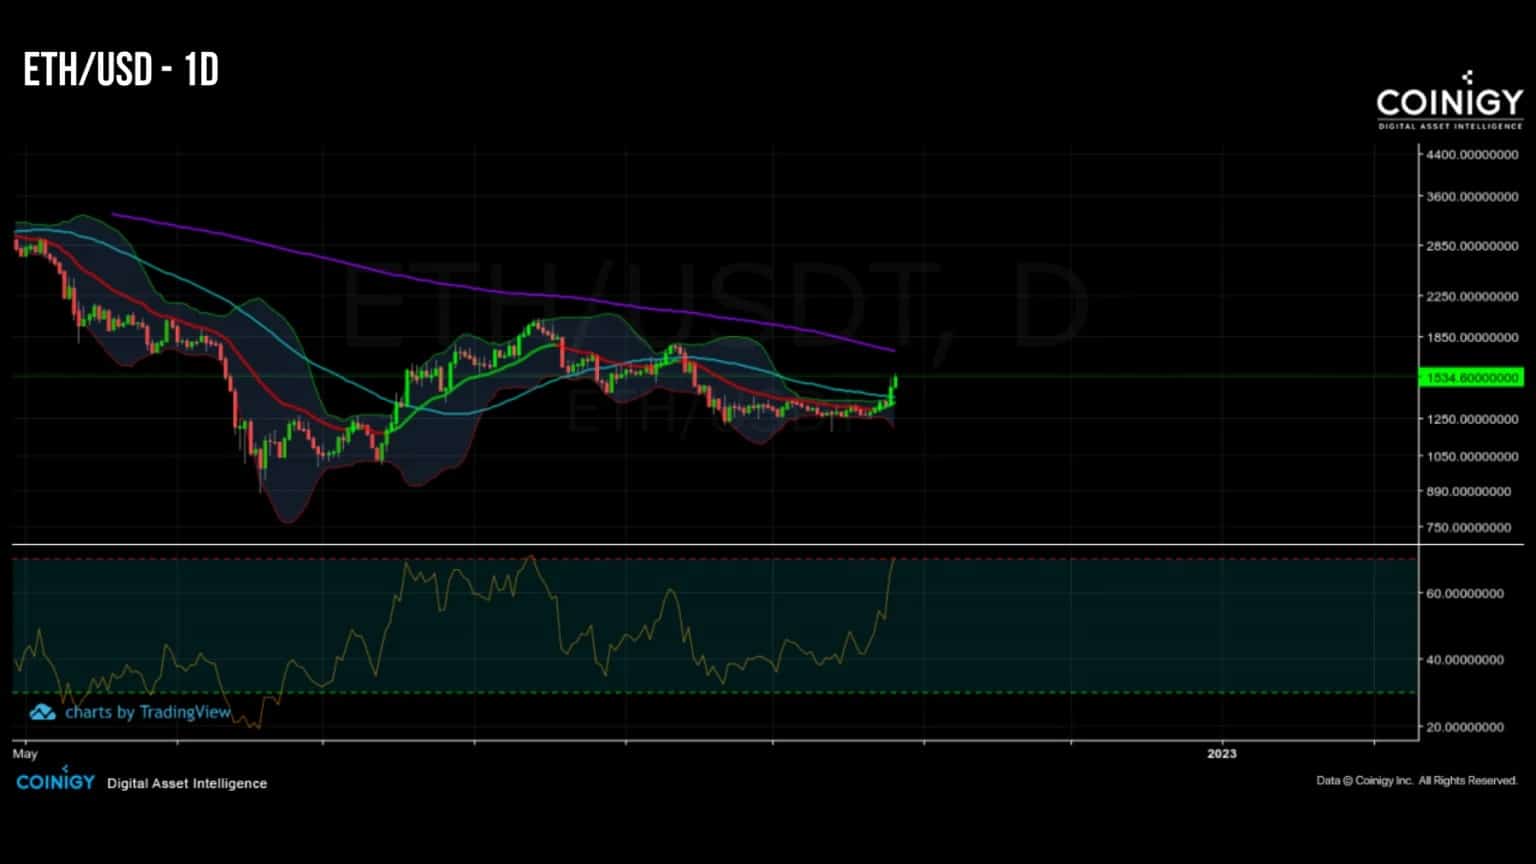
Figure 1 – Daily ETH price
Today we will look at:
- On-chain activity and validator engagement;
- The financial health of ETH 2.0 custodians.
Post-Merge on-chain activity relatively lacklustre
On September 15, 2022, at block 5,537,393, the last PoW block on the Ethereum network was mined and the Beacon Chain took control of the chain consensus.
Ethereum’s The Merge update was successful and resulted in the collapse of the PoW fundamentals of the chain.
The following graph illustrates this point by highlighting the sudden descent into hell of the Ethereum network’s hashrate and mining difficulty metrics after September 15.
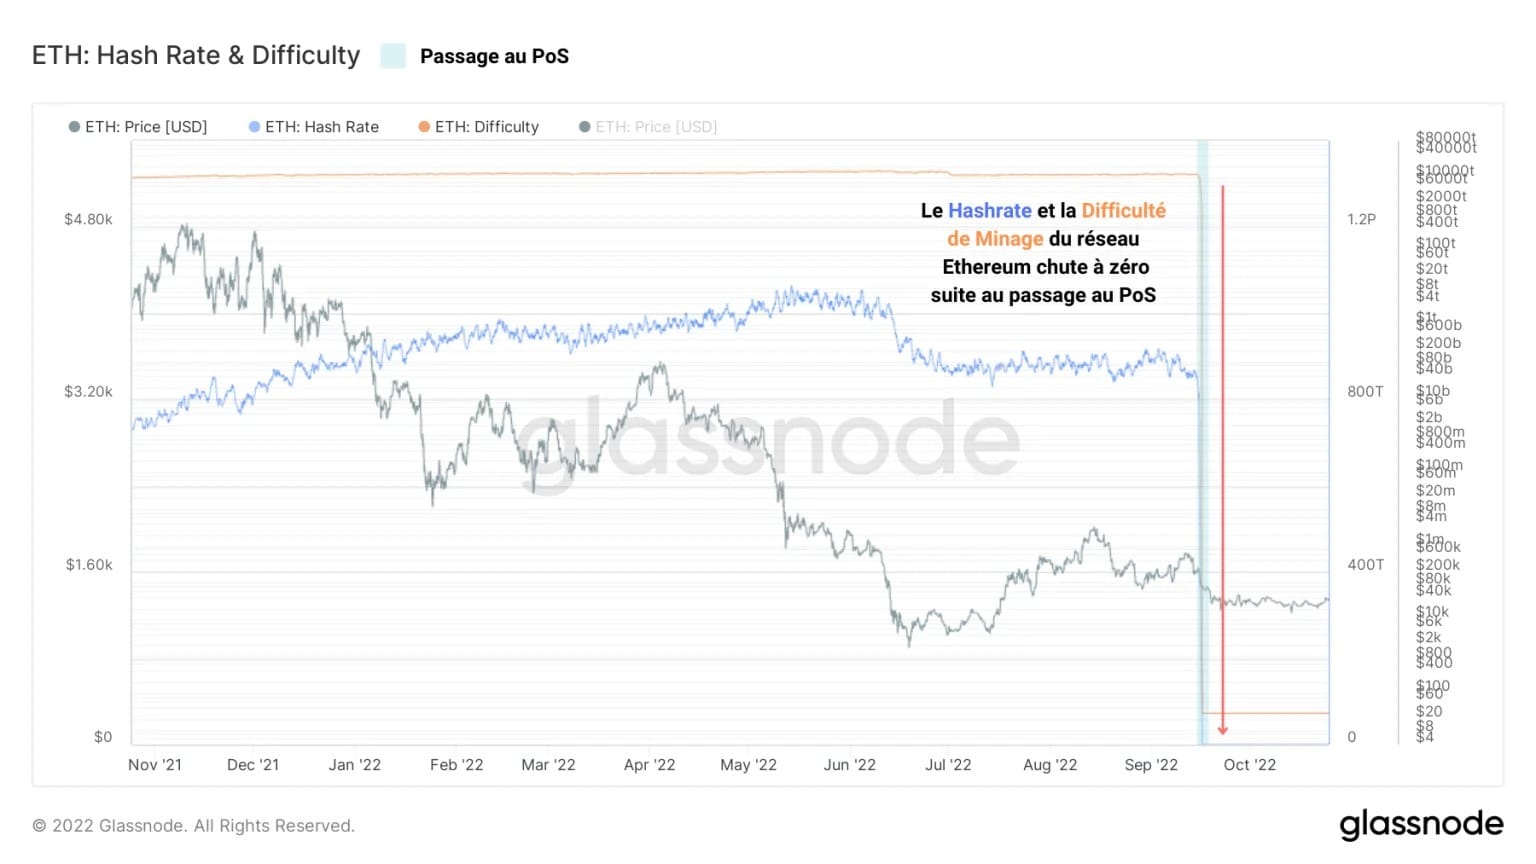
Figure 2 – Ethereum hashrate and mining difficulty
One era ends and another begins, welcome to Ethereum 2.0 and its Proof of Stake consensus algorithm, which we will continue to observe and analyse on Cryptoast.
In response to these events, the Ethereum blockchain’s demand contracted slightly, reaching an hourly transaction rate of nearly 43k transactions.
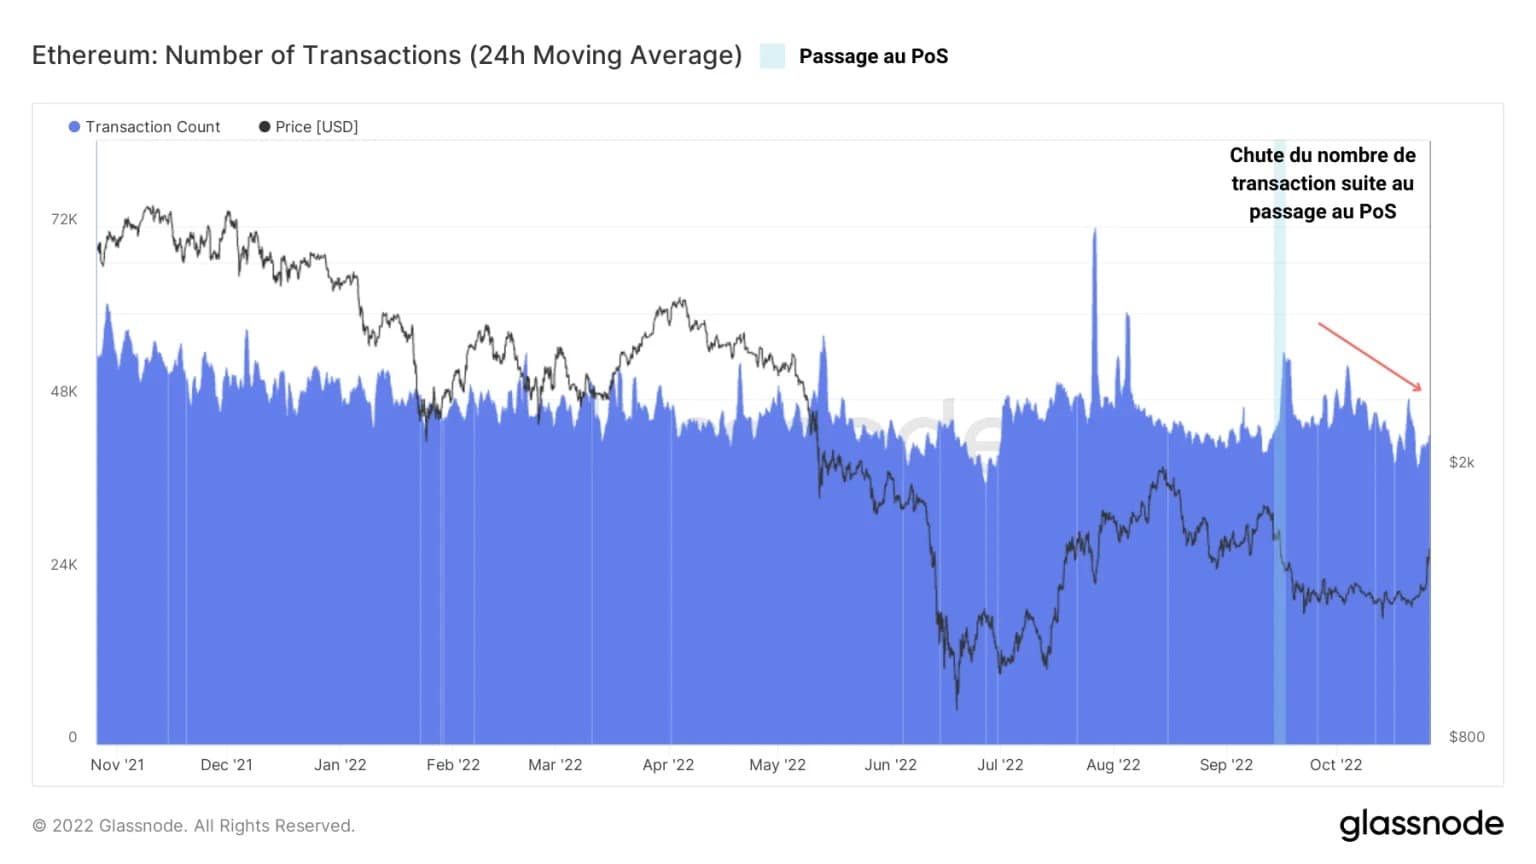
Figure 3 – Number of transactions
This drop, also visible through the active address metric, indicates a certain caution on the part of Ethereum users, who limit their interaction with the protocol for various reasons:
- Investor wariness following the strong bearish bias in ETH derivatives markets;
- The pausing of some economic activity while waiting to observe the potential adverse effects of The Merge;
- The bear market environment, causing investors to adopt conservative behaviour by limiting risk.
Corroborating this observation, the volume of transfers on the Ethereum chain has also dropped significantly, indicating a low level of commitment from users of the network.
It should be noted, however, that current values remain anchored in the conventional averages of bear market activity. This decline, although circumstantial, should not be over-interpreted.
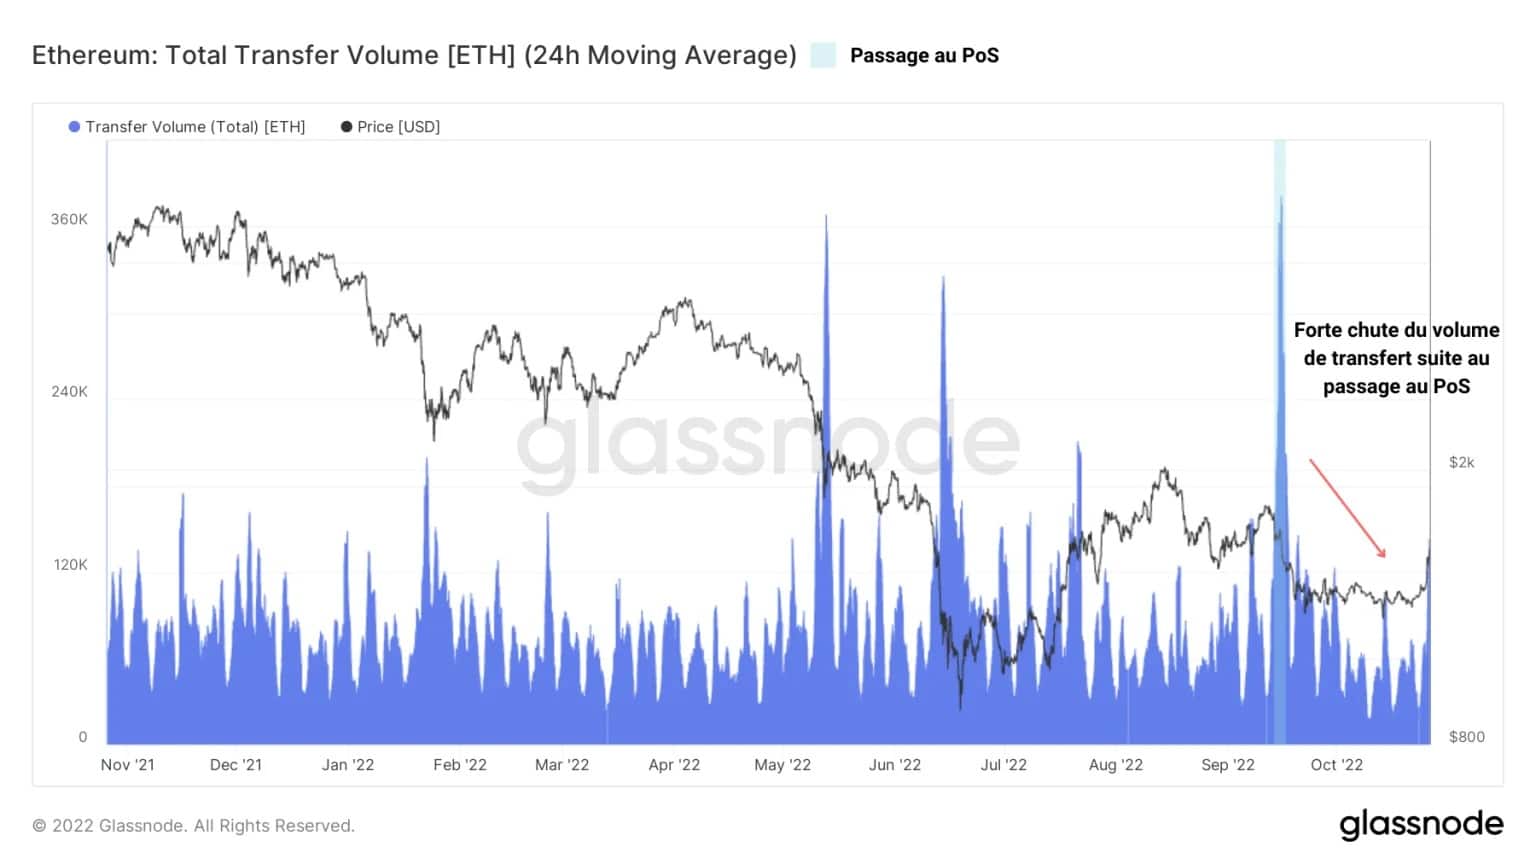
Figure 4 – Transfer volume
A positive signal could be to see measures of chain usage and on-chain commitment push up, in conjunction with a recovery in the ETH price.
This would signal that market price relief would provide new traction attracting users and investors again, ultimately pushing adoption to new heights.
Finally, the participation rate, a metric exclusive to ETH 2.0, which is the ratio of the number of successfully produced (i.e. not missed) blocks to the total number of available slots, signals a drop in validator engagement.
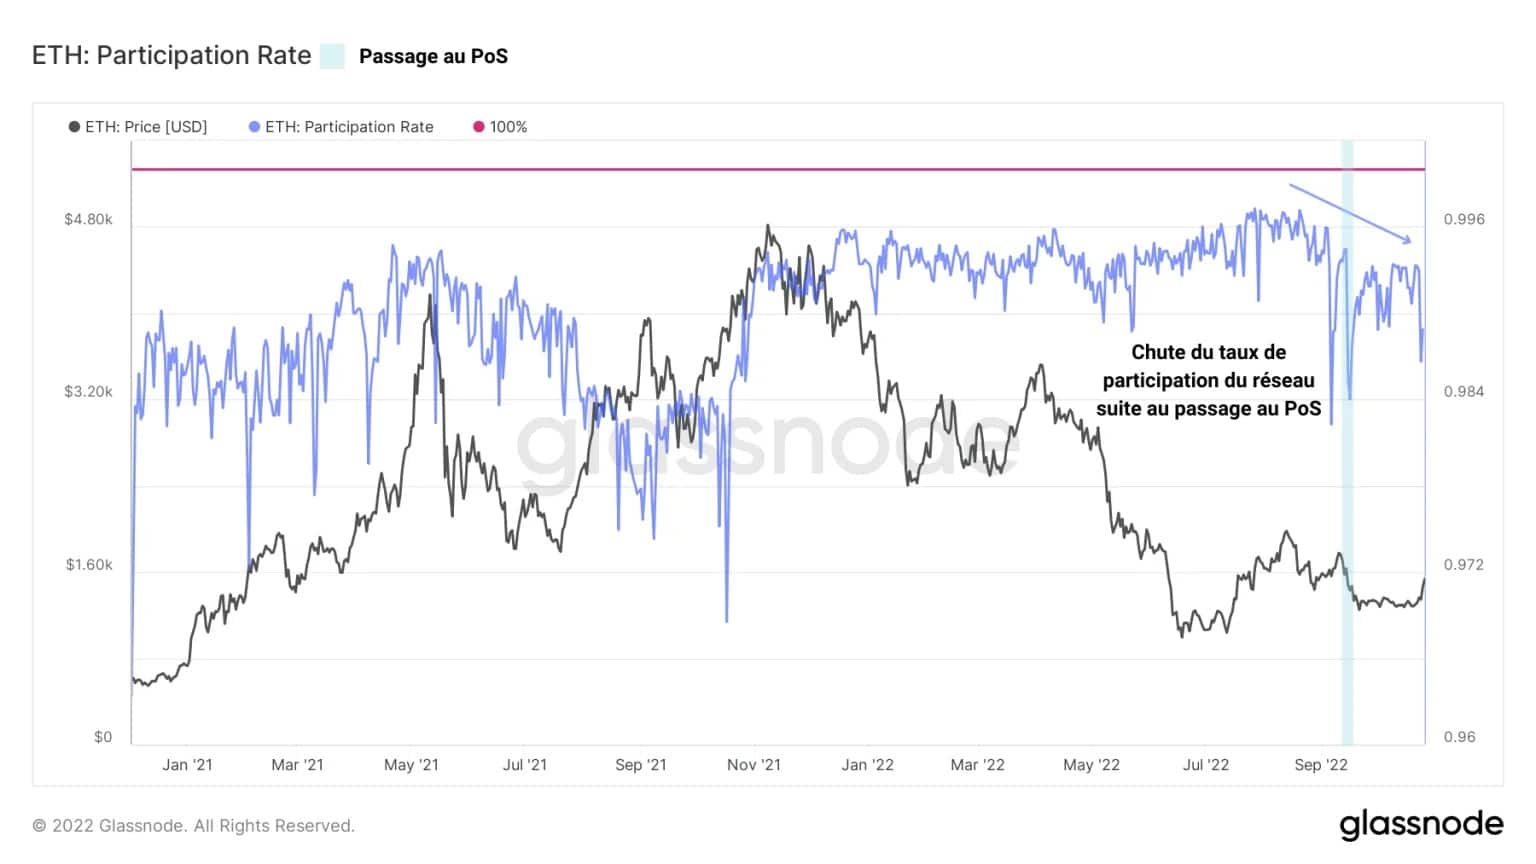
Figure 5 – Validator participation rate
Resulting in an increase in the number of missed blocks, this metric reflects the decline in activity of a portion of validators following Ethereum’s transition to PoS.
This signal of fundamental degradation is not welcome, but is not a definitive finding.
Decreasing performance & ETH 2.0 custodians under water
Meanwhile, the evolution of the number of active validators continues to grow, now standing at nearly 450k. While this is constructive at first glance, it is also a sign of increased competition for rewards.
Potentially driving validators to turn to performance optimisation solutions such as Flashbots’ MEV-boost to maximise their performance
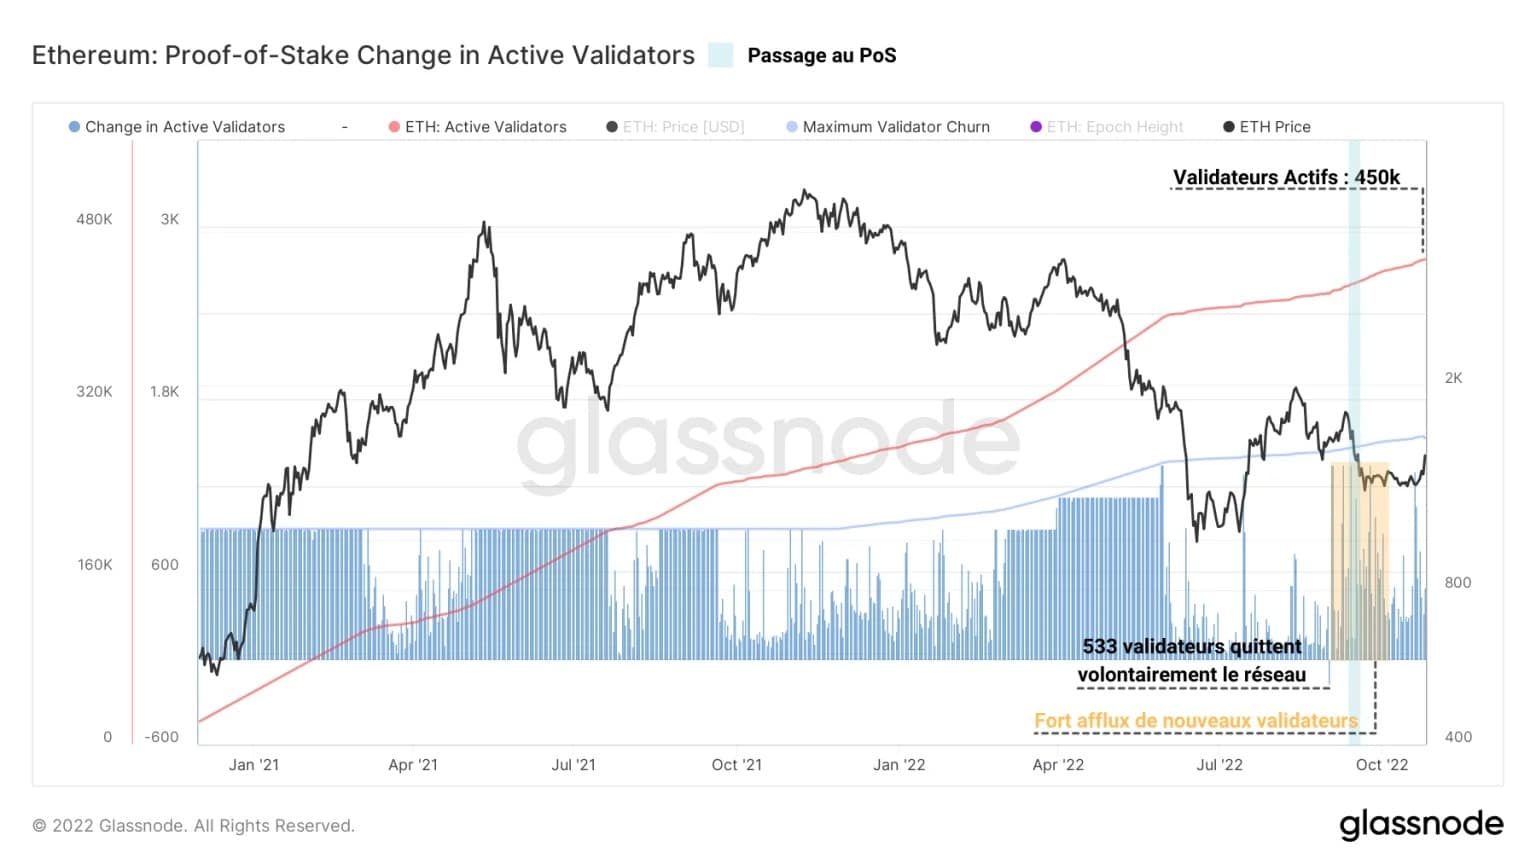
Figure 6 – Active validators
Note that a strong influx of validators was recorded around The Merge event, signalling operators’ interest in participating in the ETH 2.0 consensus building.
Illustrating the competitive dynamics for yield experienced by Ethereum network validators since the Beacon Chain went live, the following graph shows the estimated annual yield of these entities.
It is striking to note that this metric has been divided by almost 7 since the end of 2020, going from an annual yield of 21% to just over 4% currently.
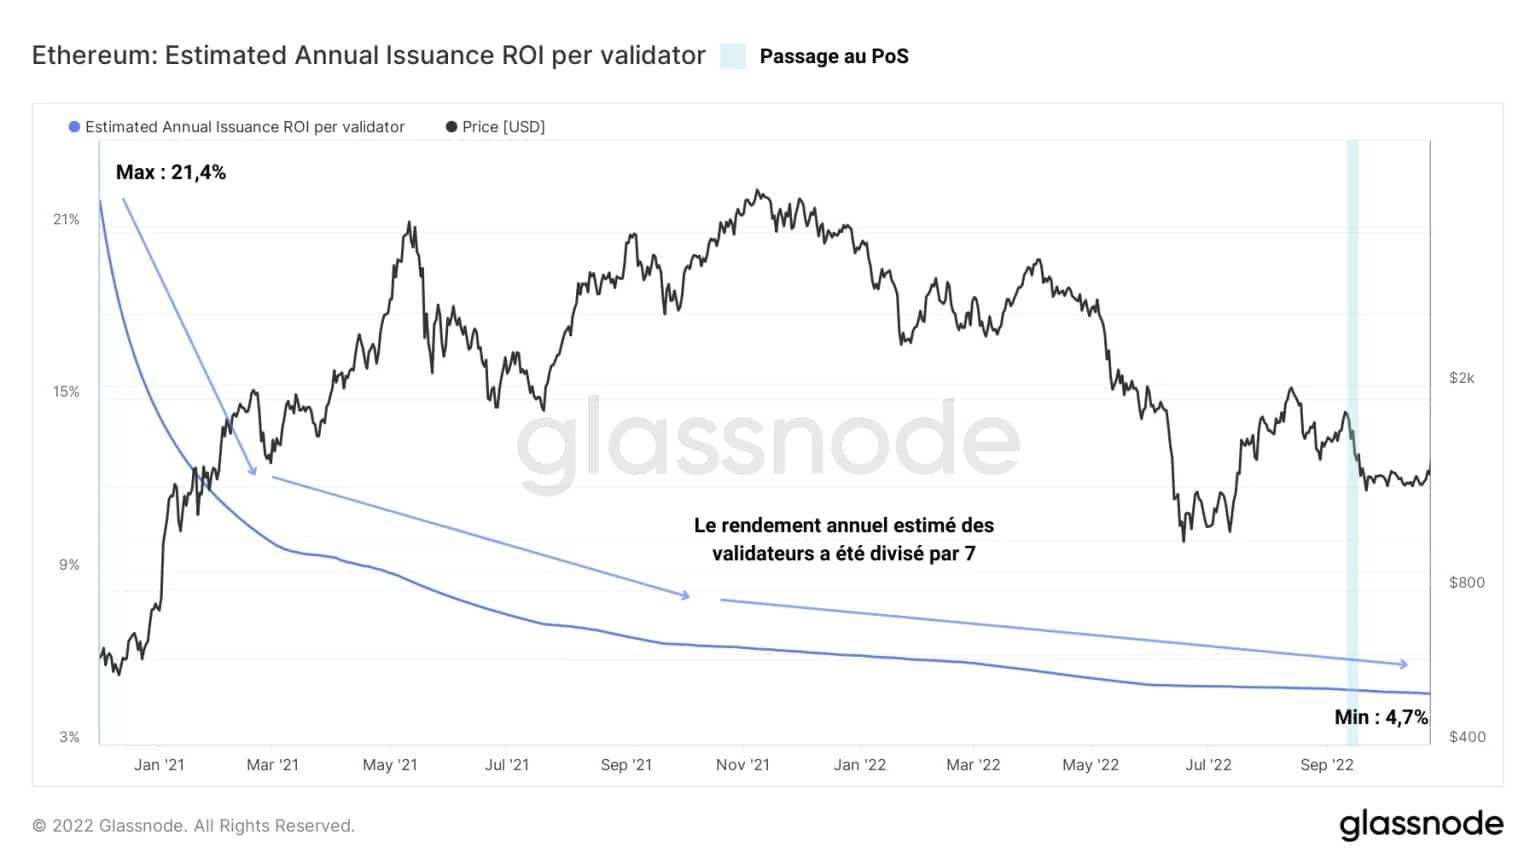
Figure 7 – Estimated annual yield of validators
This dynamic is an additional catalyst that can push Ethereum node operators to favour optimisation and block selection solutions containing the highest transaction fees.
In addition, custodians of the ETH 2.0 contract are currently covering a persistent unrealized loss. By measuring the price at which ETH have been locked into the ETH 2.0 contract, it is possible to calculate the aggregate realised price of ETH 2.0 custodians.
Currently sitting near $2200 and therefore higher than the spot price, it indicates that the value of ETH at the time of deposit is lower than the current Ether price, signalling an unrealised loss of around 30% for the average depositor.
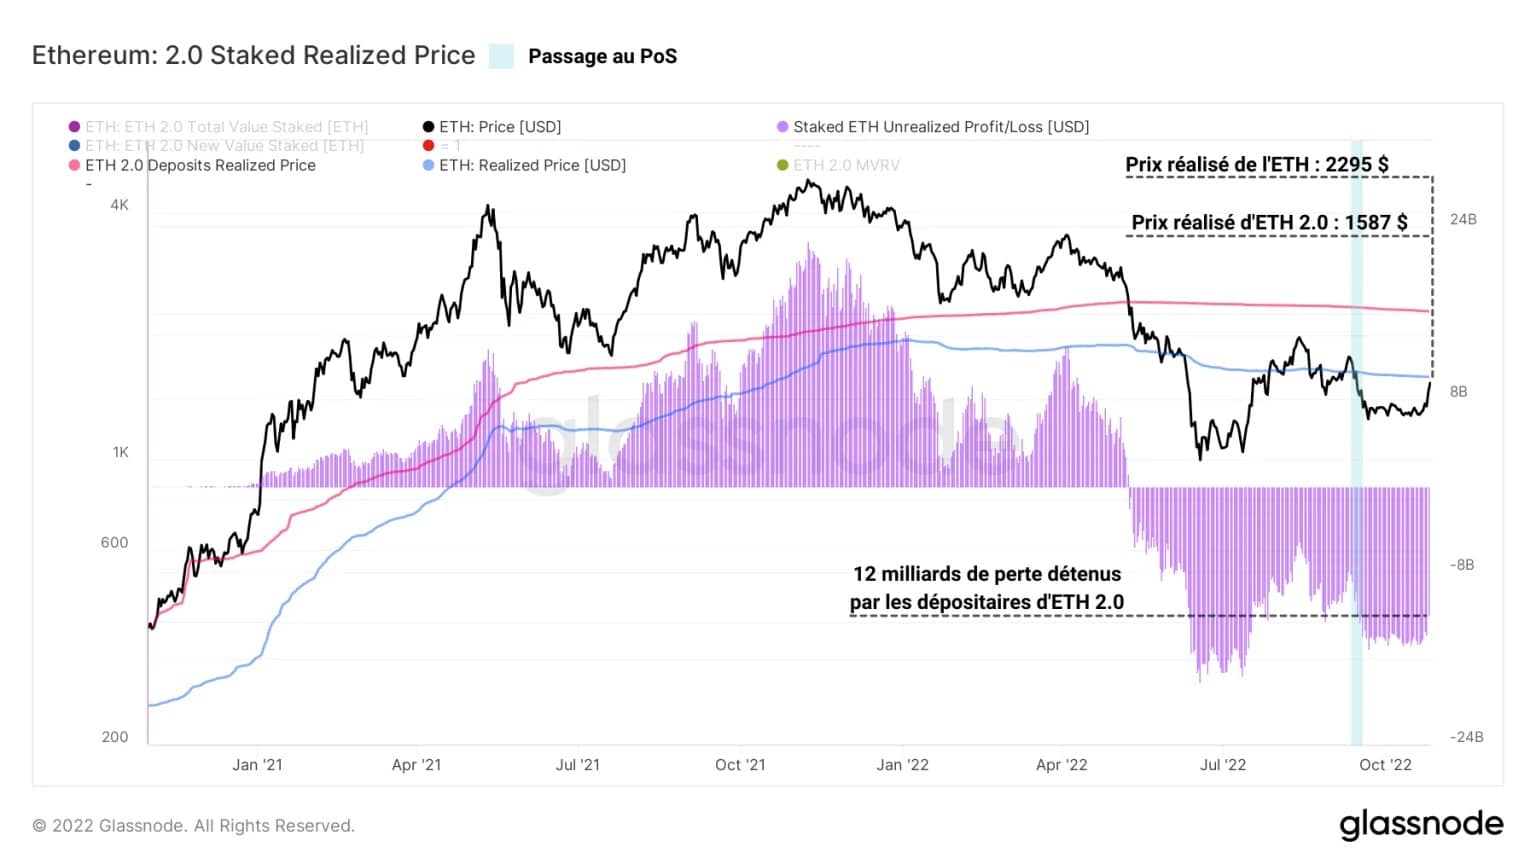
Figure 8 – ETH 2.0 Depositor Profit/Loss
In conclusion, it should be noted that, following the recent increase in the spot price of ETH, the latter is approaching the realised price, representing the overall cost base of ETH circulating on the network.
If the spot price breaks out of this on-chain level to the upside, it would signal a return to overall market profitability, which would be a very constructive recovery signal in the medium term.
Summary of this on-chain analysis
Finally, the on-chain data presented this week indicates that following The Merge, the Ethereum network has successfully implemented the Proof of Stake (PoS) consensus algorithm and that the Beacon Chain has been hosting on-chain traffic for the second largest cryptocurrency in the market with flying colours.
Measures of on-chain activity and validator responsiveness indicate a decline in engagement and usage of the chain, a less than encouraging signal but one influenced by the deleterious bear market environment and deteriorating macroeconomic components.
In addition, it appears that the declining annual return on validators and the negative profitability of locked-in deposits in the ETH 2.0 contract are putting significant financial pressure on participants, which could be partially alleviated if the spot price of Ether rises above the realised price of the ETH market.
