
Following speculators’ overexposure to risk, the Bitcoin (BTC) market performed a new leverage purge, resulting in a cascade of long order liquidations. Coming from the derivatives markets, the selling pressure quickly triggered a series of stop loss orders in the spot markets. On-chain analysis of the situation
Bitcoin invalidates $53,000
Last Saturday, the Bitcoin (BTC) price experienced another round of sell-offs, leading the market to plunge below the $53,000 support.
Following a brief bout of volatility, the price recovered to the $50,000 level, printing a new weekly low of $49,054.
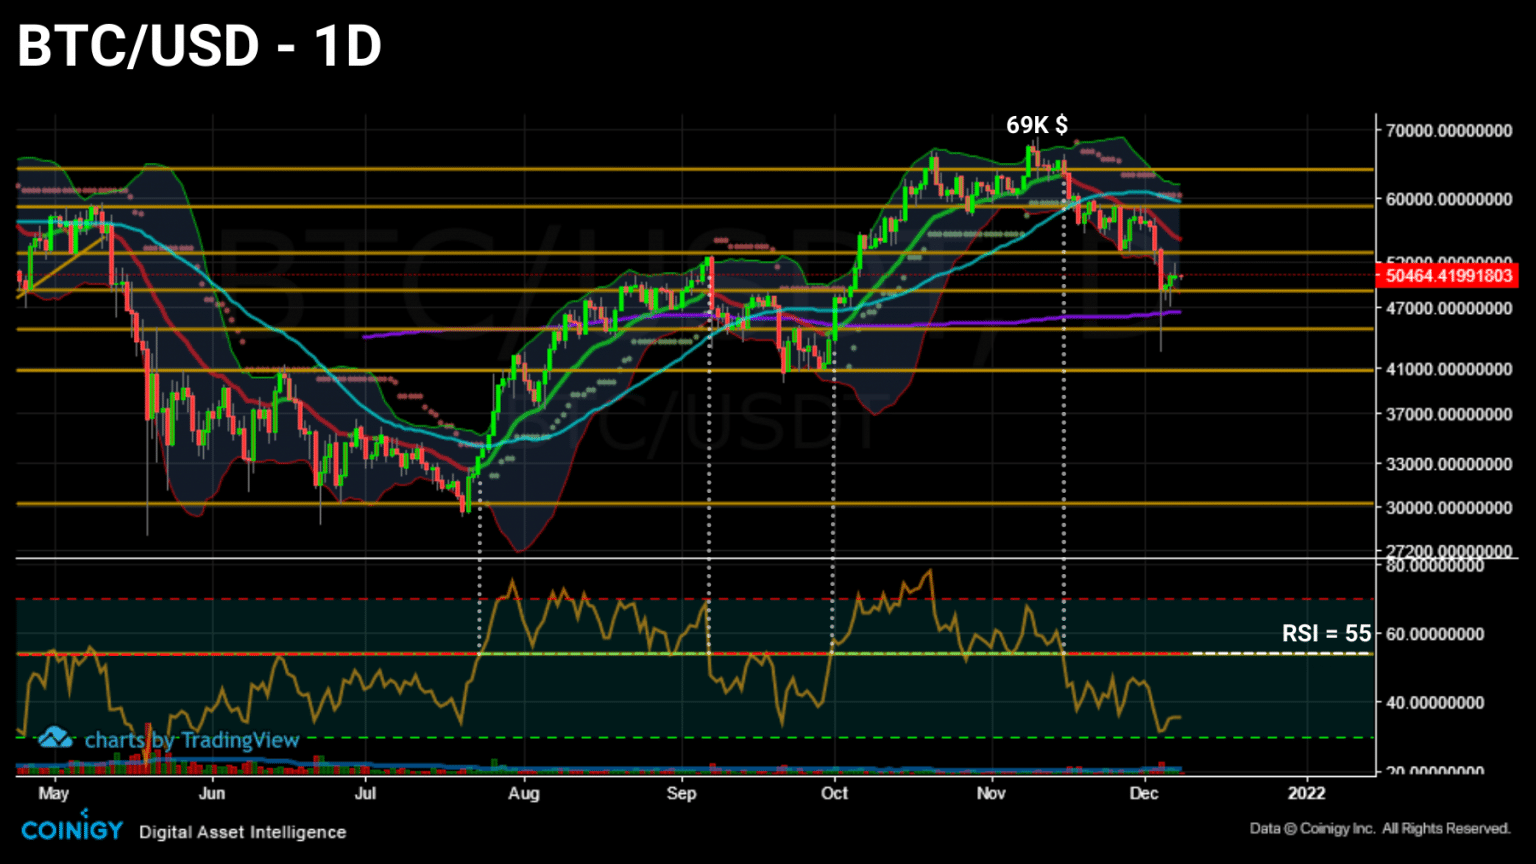
Daily Bitcoin (BTC) price chart (Source: Coinigy)
In doing so, BTC has moved through a low-volume area, increasing volatility due to weak downside resistance
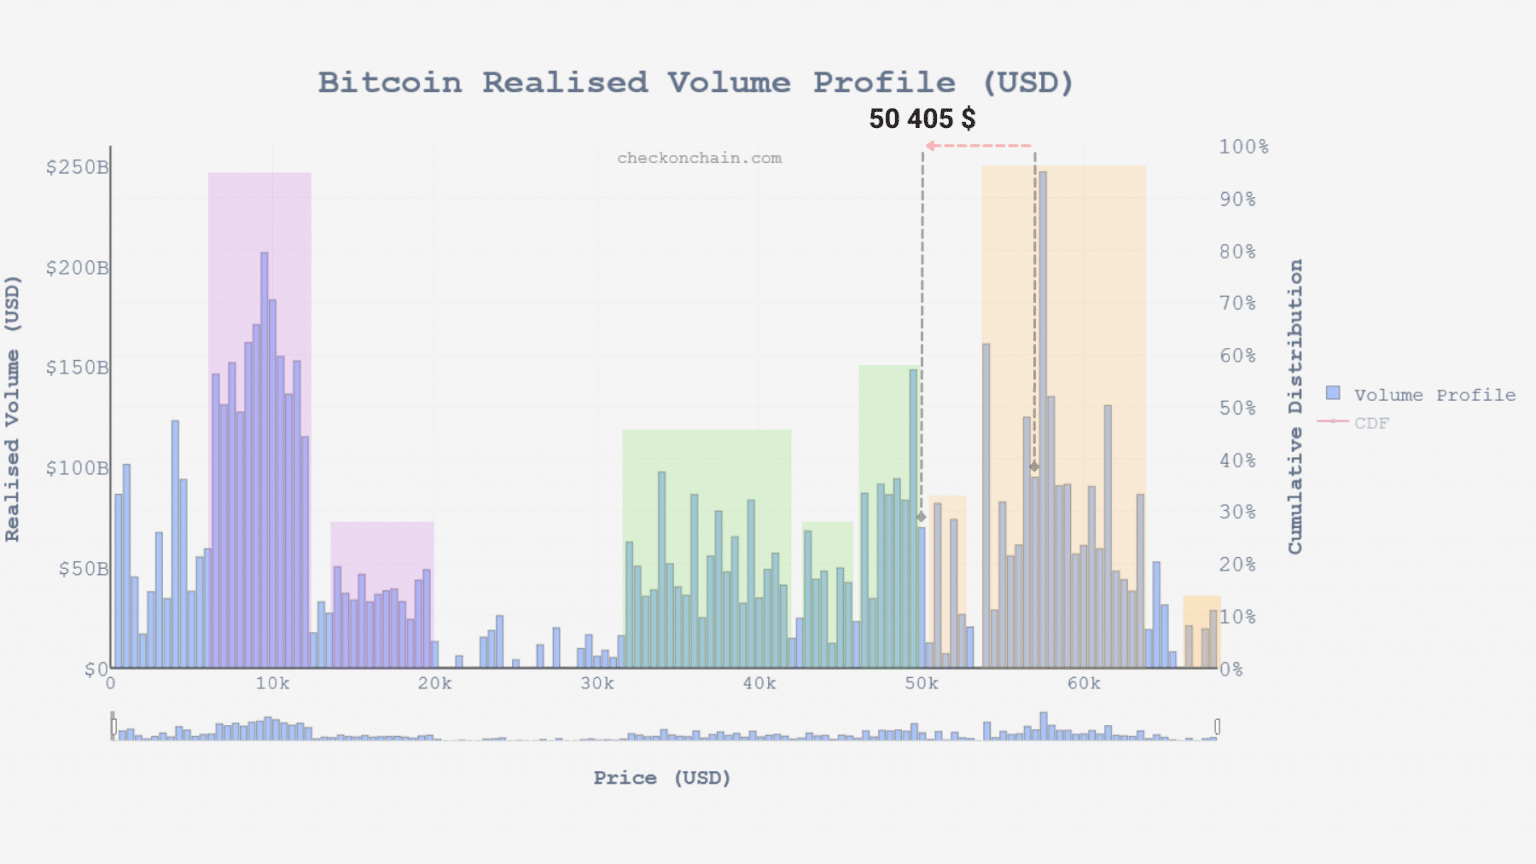
Realized volume chart of bitcoin (BTC) (Source: checkonchain.com)
This week, we will take an in-depth look at the impact of this correction on the overall market and determine what signs of recovery to expect in order to maintain a healthy uptrend.
Purge in derivatives markets
Let’s begin this analysis by looking at the derivatives markets, which were the major triggers for this correction.
Following the overexposure of speculators to risk, the market performed a new leverage purge, resulting in a drastic drop in funds allocated to future contracts.
In less than three days, $5.7 billion was removed from the wallets of players hoping for a rebound in the bitcoin price to the $53,000 level
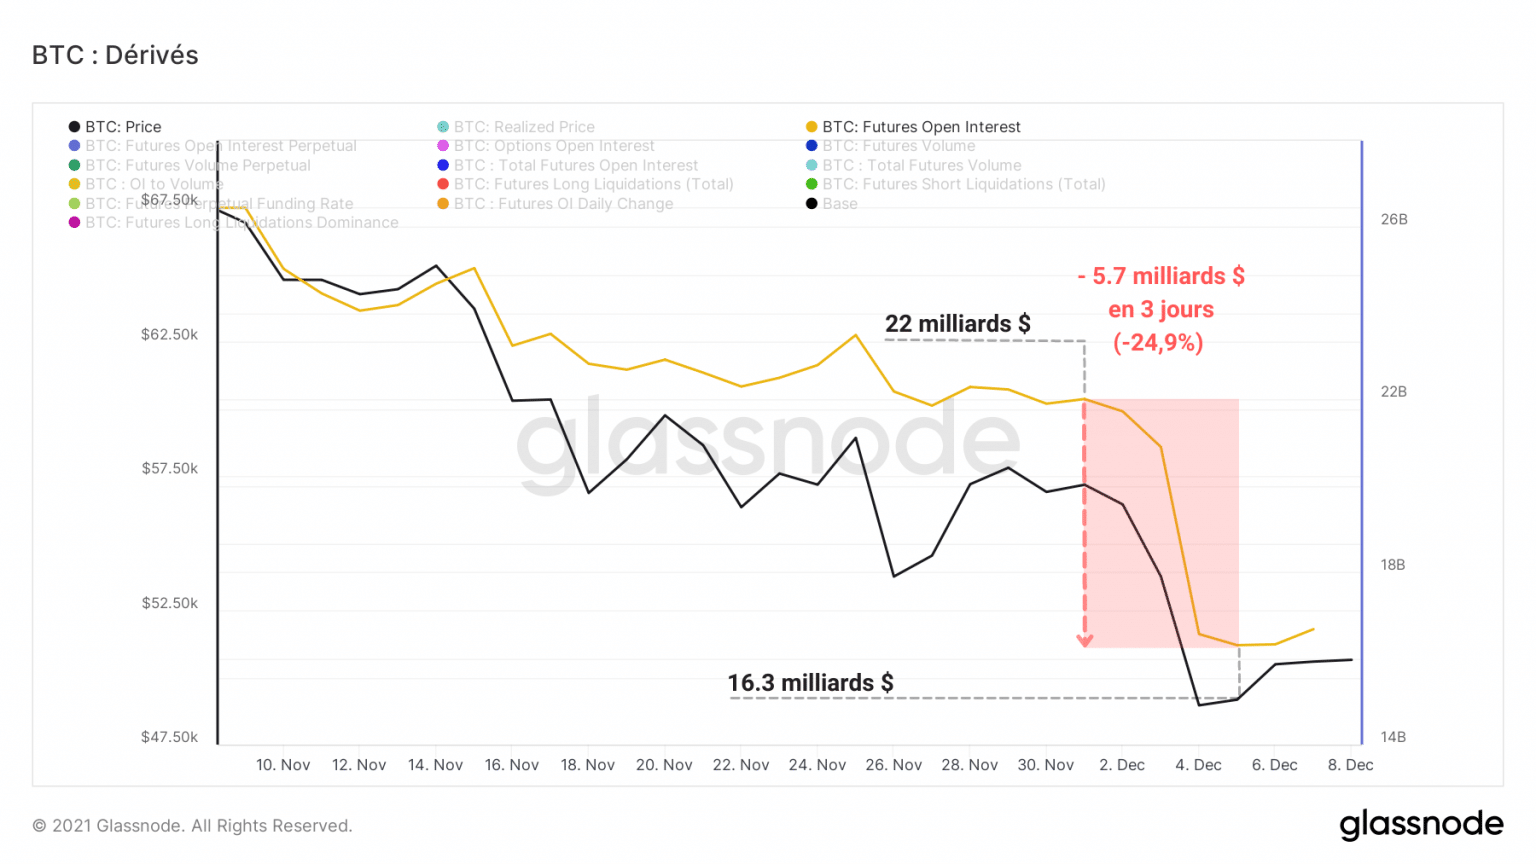
Bitcoin (BTC) open interest chart (Source: Glassnode)
Calculating the daily change in open interest, denominated in BTC, it appears that about 64,300 BTC were withdrawn from the derivatives markets on the night of December 3.
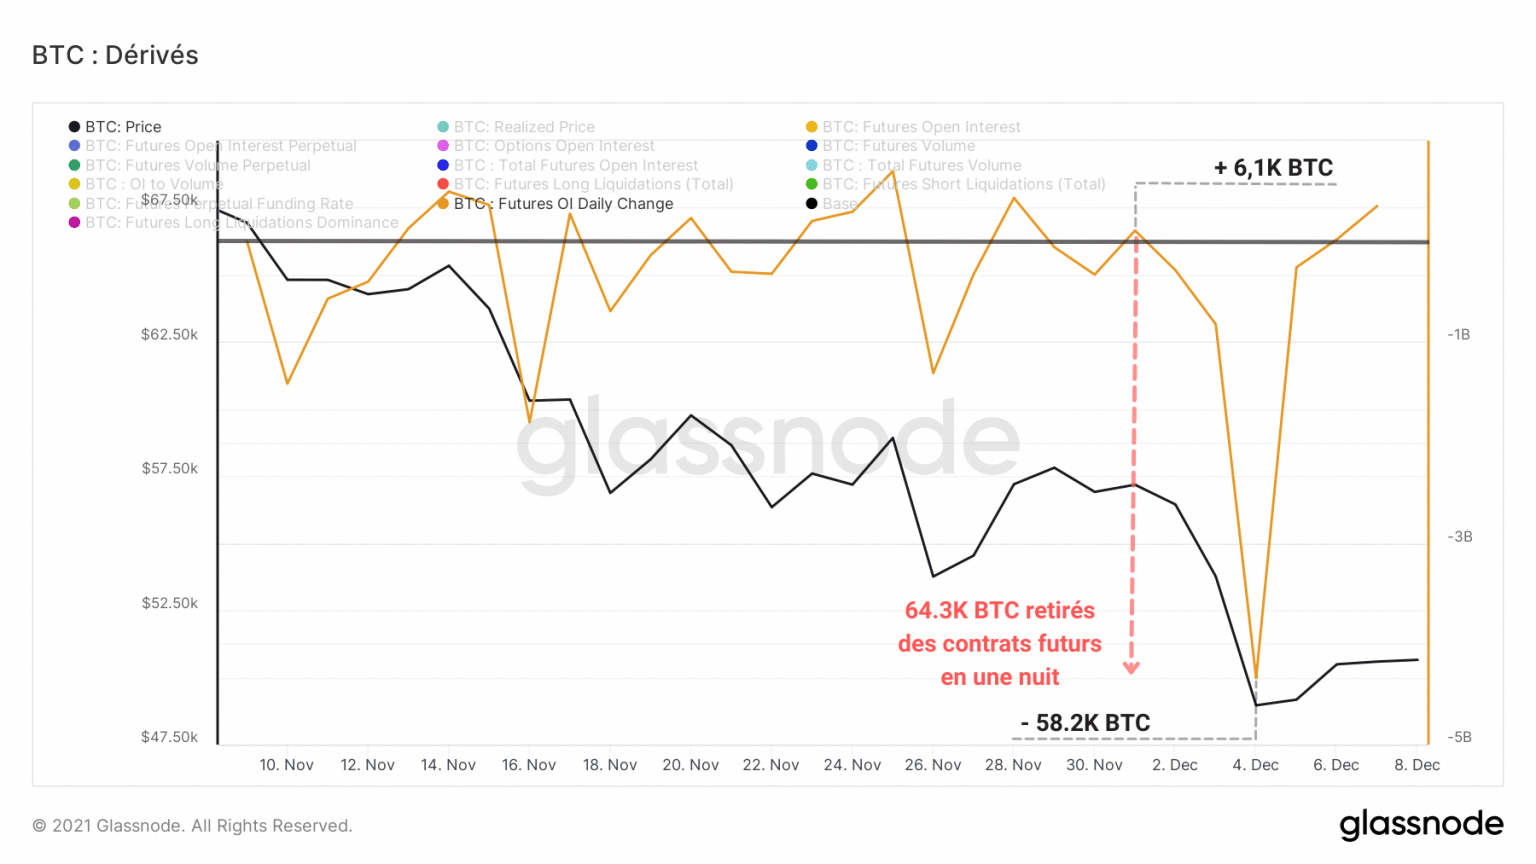
Graph of daily change in bitcoin (BTC) open interest (Source: Glassnode)
As a result of this leverage clean-up, a cascade of liquidations totalling $280 million forced not only derivatives speculators but also some spot market players to close their positions, putting strong selling pressure on the BTC price.
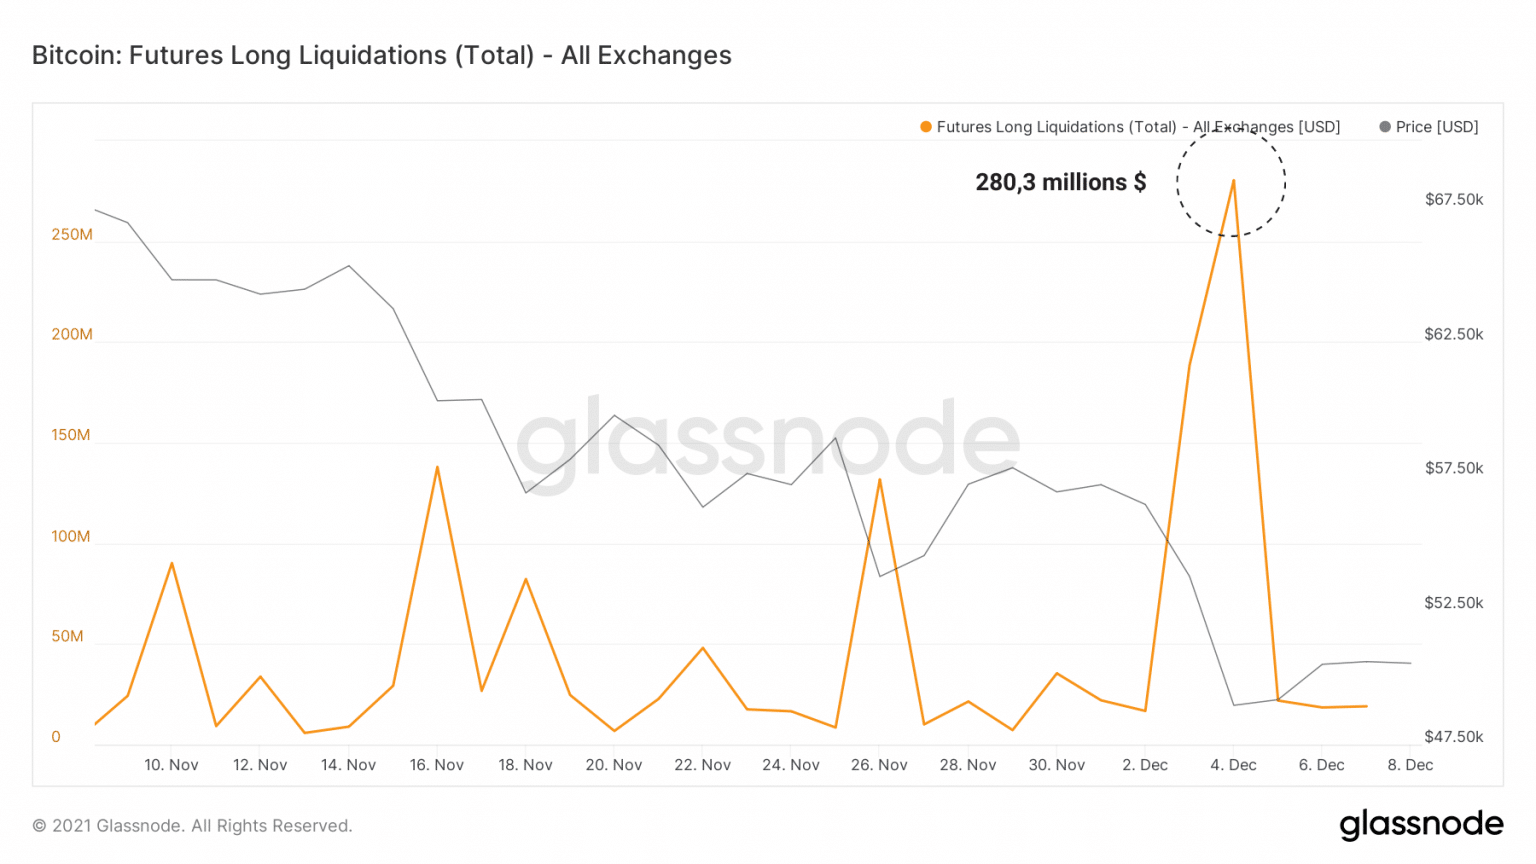
Chart of Bitcoin (BTC) long order liquidations (Source: Glassnode)
Reflecting the magnitude of this purge, the dominance of long order liquidations reached 98.2% on the downside, a sign that entities positioned on the upside suffered heavy damage.
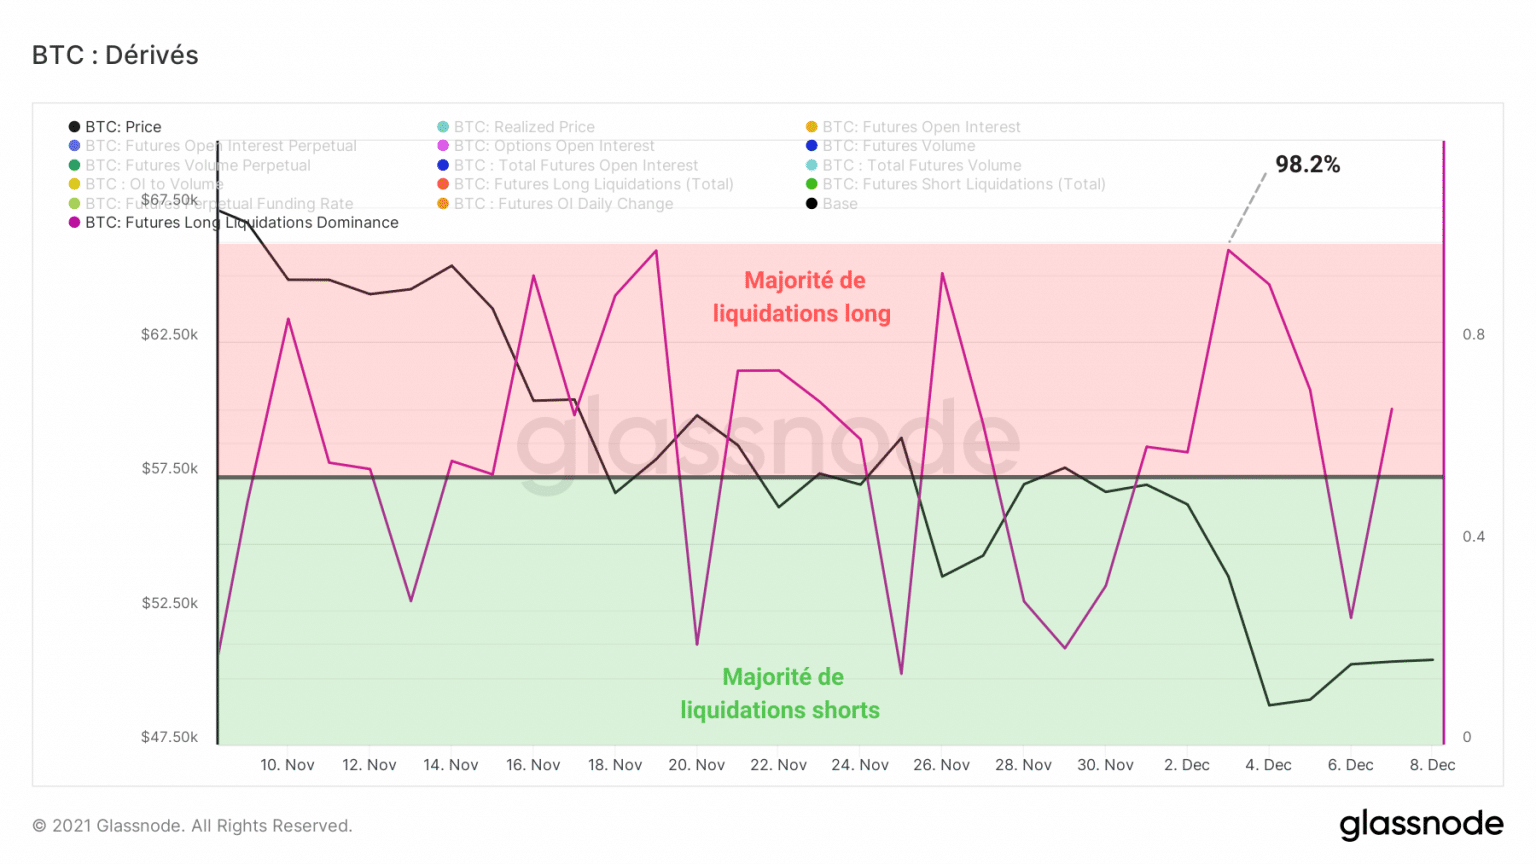
Chart of Bitcoin (BTC) long liquidation dominance (Source: Glassnode)
This was followed by the impression of a negative funding rate for perpetual futures (by which we mean that these contracts have no expiration limit).
The first red day since the end of September, it indicates that the derivatives markets adopted a bearish bias in the hours following the correction.
Ideally, it would be desirable for this indicator to print a slightly positive funding rate in the coming days, indicating a moderate return to long positioning by speculators.
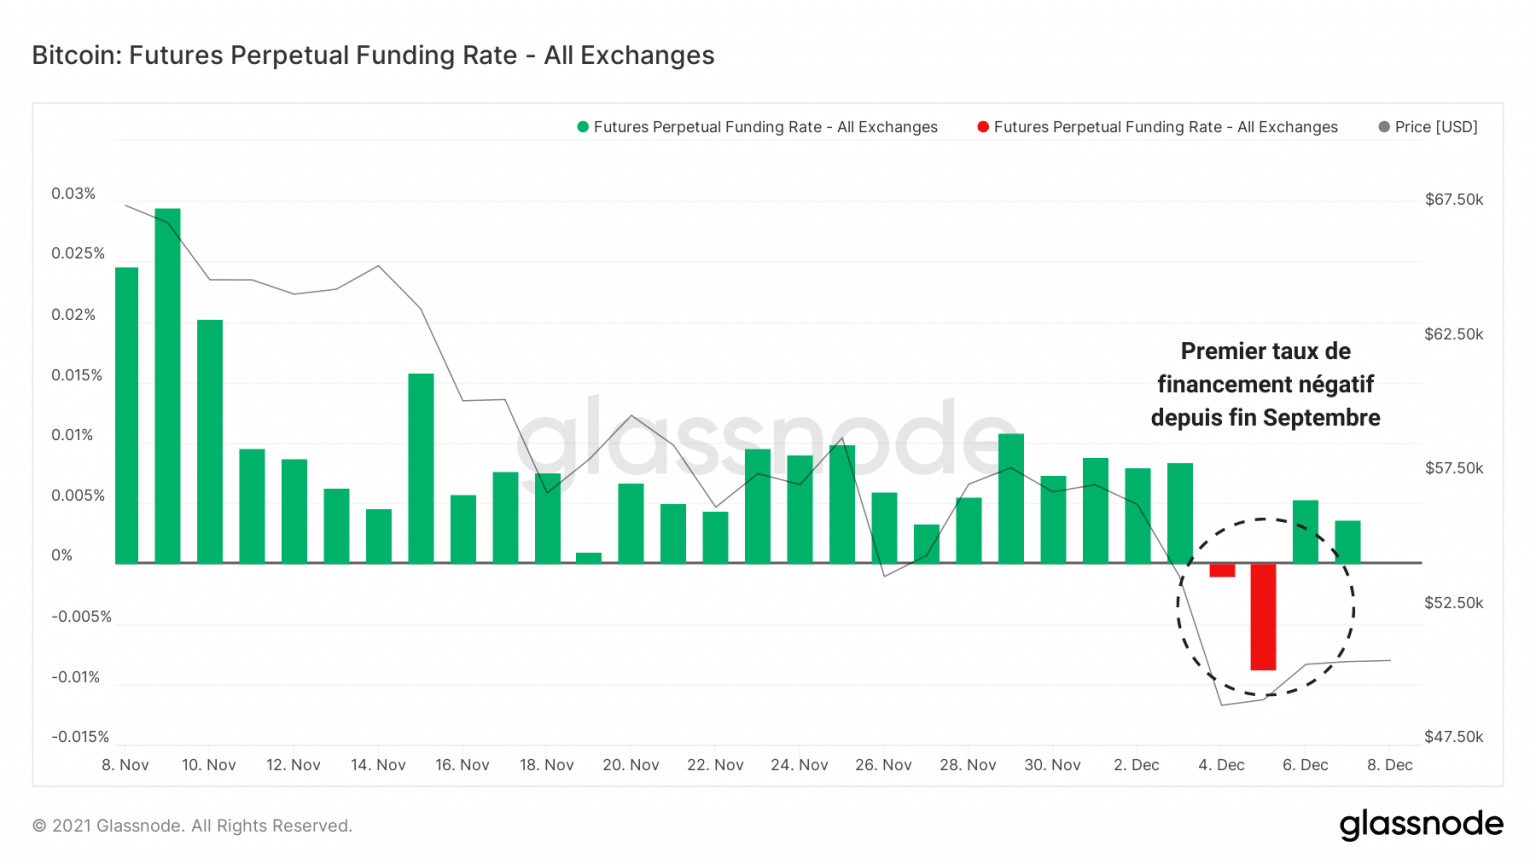
Bitcoin (BTC) Perpetual Contract Funding Rate Chart (Source: Glassnode)
Stop loss hunting in spot markets
As mentioned in our previous analysis, the $53,000 level indicated a strong level of technical and on-chain support, constituting both the cost basis for short term holders and the top of the August/September bull run.
Although many expected to see this support defended, insufficient spot demand did not provide the buying pressure necessary to fill the influx of sell orders.
As a result, at the $52,000 level, many stop loss orders were placed by participants to protect themselves from a large capital loss.
Adding to the selling pressure induced by the derivatives markets, these orders pushed the BTC price southwards, triggering further stop losses, resulting in a powerful cascade of sell orders in a low liquidity area.
This situation is clearly observable on the channel, where we can see the increasing curve of losses made by participants.
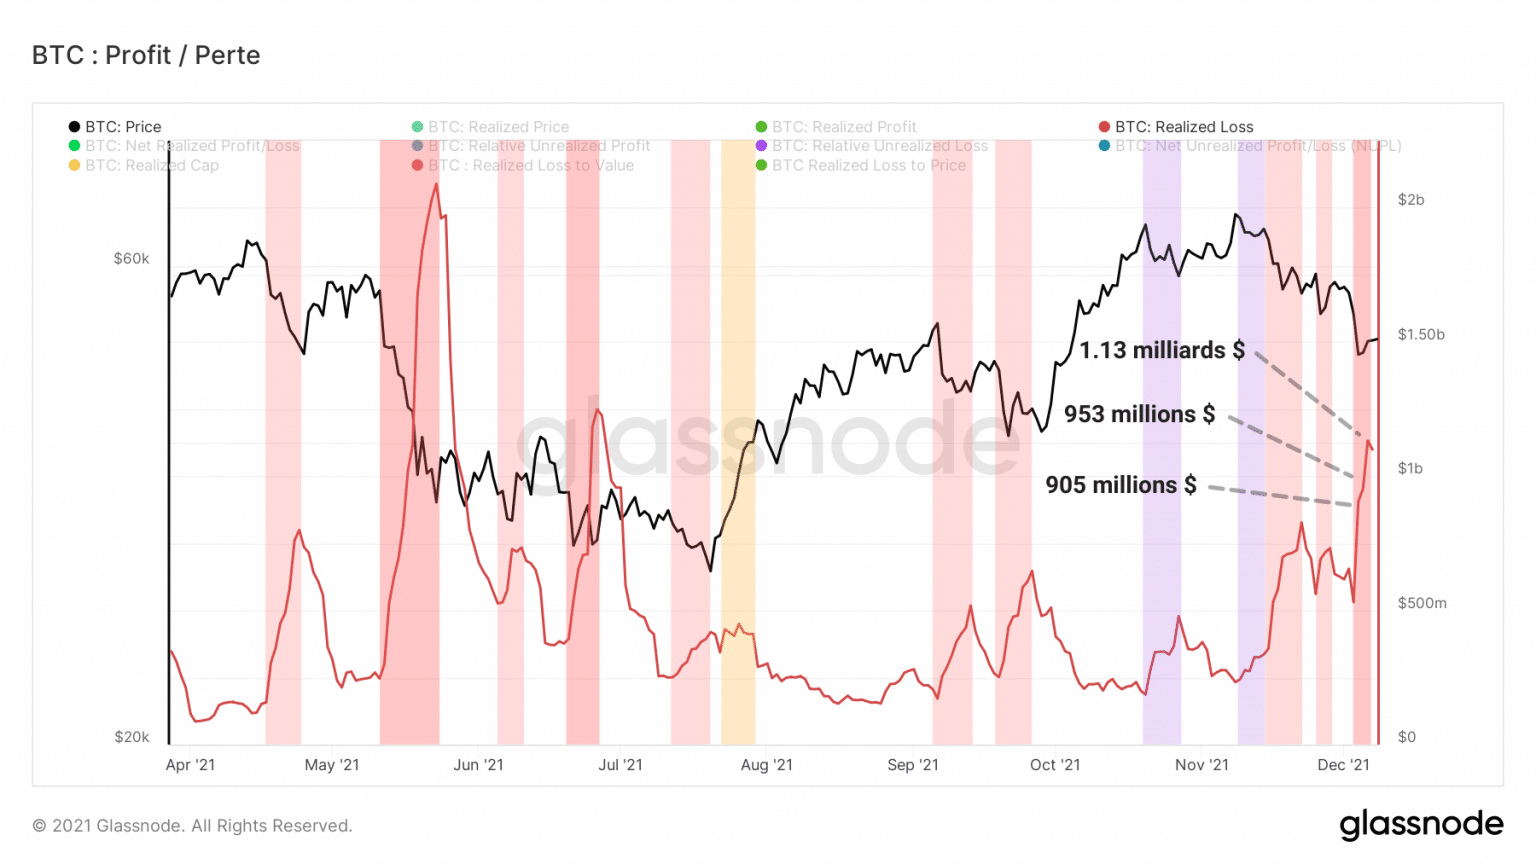
Graph of realised losses of bitcoin (BTC) (Source: Glassnode)
This sustained rise signals that many players voluntarily or forcedly made large losses during the correction, but also when the price stabilised at the $50,000 level.
Taken by surprise by the volatility of the market, many investors, the majority of whom had been holding their chips since November, sold in panic.
In total, more than USD 3 billion in losses were recorded on the spot markets, half that of the derivatives markets.
This is identifiable via the aSOPR, whose below break-even position indicates that recently spent tokens were sold at a moderate loss rate.
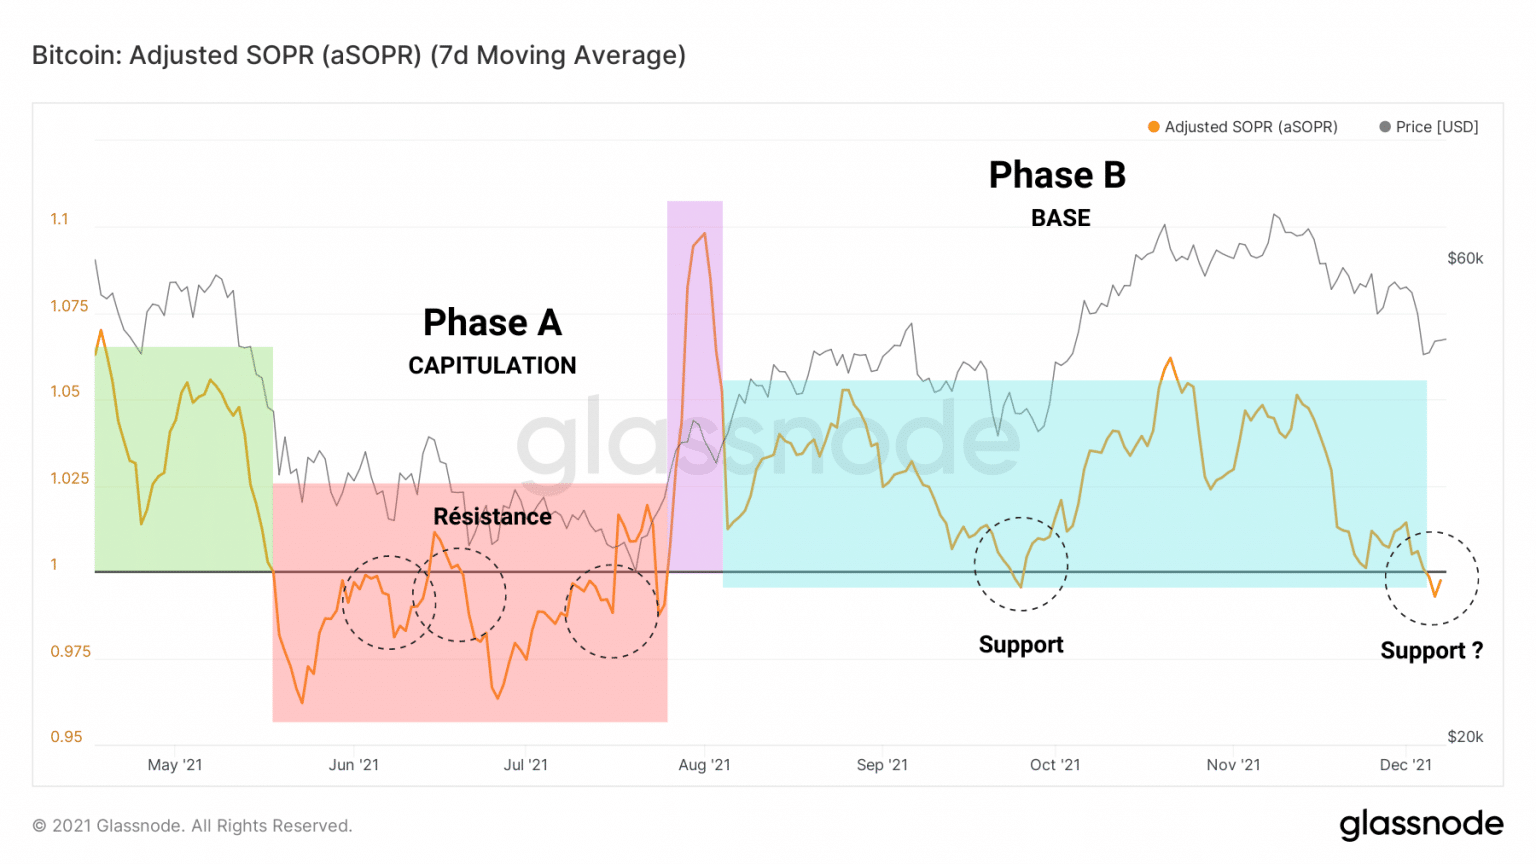
Graph of bitcoin (BTC) aSOPR (Source: Glassnode)
With the value of 1 serving as support during the B phase, it would be desirable to see the aSOPR return to positive values over the next few days in order to maintain an optimistic market sentiment.
However, despite large realised losses, it is still too early to speak of capitulation.
Indeed, the ratio of realised losses to realised market value tells us that the price fall has not caused pain comparable to that of major capitulations such as in March 2020 or May 2021.
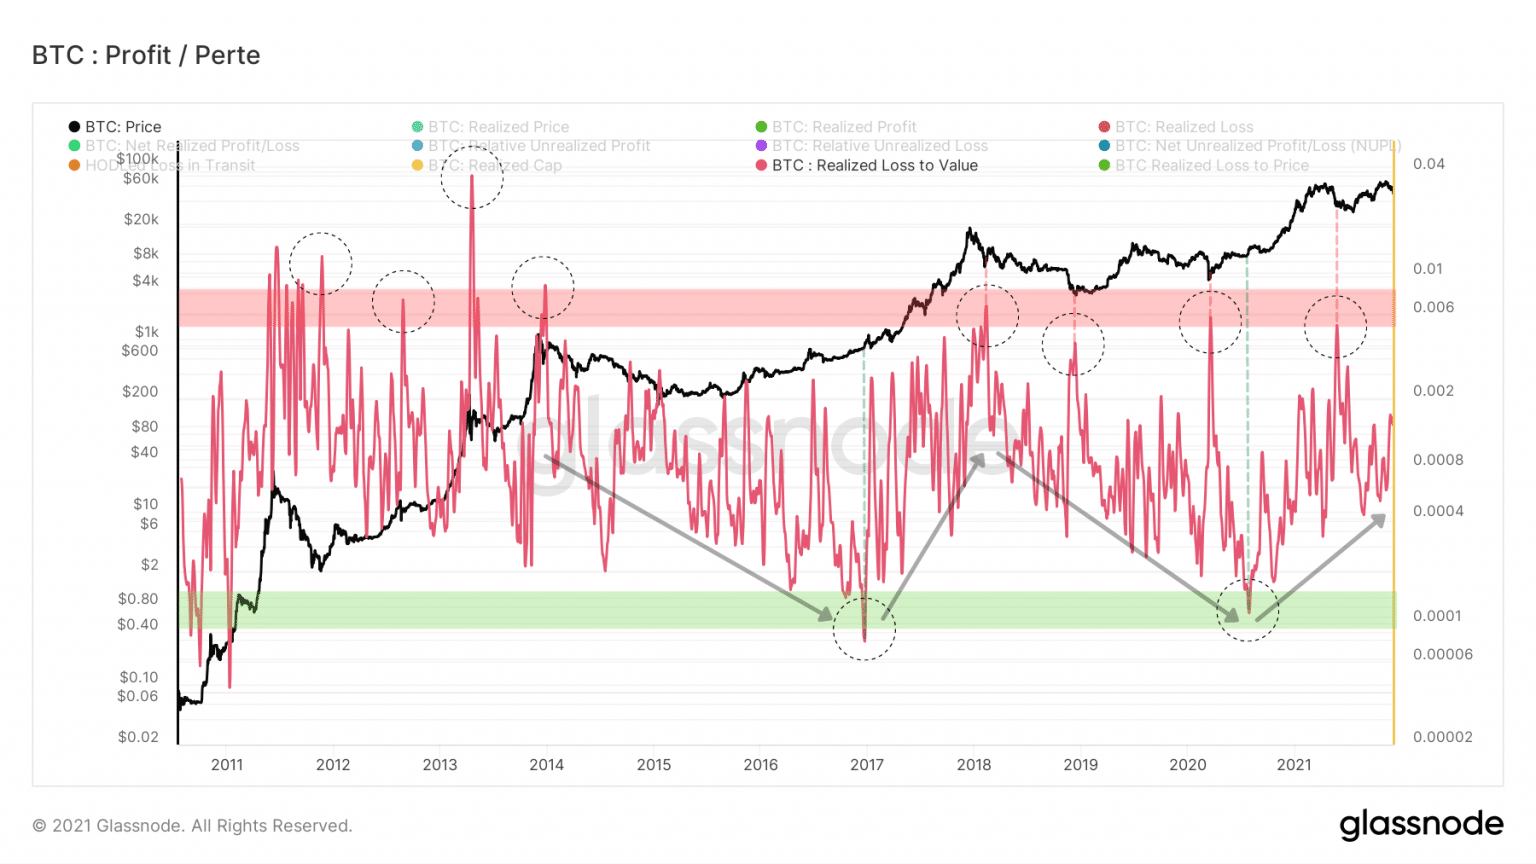
Bitcoin (BTC) RLV ratio chart (Source: Glassnode)
However, as this oscillator has been in an uptrend since the summer of 2020, we may be inclined to believe that strong corrections, of the order of -25% to -40%, are possible in the medium term.
However, this observation does not constitute an immediate selling argument, since corrections of this magnitude occur many times during the markets, without calling into question the overall trend.
Long-term investors are stoic
As expected, LTHs, long term holders, did not flinch. Their conviction prevents them from selling. It takes more than that to scare entities that have been accumulating for several years.
Are they becoming more and more resilient? Certainly, but … It appears curiously that yesterday some of them have all distributed even a fraction of their booty.
Indeed, more than a quarter of the tokens spent on 7 December were between six and twelve months old. This is a significant spend and we will be tracking it in the coming weeks to see if there is a trend or not.
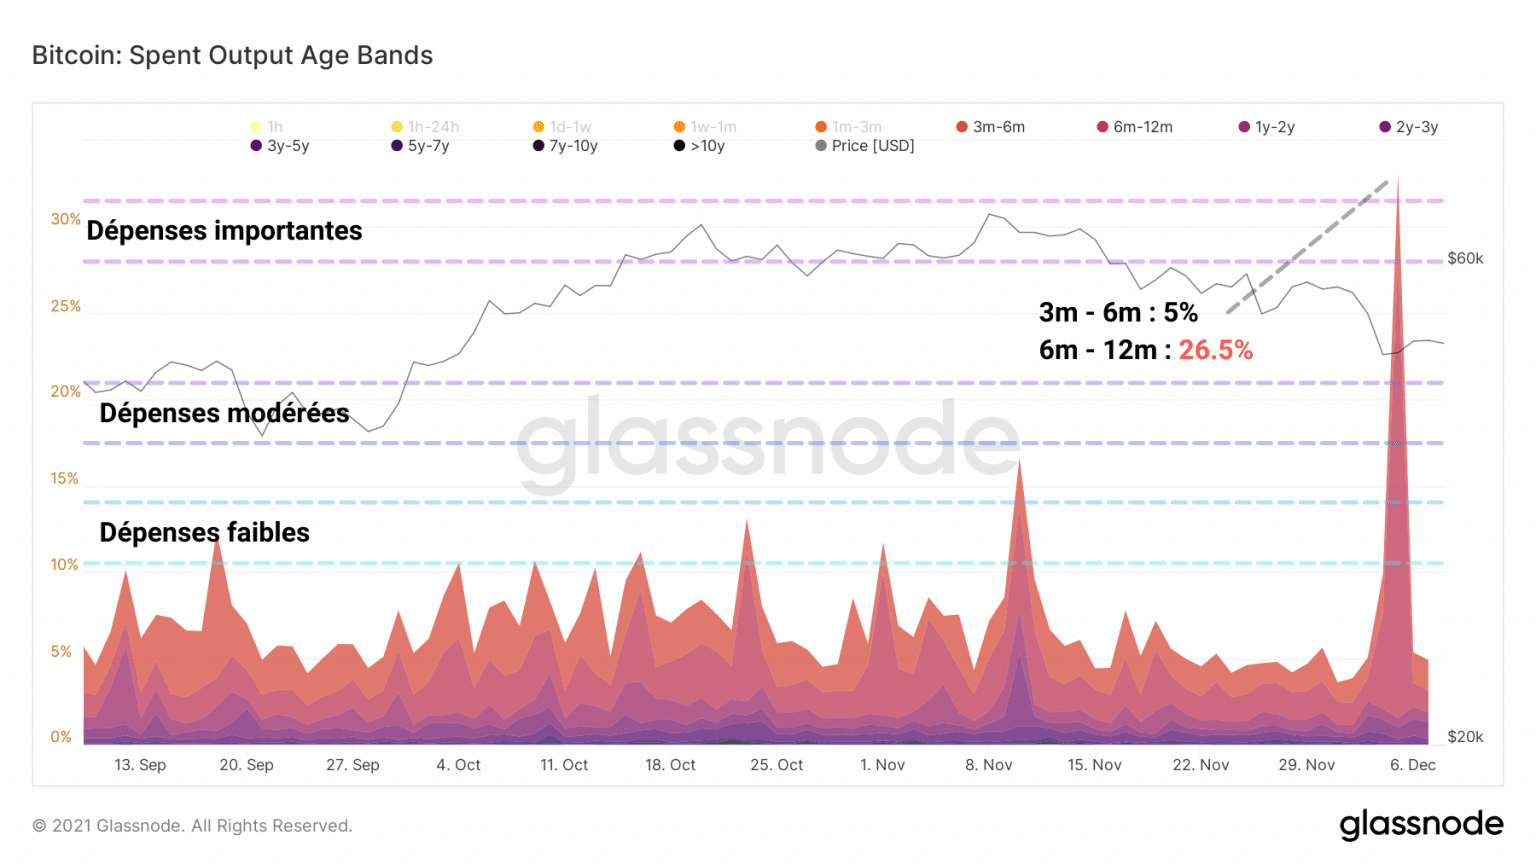
Bitcoin (BTC) SOAB Chart (Source: Glassnode)
While this spike appears high, the daily sum of destroyed token days indicates that this sale of old tokens is currently an isolated event involving a minority of the LTH cohort.
It should be noted, however, that if this movement becomes more pronounced, it could be part of a series of destruction waves that could indicate a tendency for some LTHs to gradually liquidate their position.
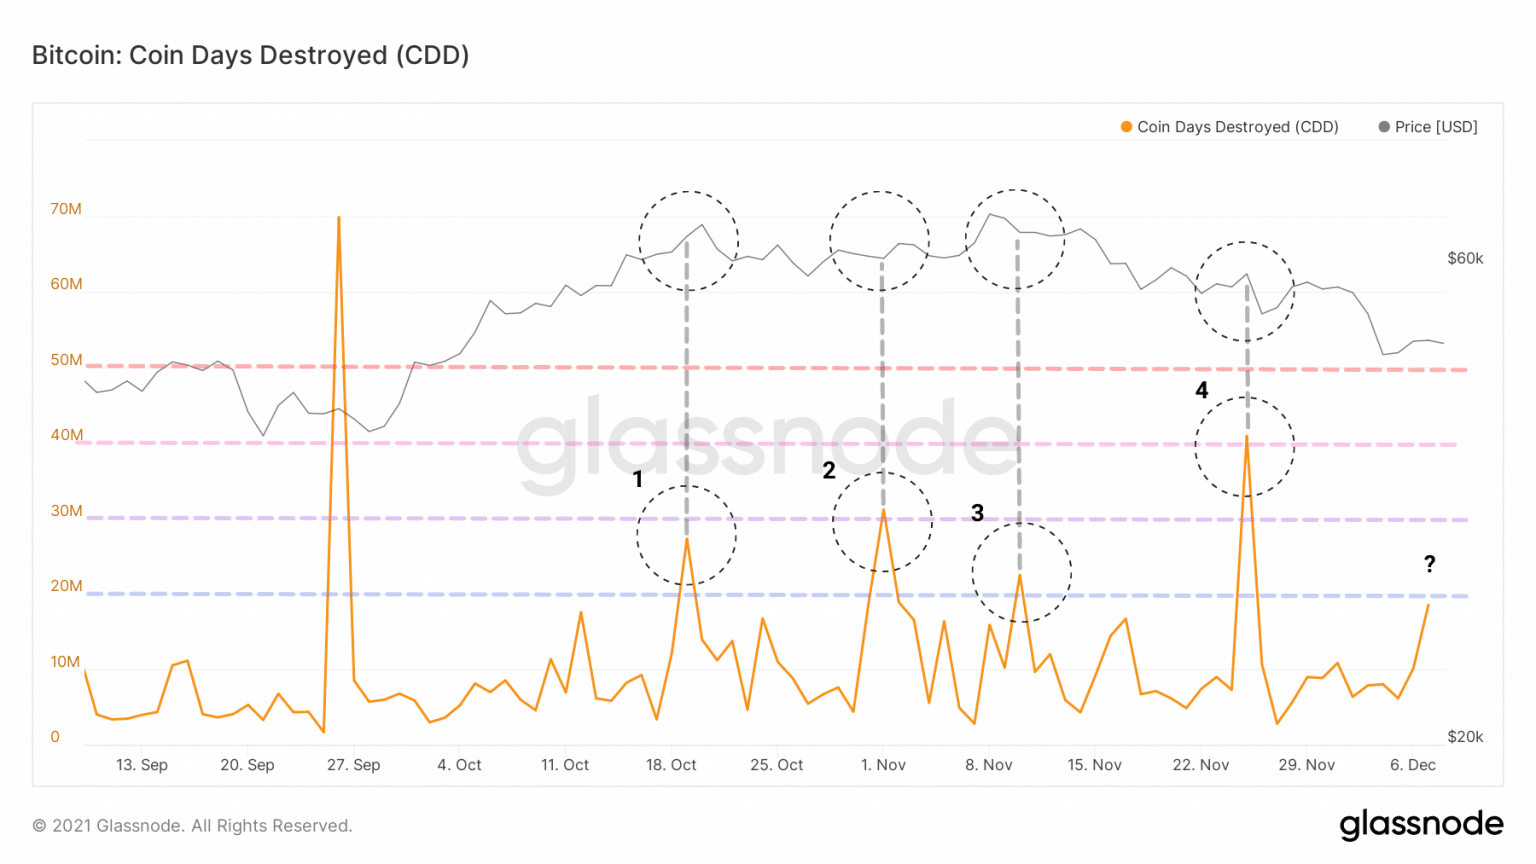
Bitcoin (BTC) CDD Chart (Source: Glassnode)
This finding is accentuated by the study of a new metric. Dormancy counts the average number of DDDs and is defined as the ratio of days of destruction to total transfer volume.
This graph clearly depicts LTHs decreasing their spending in early November before distributing slightly at the $50,000 level.
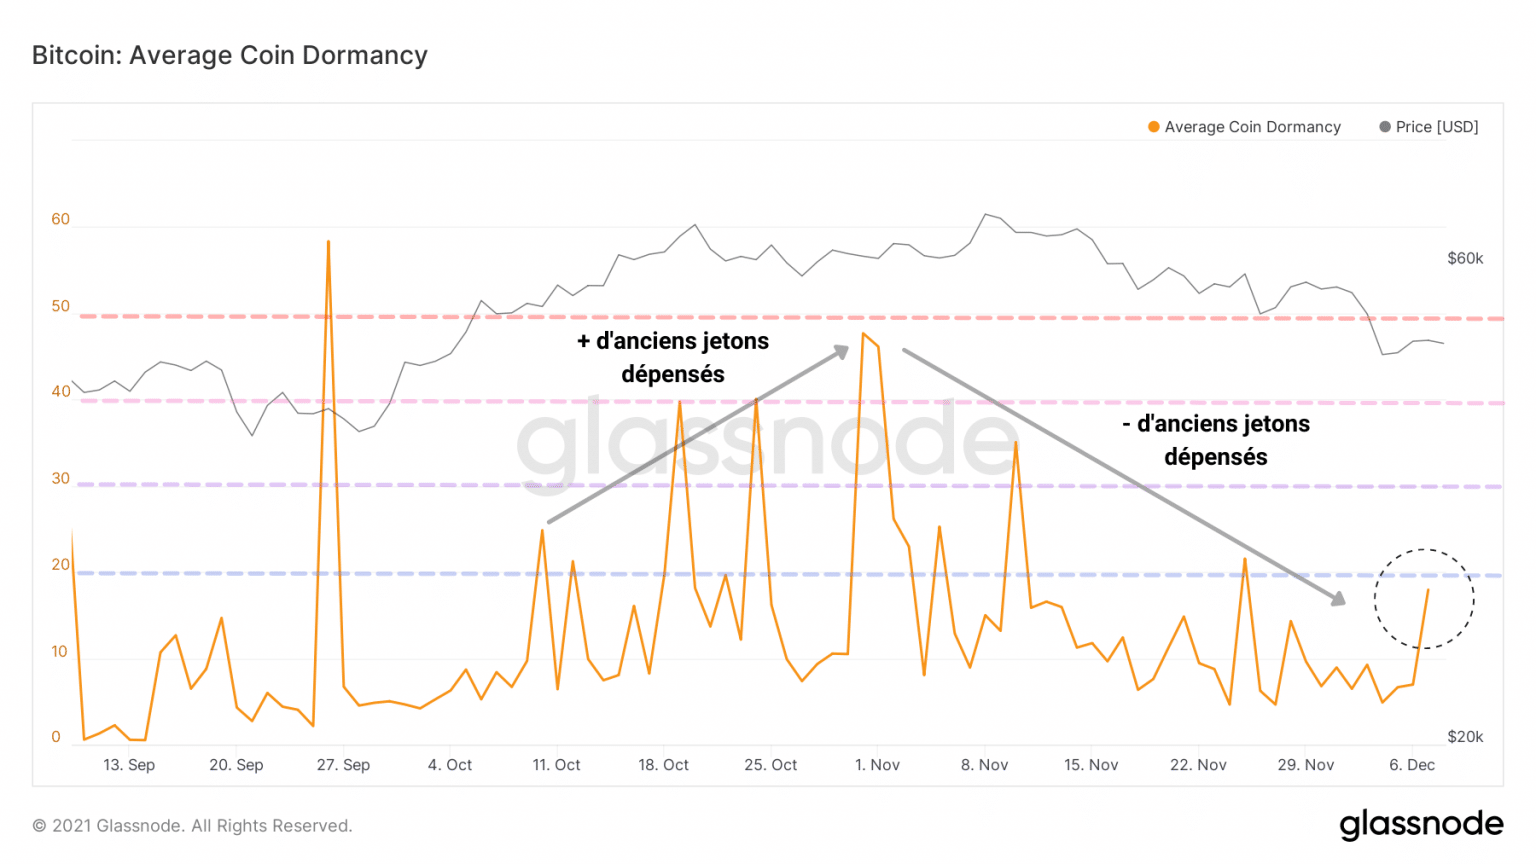
Bitcoin (BTC) Dormancy Chart (Source: Glassnode)
Thus, the behaviour of long term holders could indicate the direction of the market in the coming weeks depending on whether they decide to continue accumulation or to start a larger distribution phase.
Summary and signs to watch
Finally, by combining high open interest, a positive funding rate maintained above 0.01% and the absence of significant short liquidations, the derivatives market maintained an overexposure to risk that eventually backfired on bullish speculators.
This observation will be taken into account in our future studies in order to better anticipate the next major liquidation events, whether up or down.
Having taken heavy losses, STHs have sold (voluntarily or not) part of their chips on the spot markets during the downturn, while LTHs have reacted after the storm by selling a small fraction of their holdings.
At this point, we are looking to see if long term holders want to hold or distribute their loot.
If LTHs are distributing, it would be desirable to observe:
- a strong spot demand induced by STHs;
- an increase in liveliness;
- aSOPR returns to positive values;
- BTC price retains $48,500 and SMA 200 weekly.
Reversal, if LTHs continue to accumulate, we would like to see:
- moderate to strong spot demand;
- a stable or gently growing dormancy;
- aSOPR rebounding to neutral;
- BTC price to rise towards $53,000 and break out of the 21 daily EMA.