
Available data on the Lightning Network indicates that the network’s growth has stalled, but capital continues to flow into it. Although it is not fully decentralized, the Lightning Network remains distributed across several major hubs.
The $100,000 mark holds firm
After another bearish impulse, the BTC price returned to the symbolic $100,000 zone. This price level once again acted as support, offering investors an attractive short-term buying opportunity.
Following up on our previous analysis, today we will track the evolution of the Lightning Network to assess its growth and adoption rate.
We will thus examine an often-underestimated aspect of Bitcoin network usage, which nevertheless represents a significant portion of its monetary activity.
It should be noted, however, that it remains difficult to accurately track interactions on the Lightning Network, which casts a shadow over the monitoring of its activity and may potentially impact our future analyses. Here’s an update!
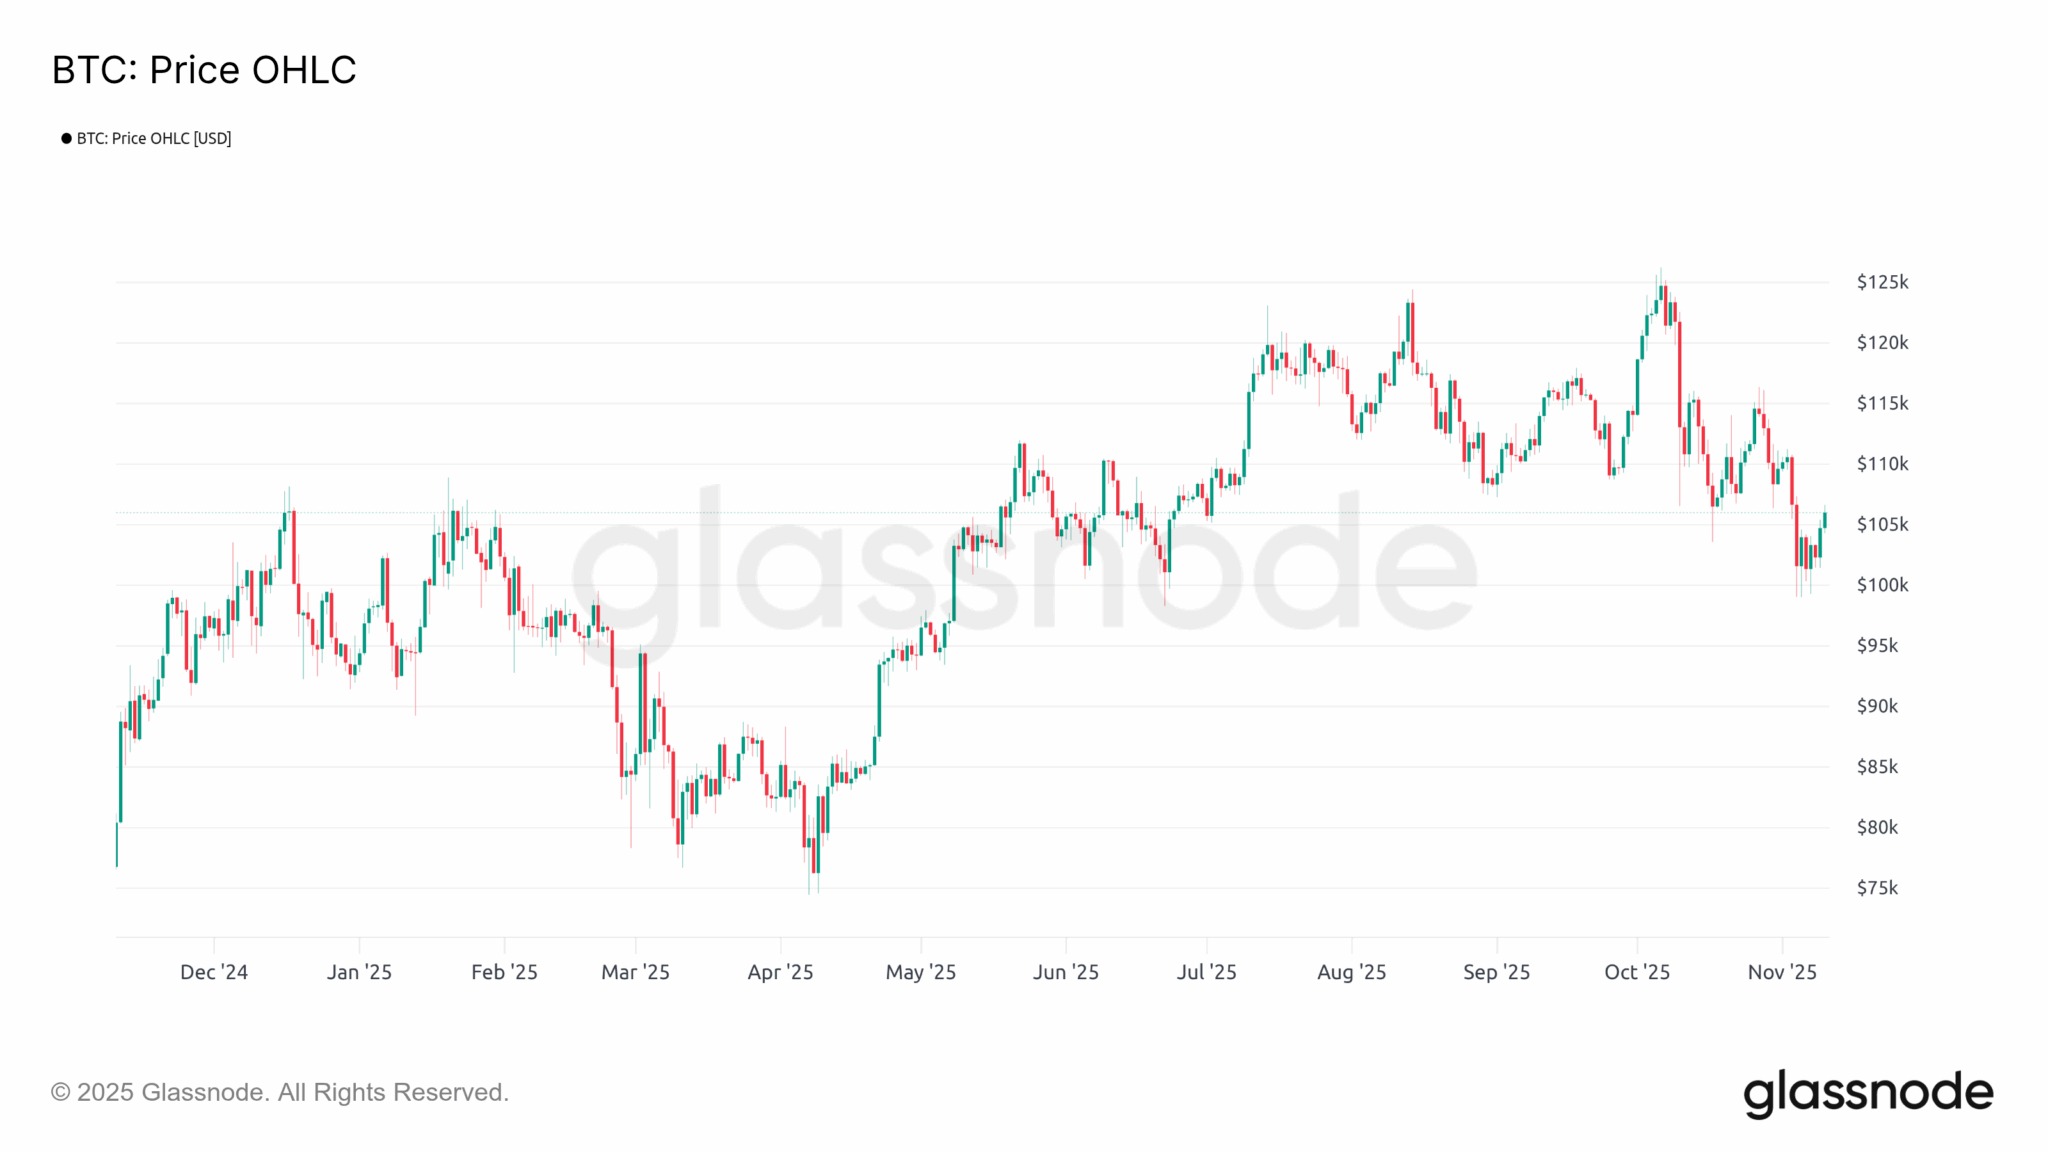
Figure 1: BTC Spot Price
Lightning Network Development
Important note: Since LN channels can transfer large volumes of BTC without being closed, it is difficult to accurately estimate the transaction volumes flowing through the Lightning Network. The data presented below comes from independent data providers and reflects only a partial picture of the network’s current state.
The Lightning Network is a decentralized network built on top of the Bitcoin (BTC) protocol, enabling peer-to-peer, instant, and very low-cost payments.
On the Lightning Network, each transaction corresponds to a transfer of funds between two nodes via payment channels. A channel enables nearly instantaneous, off-chain exchanges with no fees as long as it remains open, which can affect data related to network activity.
This system of bidirectional payment channels allows for an infinite number of payments between two parties without each transaction being recorded on the blockchain, thereby avoiding transaction fees for each transfer.
Although data regarding the Lightning Network is sometimes imprecise and varies depending on the data provider, it is essential to analyze it to gain a comprehensive overview of the monetary activity taking place on the Bitcoin network.
Between 2021 and 2022, the number of Lightning nodes increased significantly, signaling substantial growth and adoption of the network. However, the total number of Lightning nodes has remained stable at around 16,000 since March 2022.
The average capacity (maximum volume of BTC transferable via a Lightning node/channel) of Lightning nodes on the network also saw a sharp increase in 2021 and 2023, before beginning to stagnate until now.
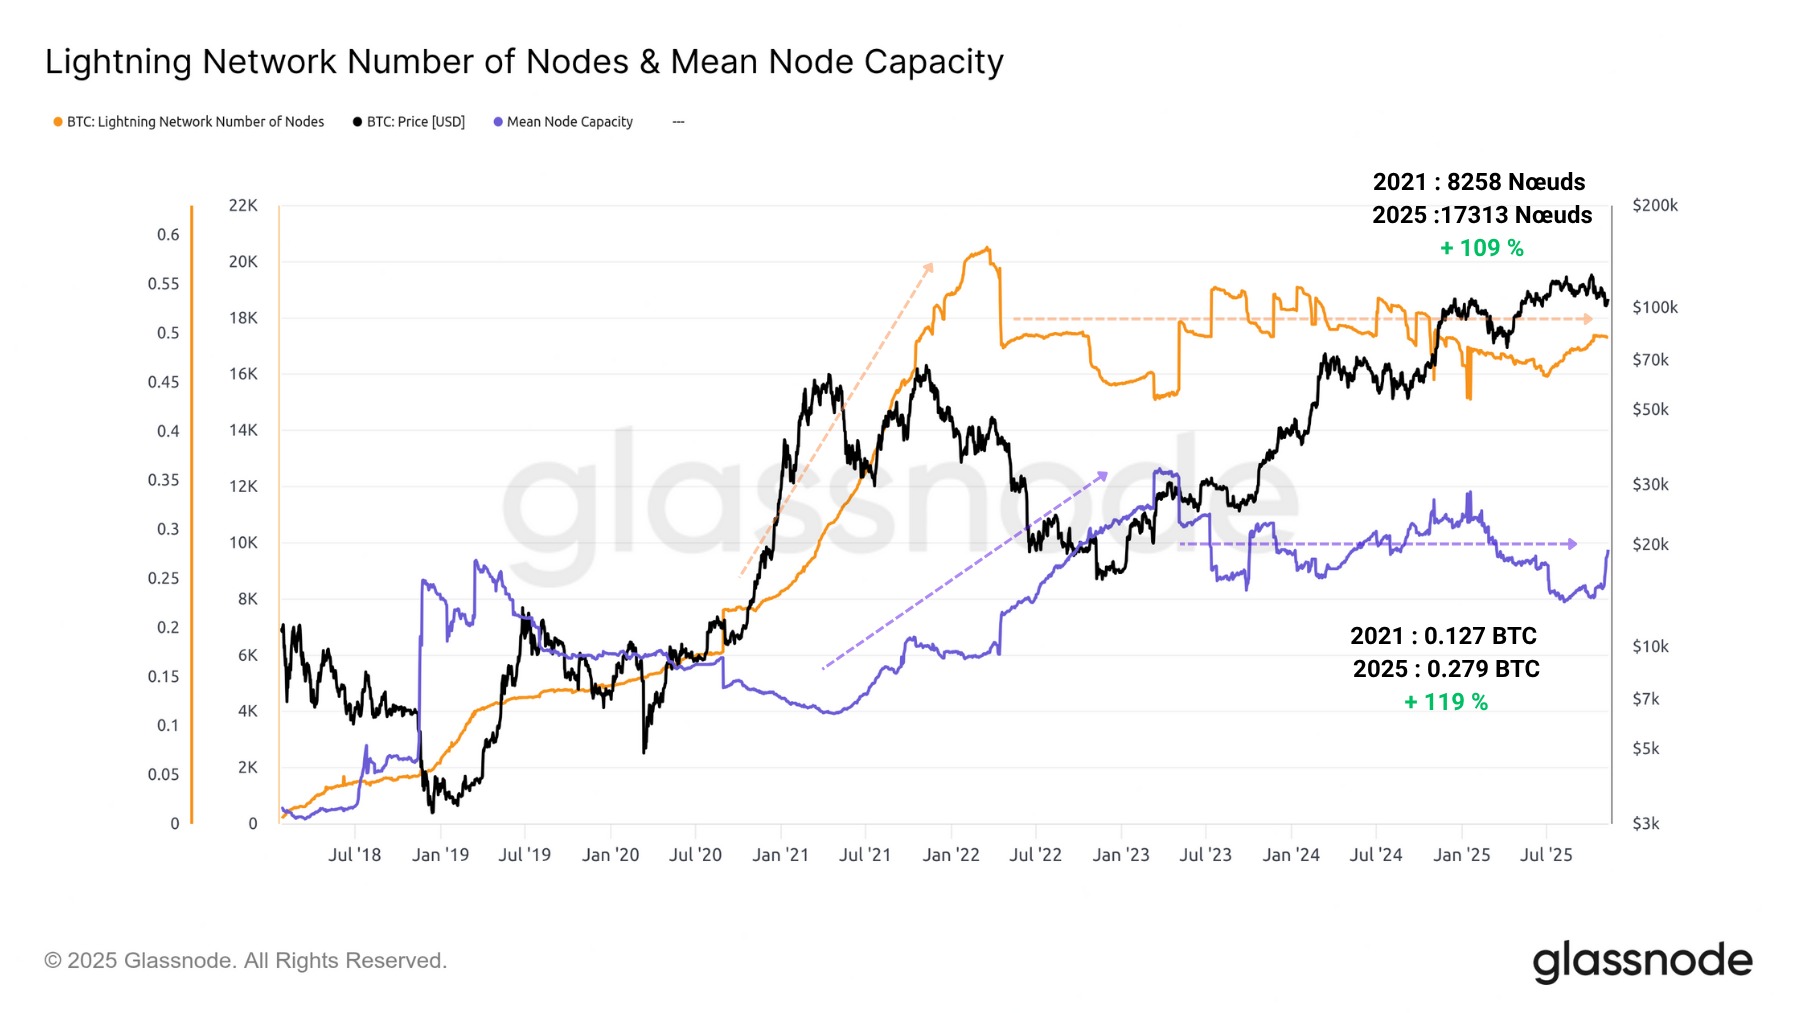
Figure 2: Number of Lightning nodes and average capacity
The nature of Lightning nodes is another important aspect of the network, as it defines the network access to which the nodes are connected.
While the Lightning network is currently composed largely of nodes connected to the Tor network, we have observed a significant drop in this number since 2023, with no visible compensation in other types of connectivity.
However, nodes connected to the IP network have seen a sharp increase since July 2025, suggesting the arrival of one or more major users utilizing this type of connectivity.
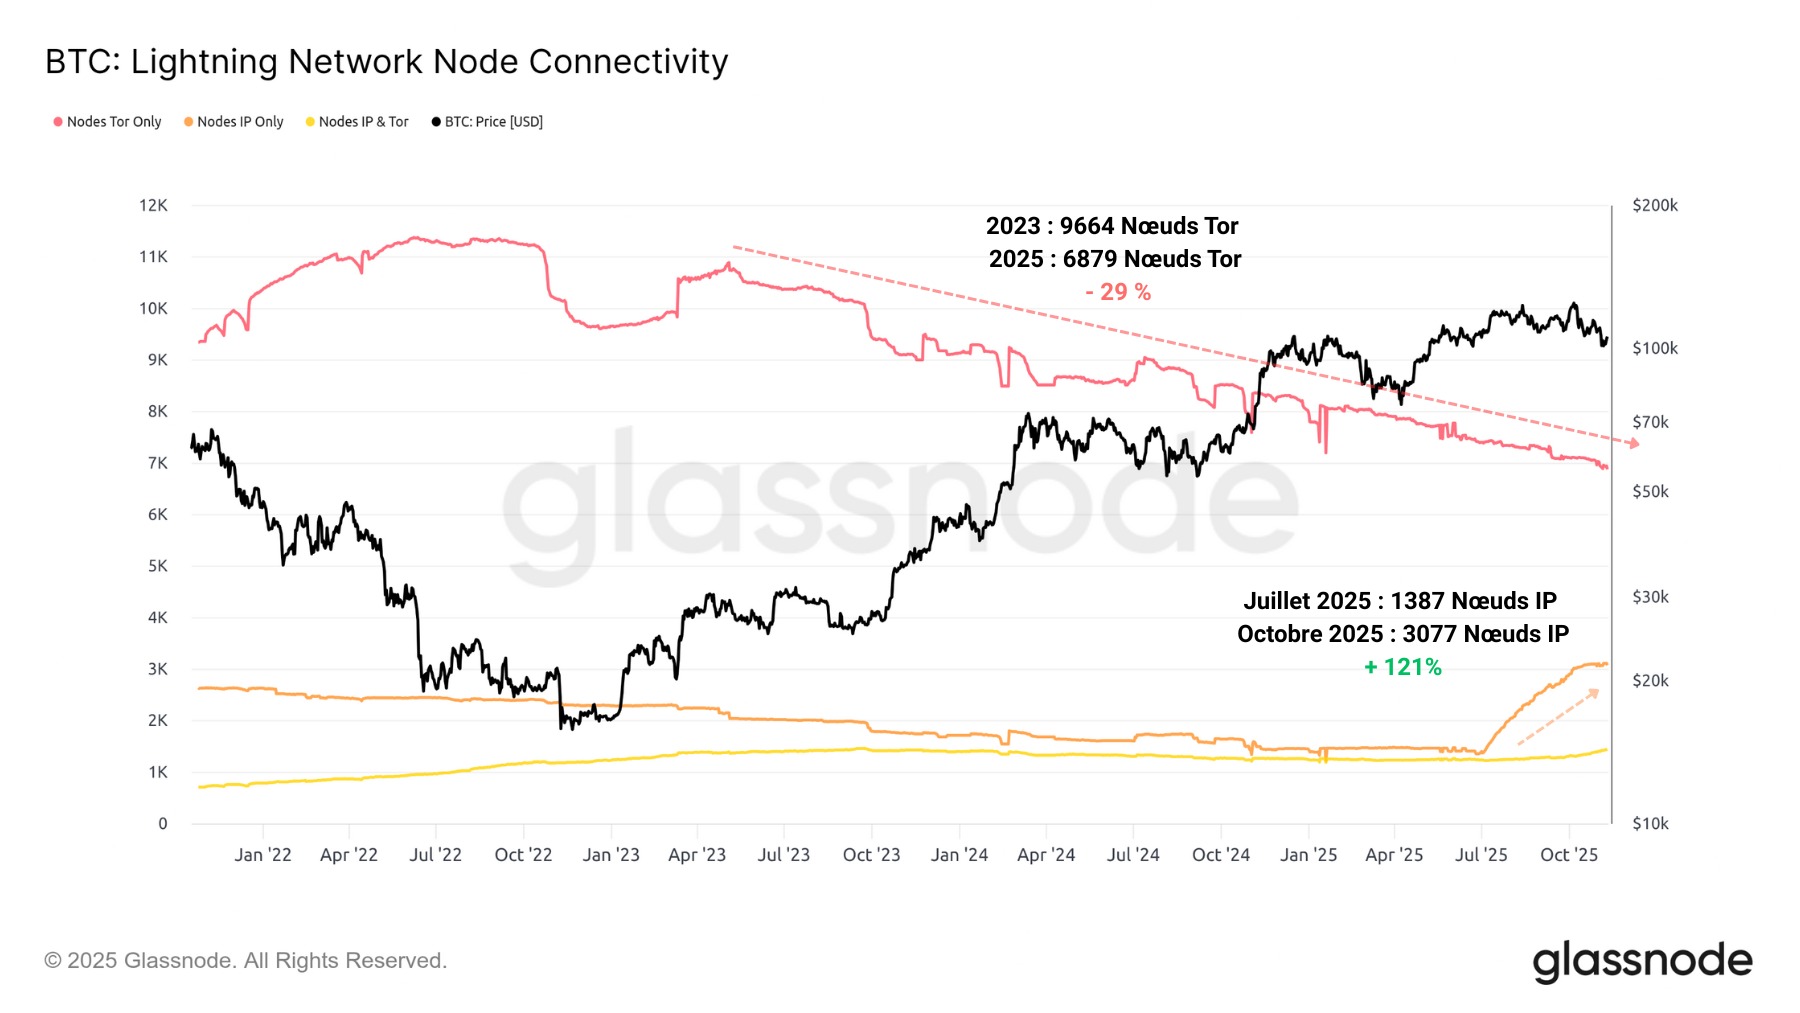
Figure 3: Number of Lightning nodes by connection type
The number of open Lightning channels is another indicator of network usage and has followed a two-phase trend over the past few years.
Between 2021 and 2022, the number of open Lightning channels skyrocketed, suggesting widespread adoption of the network. However, shortly before the collapse of the FTX platform, marking the end of the 2022 bear market, this number saw a sharp decline.
This event marked the beginning of a gradual decline in the number of open Lightning channels, which appears to have stabilized recently. Overall, there are now 38% more channels than in 2021.
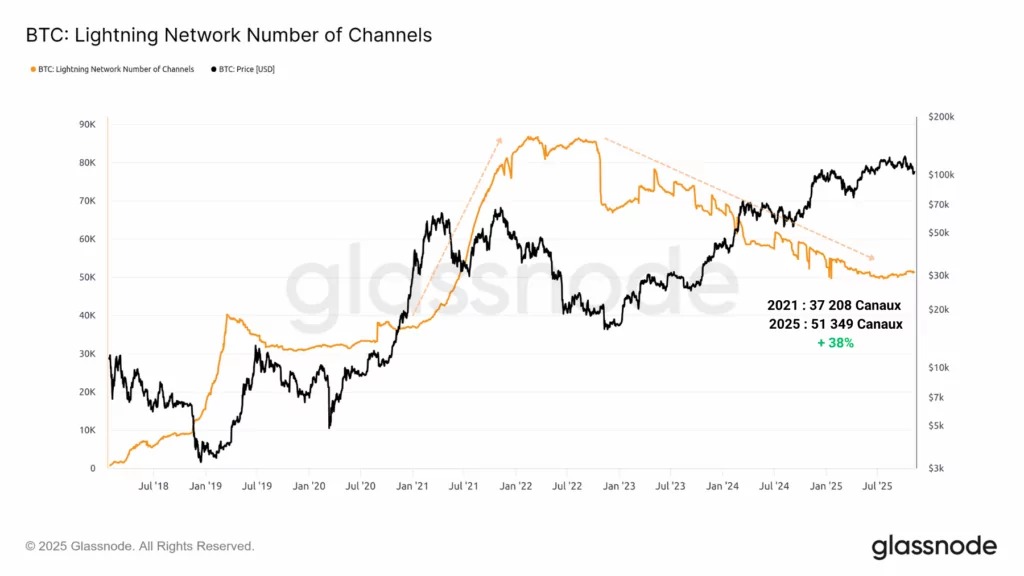
Figure 4: Number of Lightning channels
In addition to the number of open channels, it is essential to measure the network’s average channel capacity to assess whether the Lightning Network can support more transactions and users.
Between 2021 and 2025, the average capacity of Lightning channels increased by 228% in BTC terms and by over 1,100% in USD terms, marking a significant increase in available liquidity on the network.
In particular, we can observe a major increase in this metric over the past few days, suggesting a massive influx of new capital into the network.
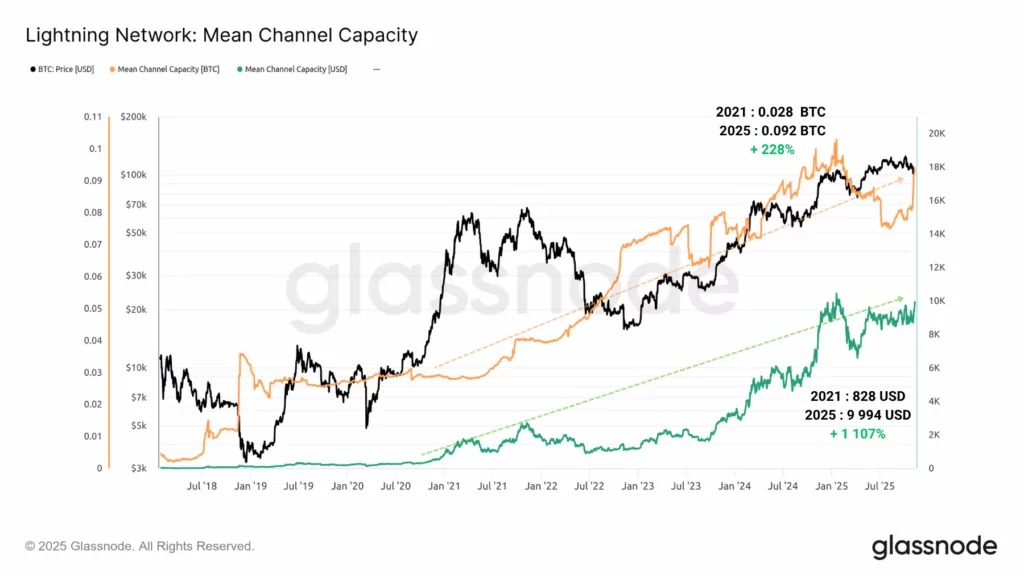
Figure 5: Number of Lightning nodes and average capacity in USD and BTC
A multipolar network
Despite its decentralized ethos, a common criticism of the Lightning Network is the risk of liquidity centralization in a few large nodes (particularly those operated by exchanges or popular services).
The Gini coefficient, or Gini index, is a statistical measure used to describe the distribution of a variable (income, wealth, etc.) within a population.
When applied to the available capacity on the Lightning Network, this index clearly approaches 1, a value indicating significant inequalities in the distribution of liquidity across the network.
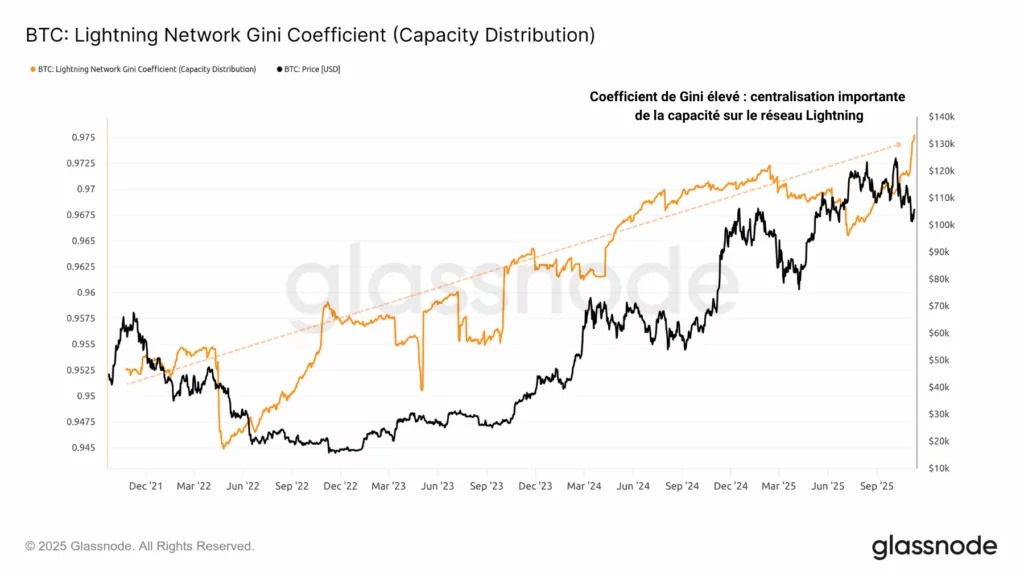
Figure 6: Gini coefficient of the Lightning Network
The following graph puts this observation into perspective by showing the global distribution of Lightning nodes. It becomes clear that the services and liquidity available on the Lightning Network are predominantly concentrated on the East Coast of the United States and in Europe.
While this may not be a sign of pure decentralization, the Lightning Network is clearly distributed across various major hubs that compete to attract as much liquidity and activity as possible.
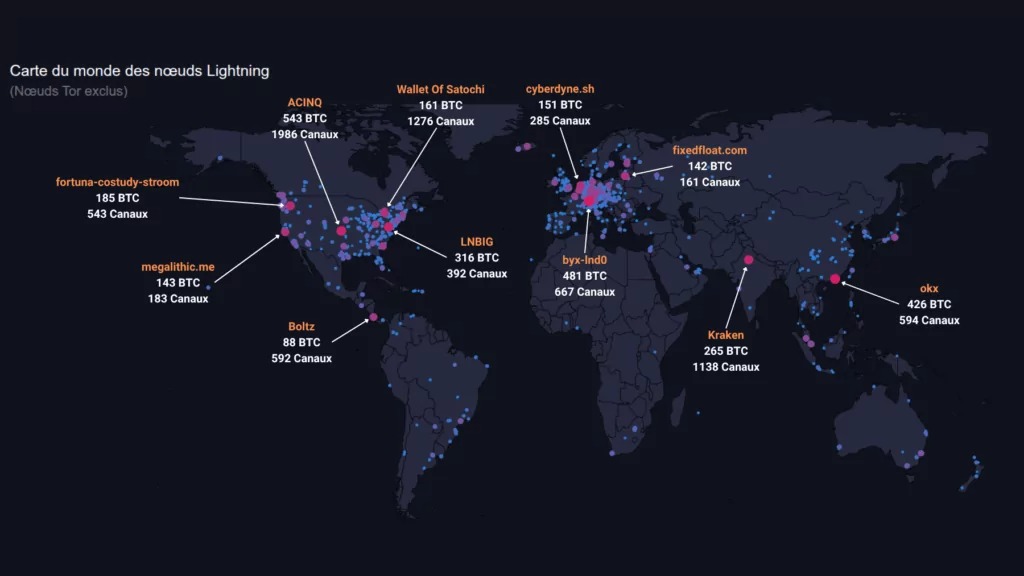
Figure 7: Global distribution of Lightning nodes
Summary of this analysis on the Lightning Network
Ultimately, the available data on the Lightning Network indicates that network growth has stagnated, but capital flows continue to pour in.
Between 2021 and 2022, the number of Lightning nodes rose sharply, before plateauing at around 16,000 since March 2022. Furthermore, the number of Lightning channels also surged during the same period before beginning a gradual decline, which appears to have stabilized recently. Overall, there are now 38% more channels compared to 2021.
Between 2021 and 2025, the average capacity of Lightning channels increased by 228% in terms of Bitcoin units and by over 1,100% in dollar value, marking a significant increase in capital available on the network.
Finally, although it is not perfectly decentralized, the Lightning Network remains distributed among various major hubs that compete to attract as much liquidity and activity as possible.