
Since the beginning of the year, the NBB Smart Chain has been very well adopted, with the creation of almost 91 million new addresses. That’s an increase of 38%, which gives us the opportunity to take a look at some interesting statistics
The adoption of the NBB Smart Chain continues
After having analysed the activity of various blockchains recently such as Sui, Polygon (MATIC) and Arbitrum (ARB), it is now the turn of the BNB Smart Chain (BSC).
Since the start of the year, the BSC has continued to grow, with an increase of more than 38% in the number of addresses between 1 January and today.
The network now has almost 328 million addresses, making it the most widely adopted blockchain in terms of this metric alone:
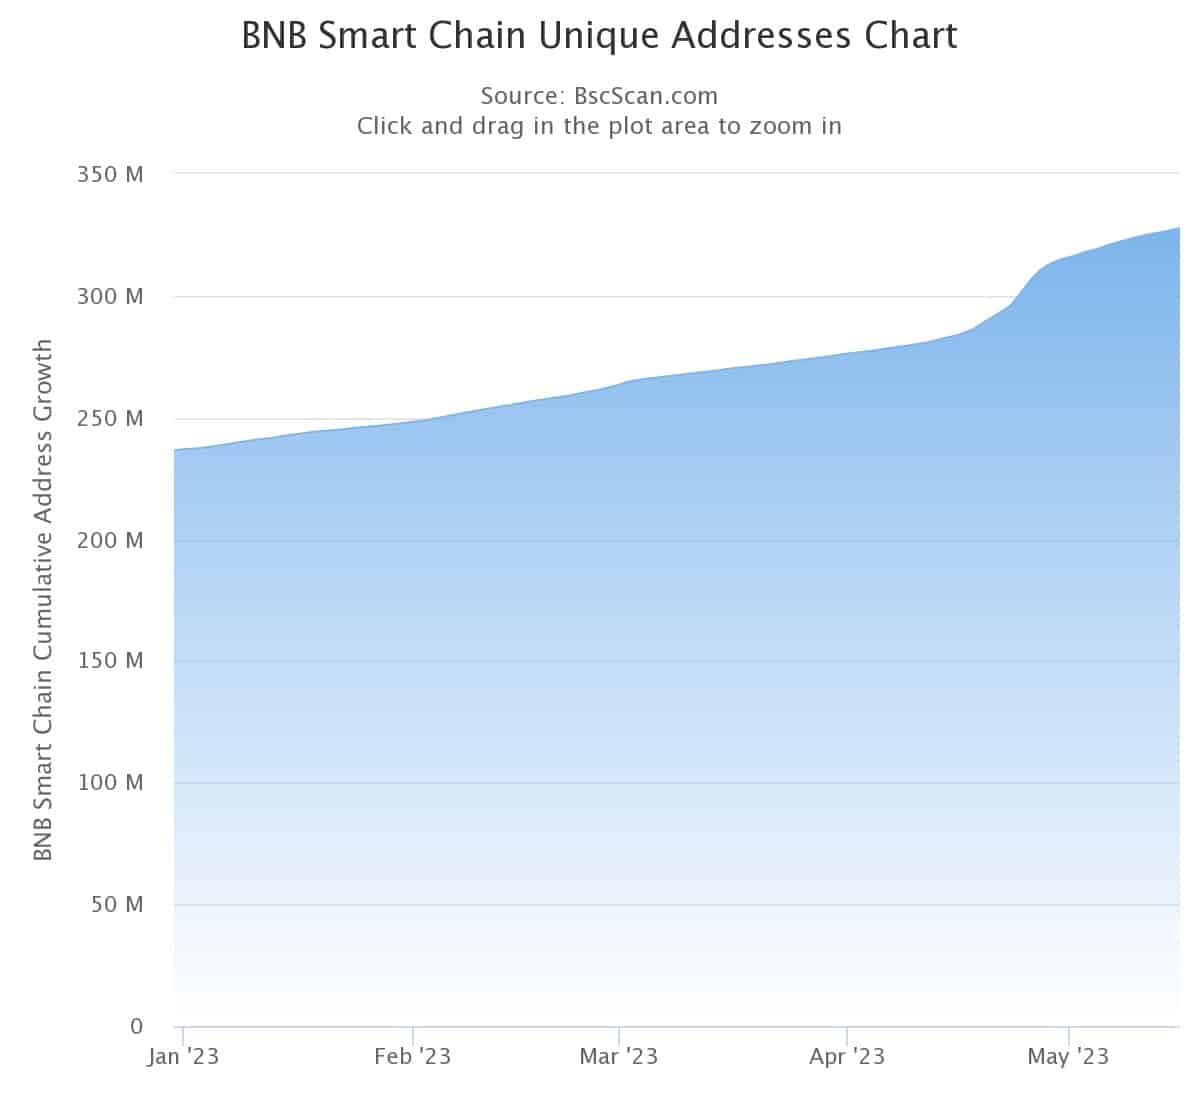
Figure 1 – Number of unique addresses on the BSC
In terms of daily active users, we are currently at around 1.5 million addresses. For reference, the all-time high (ATH) was just over 2.27 million on 1 December 2021, and the low since then was 710,061 on 28 August 2022.
In terms of the number of daily transactions, the BSC looks set to pass the 5 million mark. This level was broken about a year ago now, and the network has since evolved below it despite a few attempts to exceed it:
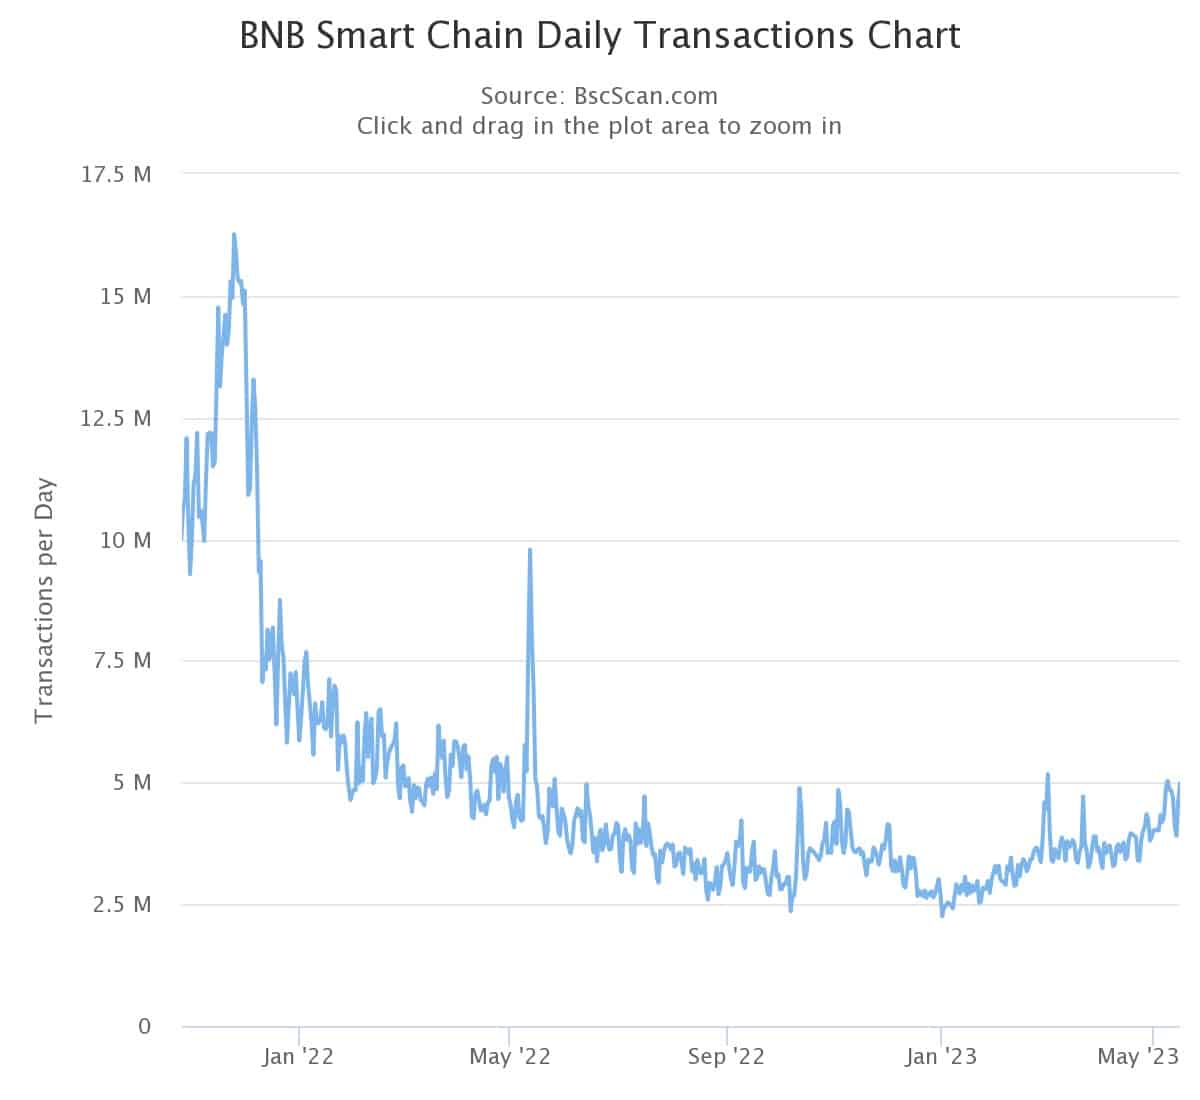
Figure 2 – Number of daily transactions on the BSC
Financial data
Depending on the data we consider, BSC is the second blockchain in terms of the number of decentralised applications, 597 protocols according to DefiLlama, or the third blockchain in terms of total locked value (TVL).
This TVL amounts to 4.65 billion dollars, behind Tron (TRX) with 5.45 billion and Ethereum (ETH) for 27.07 billion dollars.
Since June 2022, we can see that it’s actually been flat, with relatively little volatility at that level.
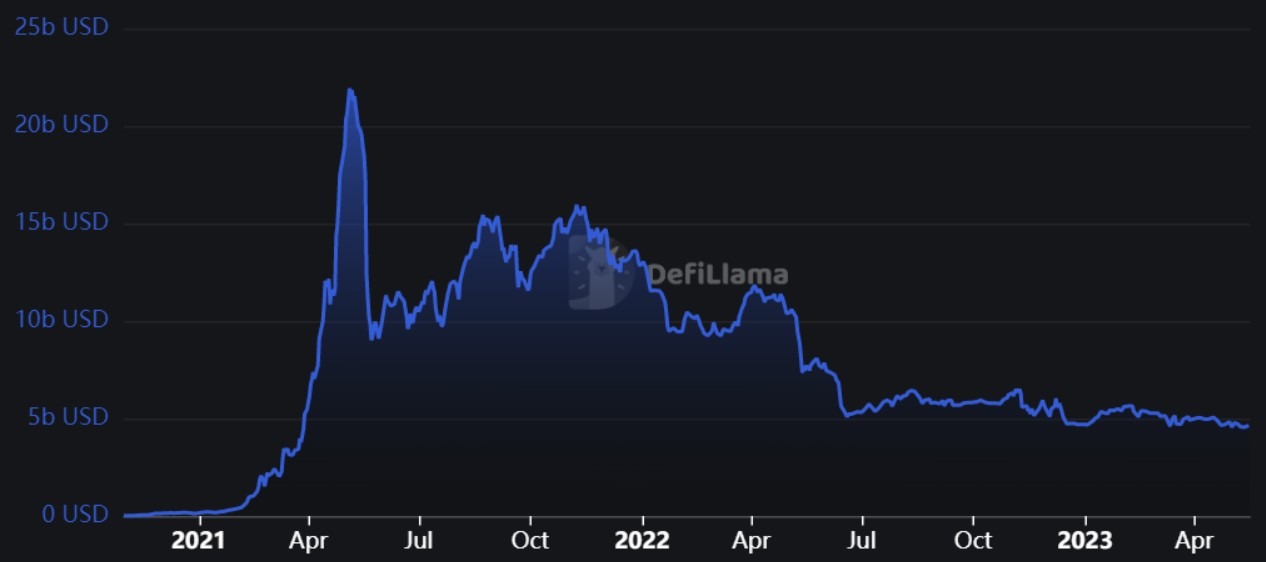
Figure 3 – TVL of the NBB Smart Chain
As the chart above shows, the ATH was reached 2 years ago, on 5 May 2021 for $21.93 billion.
Apart from the fact that this was a bull run, it was also a time when the ecosystem was feeling the full brunt of soaring transaction fees on Ethereum. This phenomenon had benefited a number of other networks that had focused their communications primarily on the competitiveness of their fees.
As far as decentralised finance (DeFi) protocols are concerned, 2 applications dominate, with 2.05 billion and 815 million dollars respectively: the decentralised exchange PancakeSwap and the lending and borrowing protocol Venus.
As we can see, Uniswap (UNI), recently deployed on the NBB Smart Chain, does not feature in the top 10 below, and will only come in at 29th place with $18.32 million in TVL :
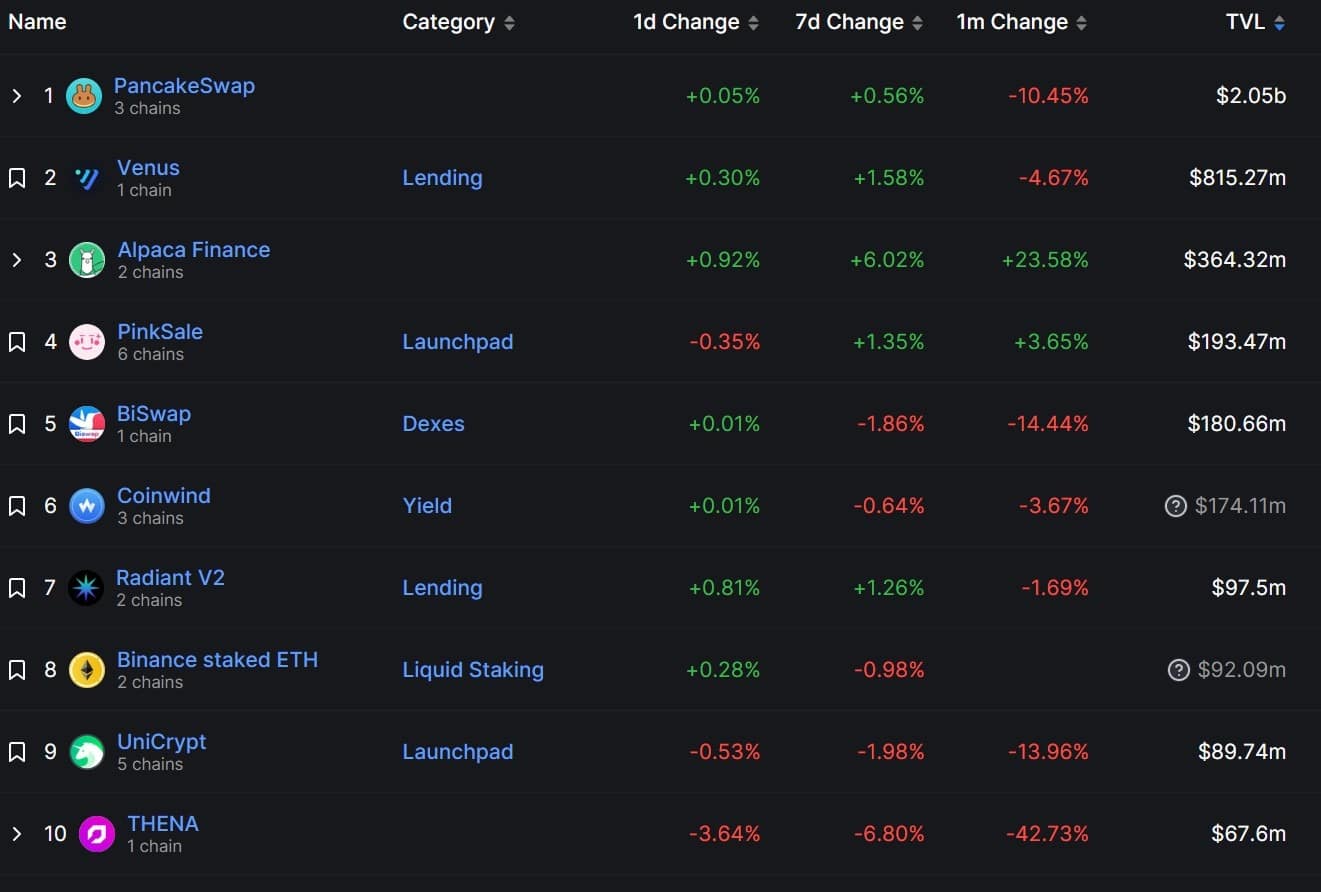
Figure 4 – Top 10 biggest DeFi apps at the BSC
As for BNB, the native token of this ecosystem, it is trading at around $310 at the time of writing, in 4th place among the largest cryptocurrency capitalisations at $48.9 billion.