
After Bitcoin (BTC) fell more than 12% (-$4209) yesterday and rebounded to $30,000 overnight, what are the scenarios to consider in this bear market? Will this support hold as it has in the past?
Bitcoin plunges to $30,000
This is a level we haven’t seen since July 2021. The Bitcoin (BTC) price had been working its way up through the summer, before finally bouncing back towards its all-time high (ATH) of $69,000, delivering an indecisive and fearful market until then.
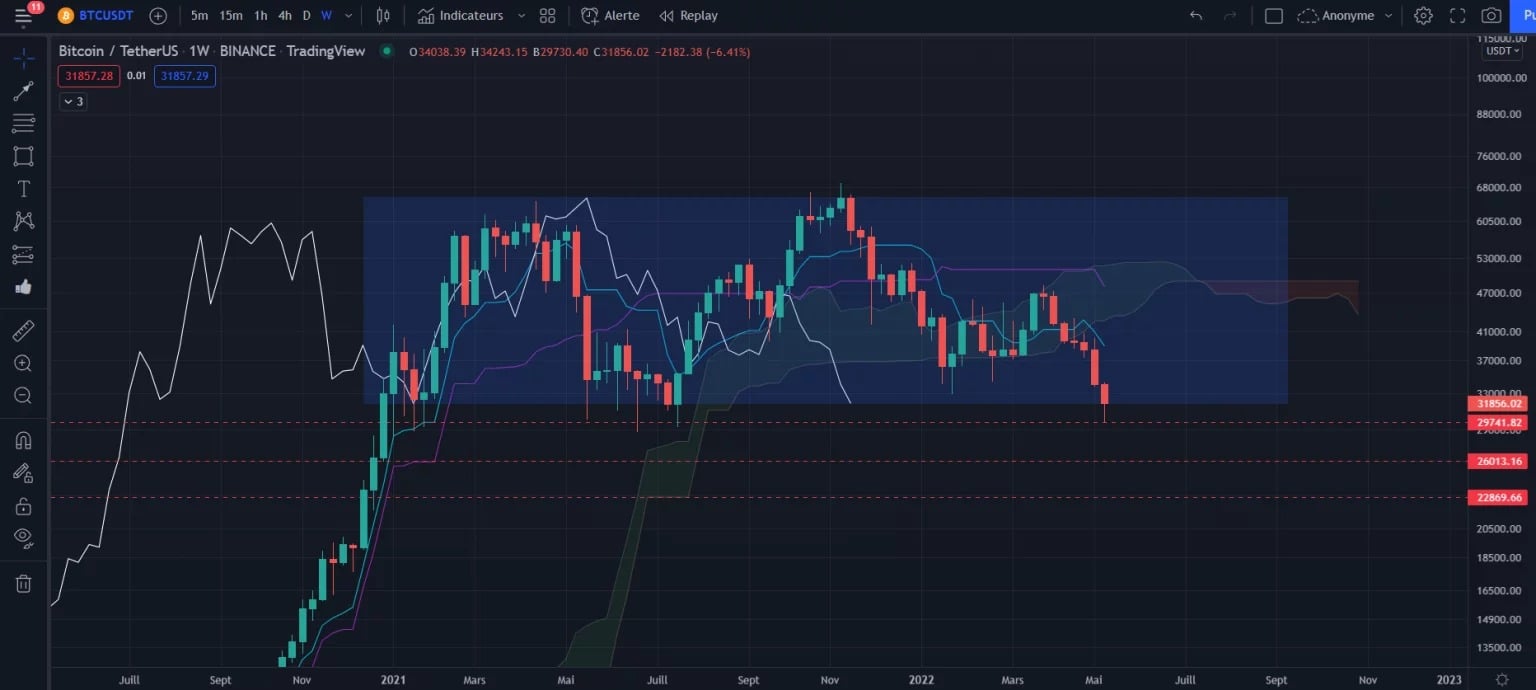
Figure 1: Bitcoin Weekly Price Chart
Here we go again, but this time with a very different economic and political context. Record inflation rates and a dizzying drop in the traditional markets against the backdrop of the war in Ukraine have destabilized investors and upset all the certainties on this crypto-currency market, which has seen one positive announcement after another over the past few months.
So will we be able to repeat the scenario of July 2021, during which the price finally experienced its ultimate rebound before the ATH? Or are we on the verge of an even deeper dive than last summer? Remember that the above chart is on a weekly scale. Each candle represents a week and therefore each target we are about to discuss may take several weeks or even months to achieve.
Technical analysis reflects the psychology of the market. Once again we have the proof in the pudding as the $30,000 support has always allowed the price to rebound over the past year. It is a round number below which the price has been determined to be cheap by market participants to date, and which has always triggered a bullish rally to a new ATH thereafter. This level is therefore very important to hold. A rebound would allow us to move back towards the middle of the range at $40,000, and then potentially towards the top of the range around $65,600.
If this key level is broken at the end of the week, however, the next support level will be at $26,000 (Kijun flat), then at $22,869 (SSB flat). Indeed, the Ichimoku system allows us to plot the next support levels by taking into account the flats made by the Tenkan and the Kijun, curves that very often act as magnets on the price.
Bearish targets already reached
For chartist traders, the current level is a profit taking level following a bearish breakout. Indeed, the Daily chart offered us a very relevant Bearish Channel with a minimum of 3 contact points on each side
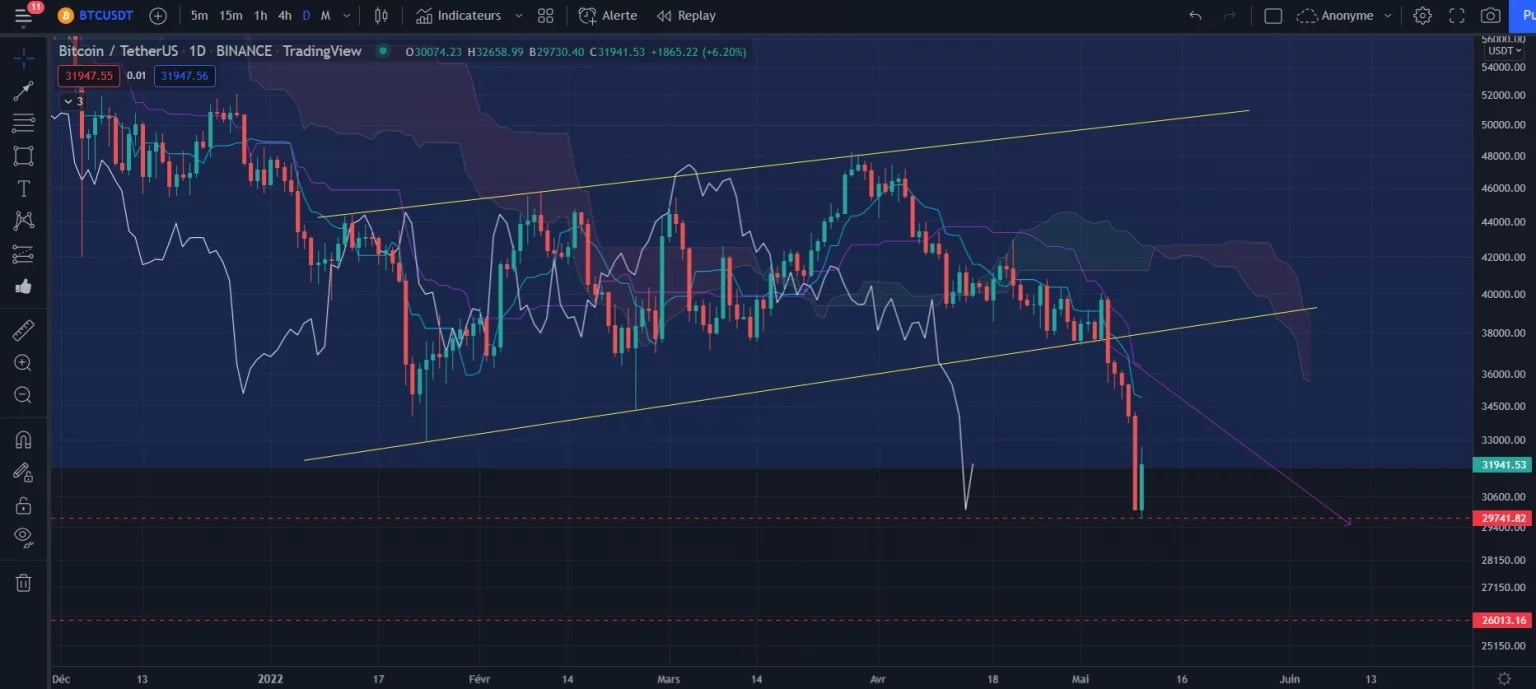
Figure 2: Daily Bitcoin Price Chart
The objective of this chart was the height of the channel, plotted at the breakout point and we can see that the current bounce is precisely on this level, which also corresponds to the Weekly support previously identified on the Ichimoku.
So what are the next steps in the short term? After this sharp fall, Bitcoin has moved far away from its Daily Tenkan, which is now at $35,000. A retest of this curve is to be expected as we are currently in an oversold situation (Tenkan and Kijun far from the price and quite a large gap between them).
In any case, it will be imperative to get back above the Kijun at $36,400 to regain this support, which could now take on the role of resistance. In case of a closing break of $29,740, the price would then risk going back down towards the next support at $26,000 (Weekly support).
In conclusion
Cryptocurrencies are counting on Bitcoin bouncing back from its Weekly and Monthly supports around $30,000. After each ATH, the price has never fallen back below the ATH of the previous cycle. If history repeats itself, the $20,000 level should be preserved