")
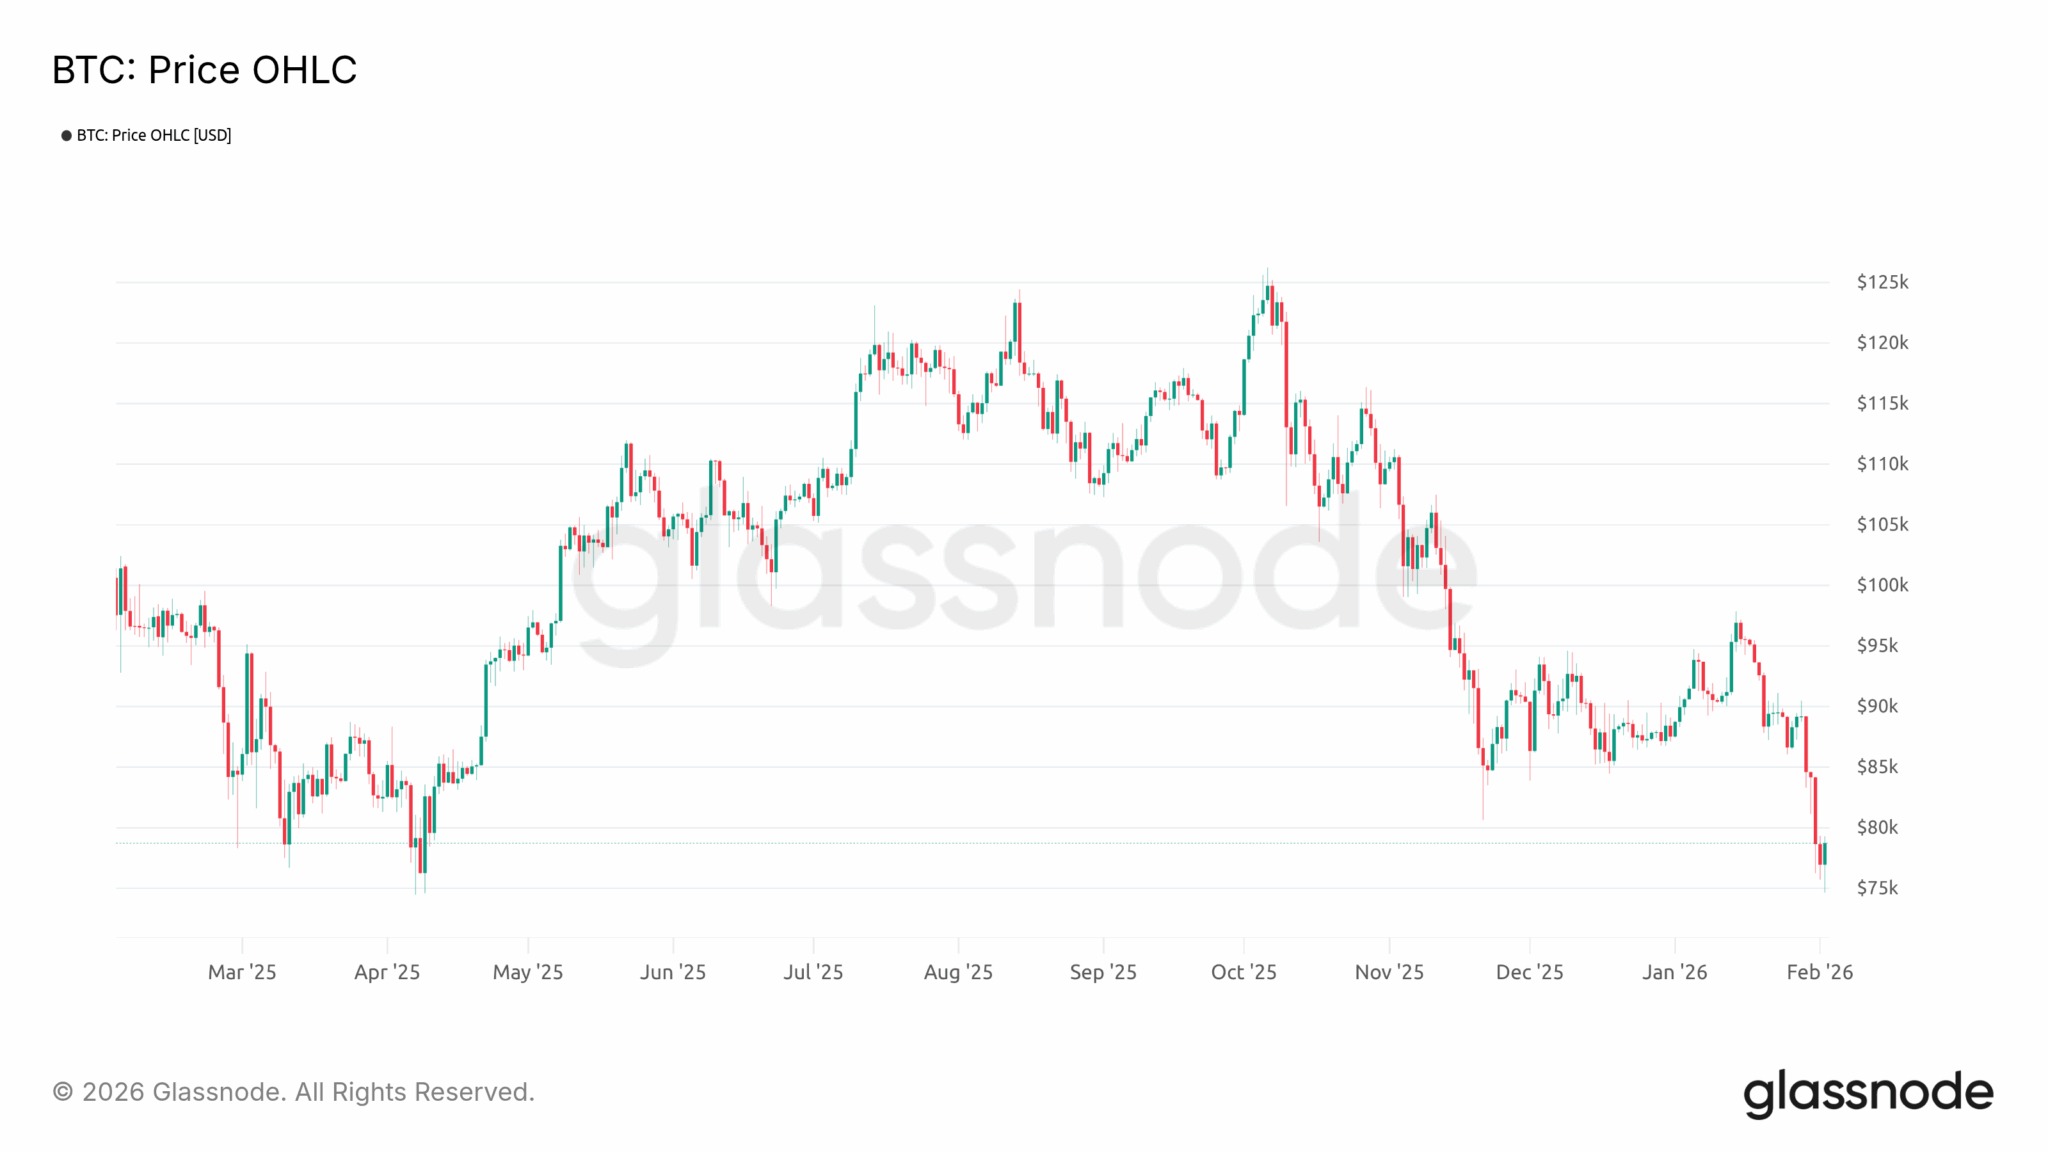
As the bearish momentum intensifies for BTC, many are wondering how far it will fall. A range between $55,000 and $40,000, corresponding to a potential decline of -56% to -68% from the October 2025 ATH, is catching our attention.
Bitcoin is dead, long live Bitcoin!
The price of BTC has plunged below the $85,000 support level, confirming the dead cat bounce scenario we feared in our previous analyses.
The risk of a prolonged bearish trend in 2026 is now very high, with the market entering an advanced phase of its bear market.
In this context, which price ranges could act as a floor for this new bearish cycle? How far could BTC fall? On-chain data provides us with some answers.
Change of regime
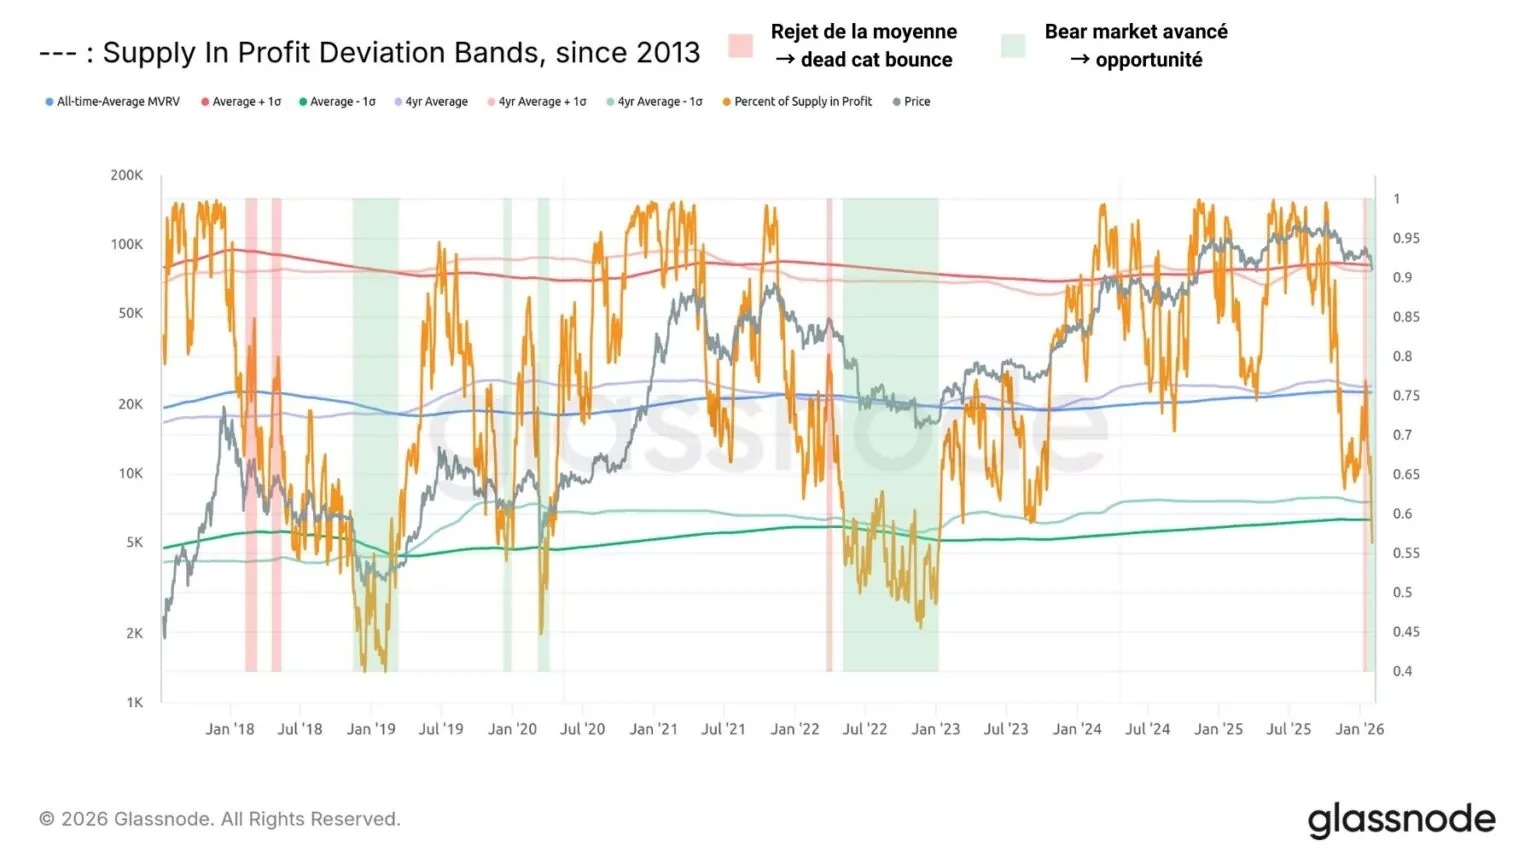
To better understand the current market situation, let’s evaluate BTC’s position over the long term. To do this, let’s continue to track the percentage of supply in profit, as well as its four-year and cumulative averages.
This metric measures the profitability of the circulating supply in order to estimate whether the market is overbought, oversold, or in equilibrium. The four-year and cumulative averages serve as reference thresholds to distinguish between bullish and bearish market conditions.
The correction at the end of 2025 caused this indicator to fall below both levels, estimated at around 75%. Historically, the BTC market exits bull market conditions when less than three out of four bitcoins are held at a profit. The rejection of this threshold in the following weeks thus reinforced the credibility of the dead cat bounce scenario.
More recently, the indicator has fallen below its statistical lows (in green), marking the onset of deteriorating market conditions, where declining profitability is gradually pushing investors to capitulate. This type of phase often corresponds to the emergence of the best long-term buying opportunities.
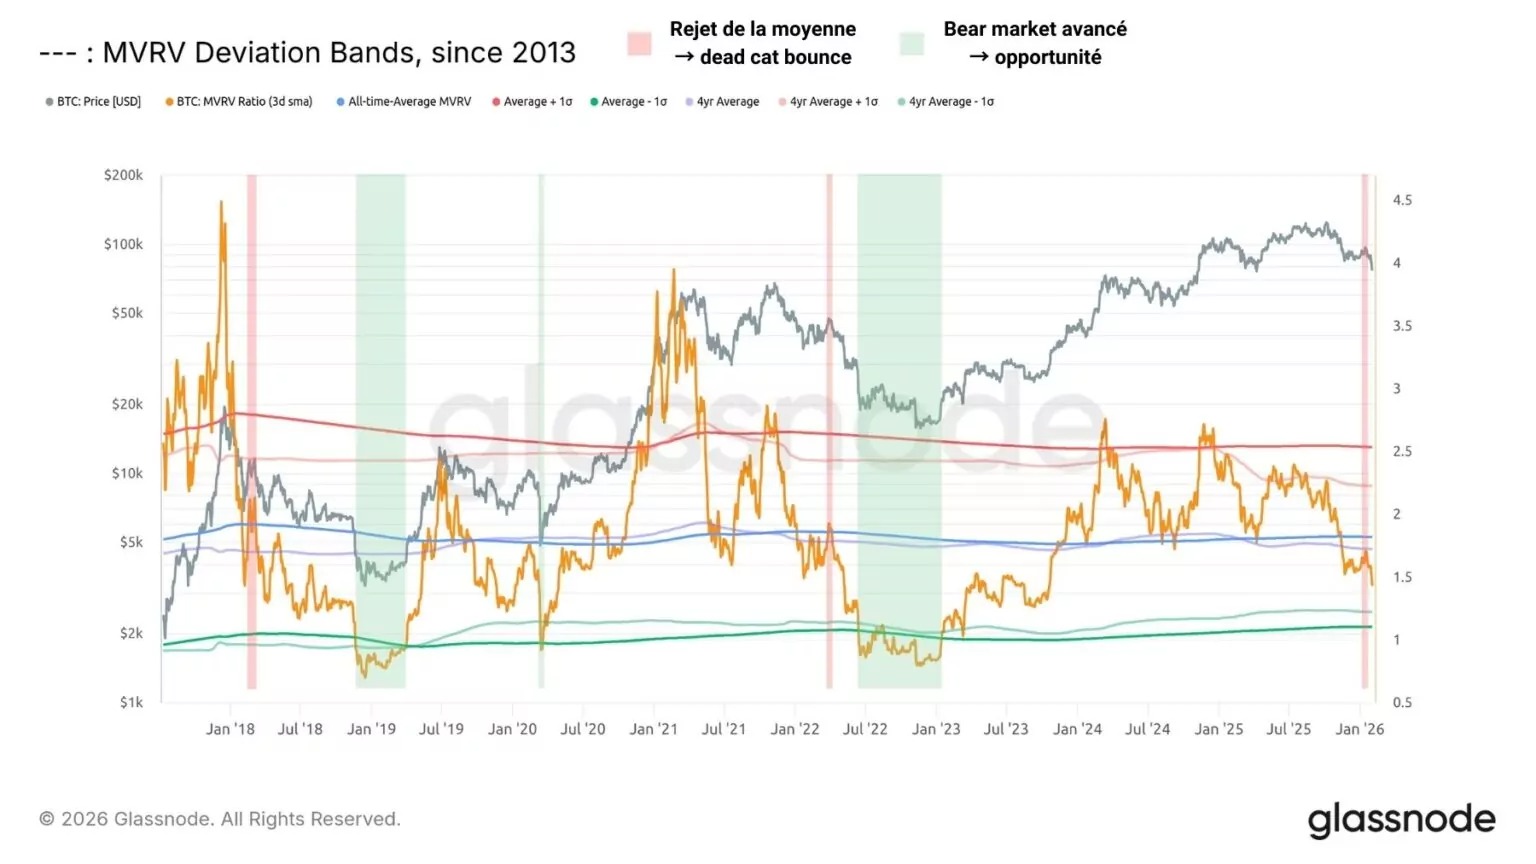
Applying this same analytical framework to the MVRV ratio, which estimates the average unrealized profitability of BTC in circulation, the situation appears slightly different.
Although a rejection of its averages occurred in mid-January, the indicator has not yet reached its statistical lows. Historically, these levels are usually reached during the terminal phase of a bear cycle, which could still take several months. In short, while the BTC market appears to be entering a bear market phase after the 2023–2025 bull cycle, it is still premature to say that the sales are over.
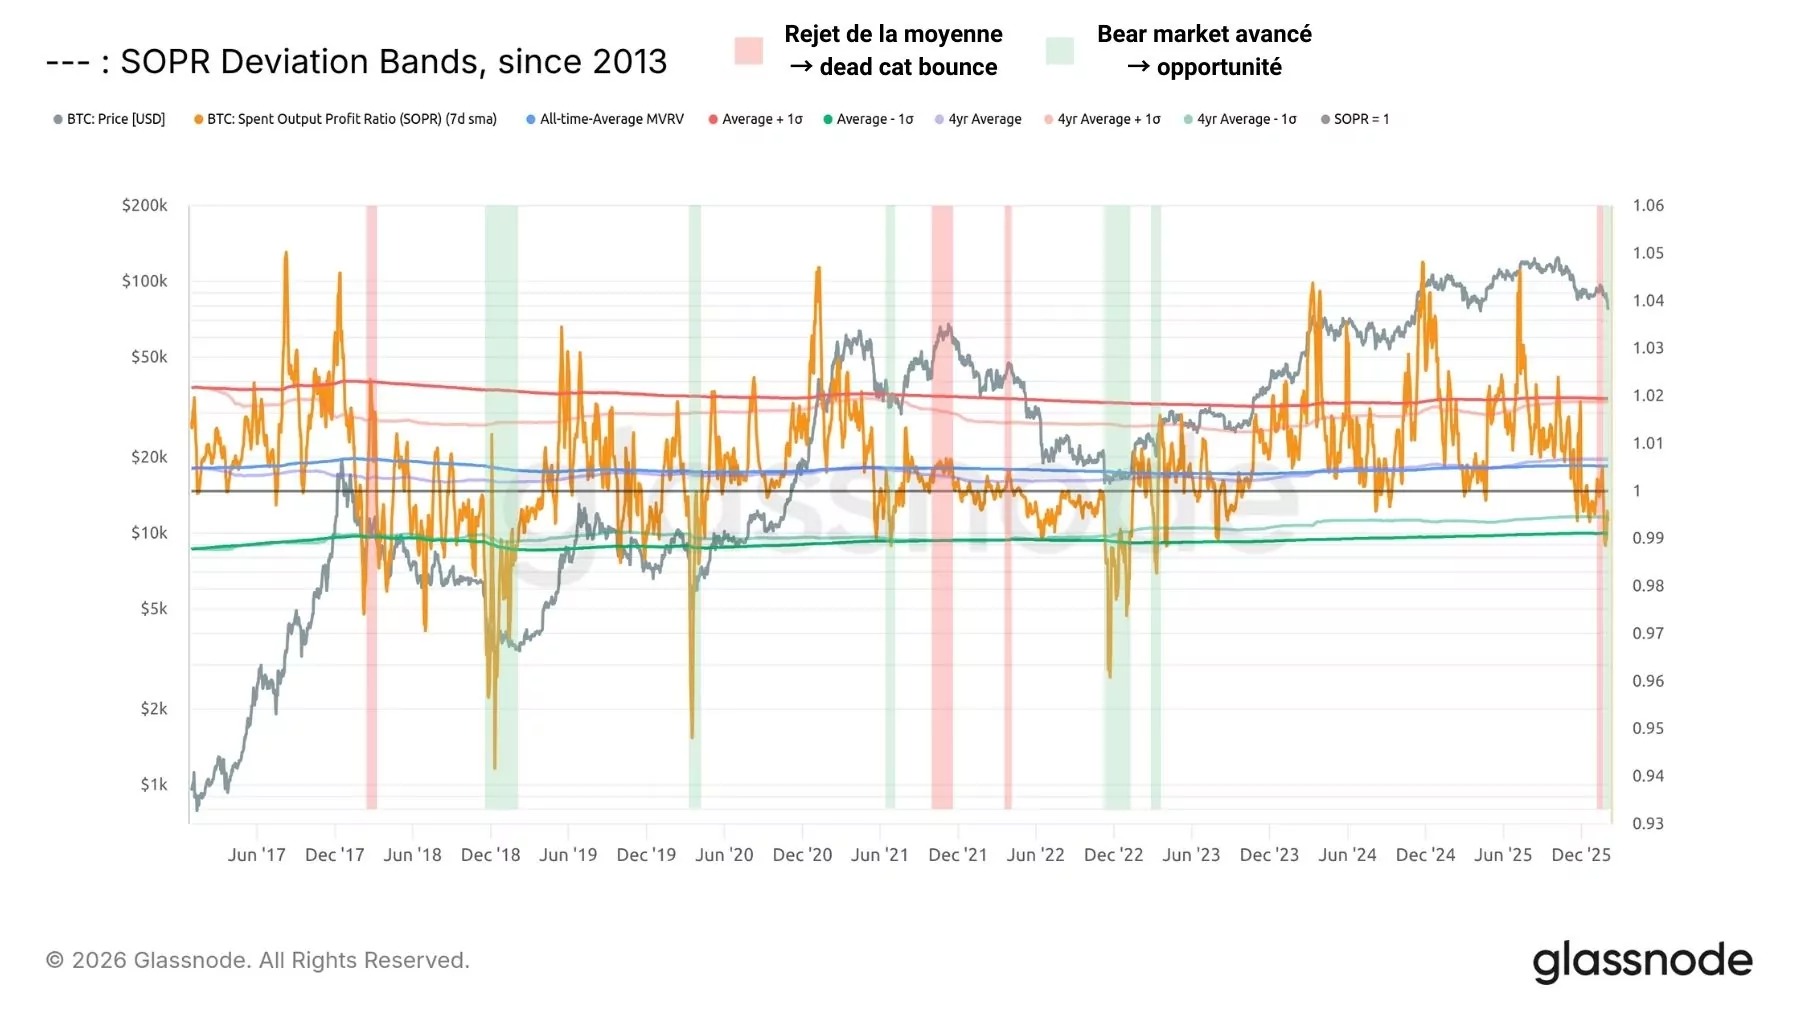
Finally, as with the percentage of supply in profit, BTC’s SOPR ratio has fallen below its statistical lows (in green), indicating that significant loss-taking has been triggered by the recent loss of support at $85,000. It appears that a local capitulation took place over the past week, with investors taking the hit by liquidating their holdings.
However, the magnitude of realized losses remains limited compared to the extreme capitulations seen in the terminal phases of previous bear markets (December 2018 and November 2022). This suggests that significant buying opportunities may still emerge in the coming weeks or months.
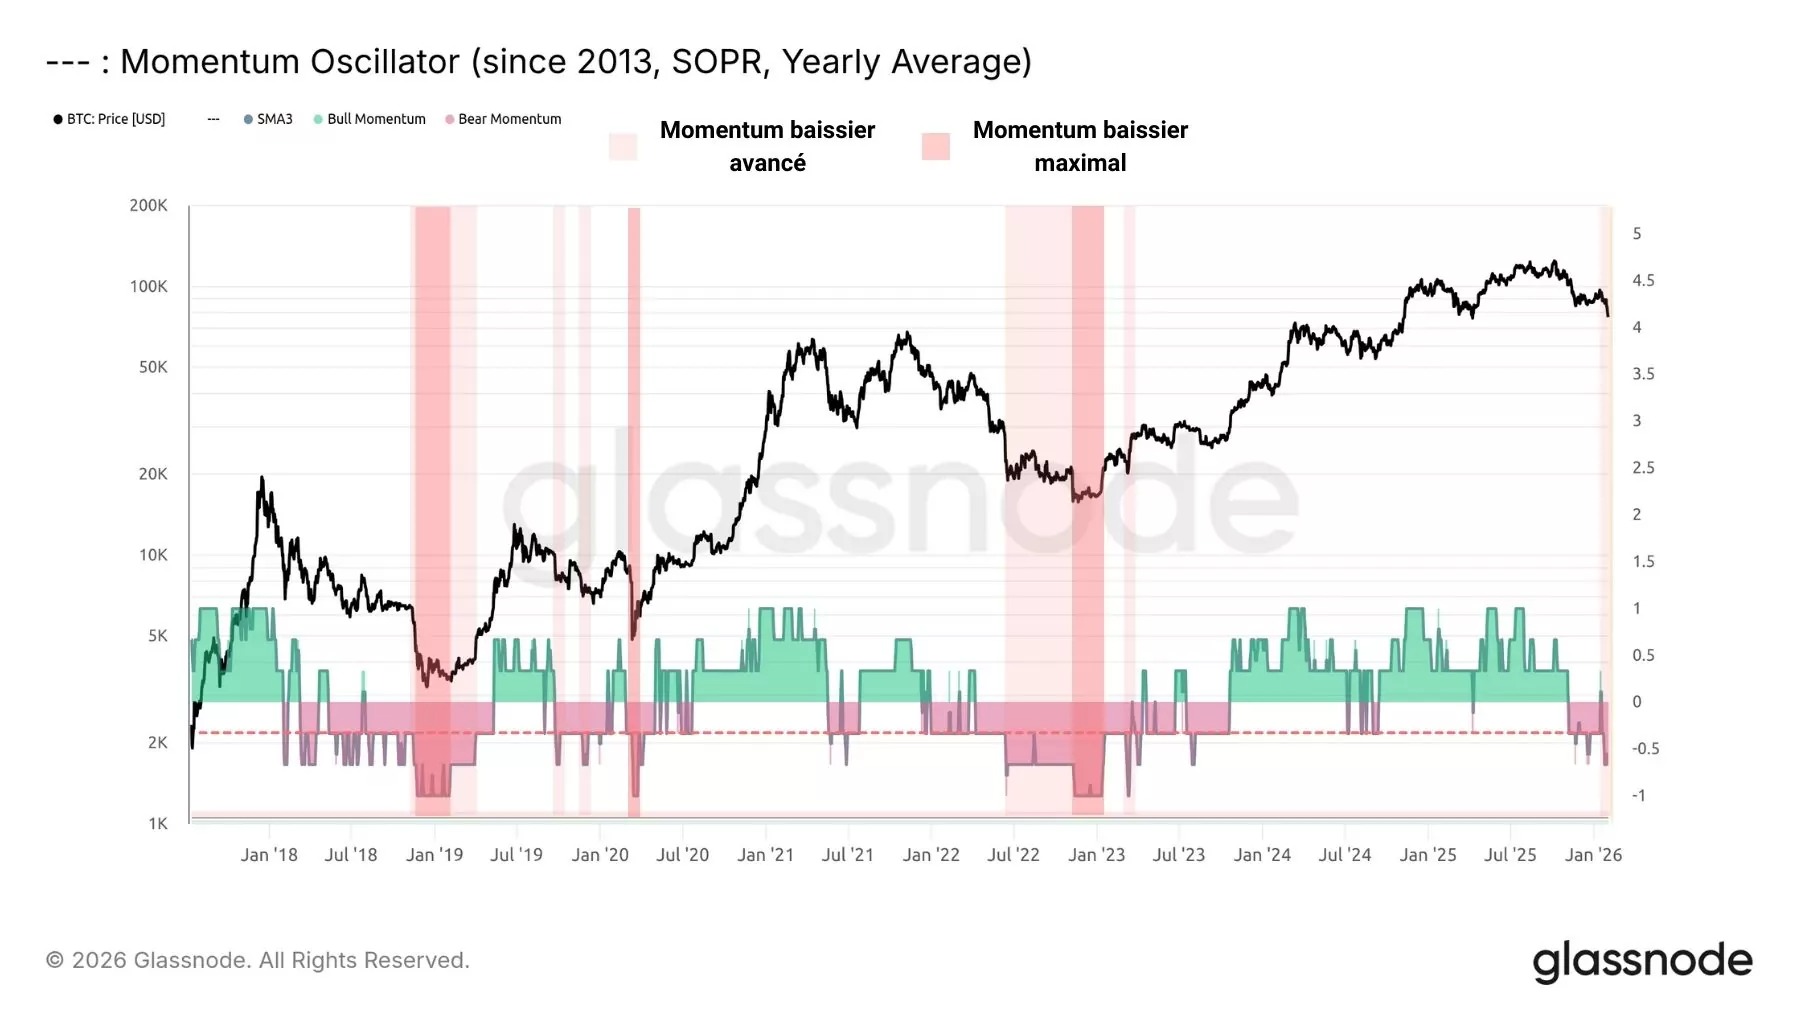
The BTC Momentum Oscillator aggregates data on supply profitability, investor behavior, and profit/loss taking to produce a synthetic signal.
It is currently displaying bearish statistical signals, describing a deteriorating environment where corrections are gradually causing investors to capitulate. However, the bearish momentum has not yet reached its peak, with the average market break-even point at lower levels.
Areas of opportunity
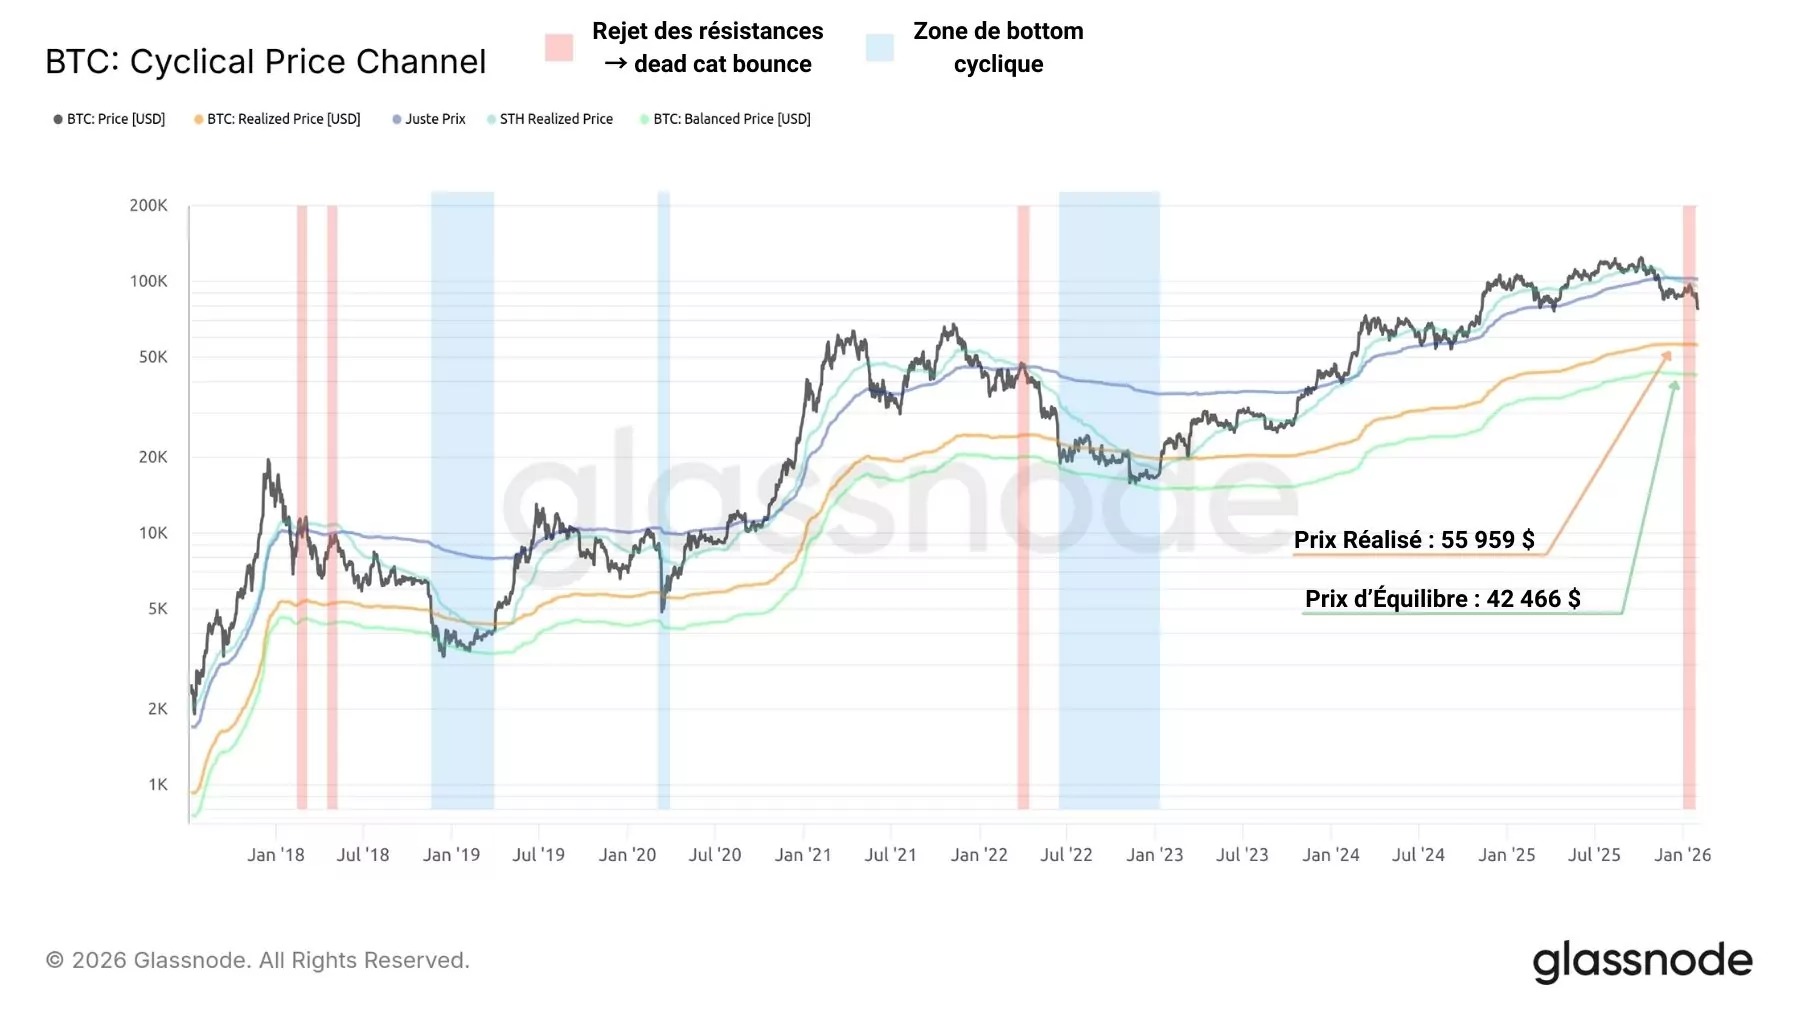
After rejecting its on-chain resistance levels, BTC is entering the advanced phase of its bearish cycle. Historically, this type of configuration has led to a price increase towards two key thresholds:
- the realized price, corresponding to the average base cost of BTC in circulation;
- the equilibrium price, which weights this latent profitability by the age of the supply.
In previous cycles, bearish peaks were reached below these two levels, during a final capitulation leading to a gradual exhaustion of selling pressure. These thresholds are currently in a range between $55,000 and $40,000, corresponding to a potential decline of -56% to -68% from the October 2025 ATH.
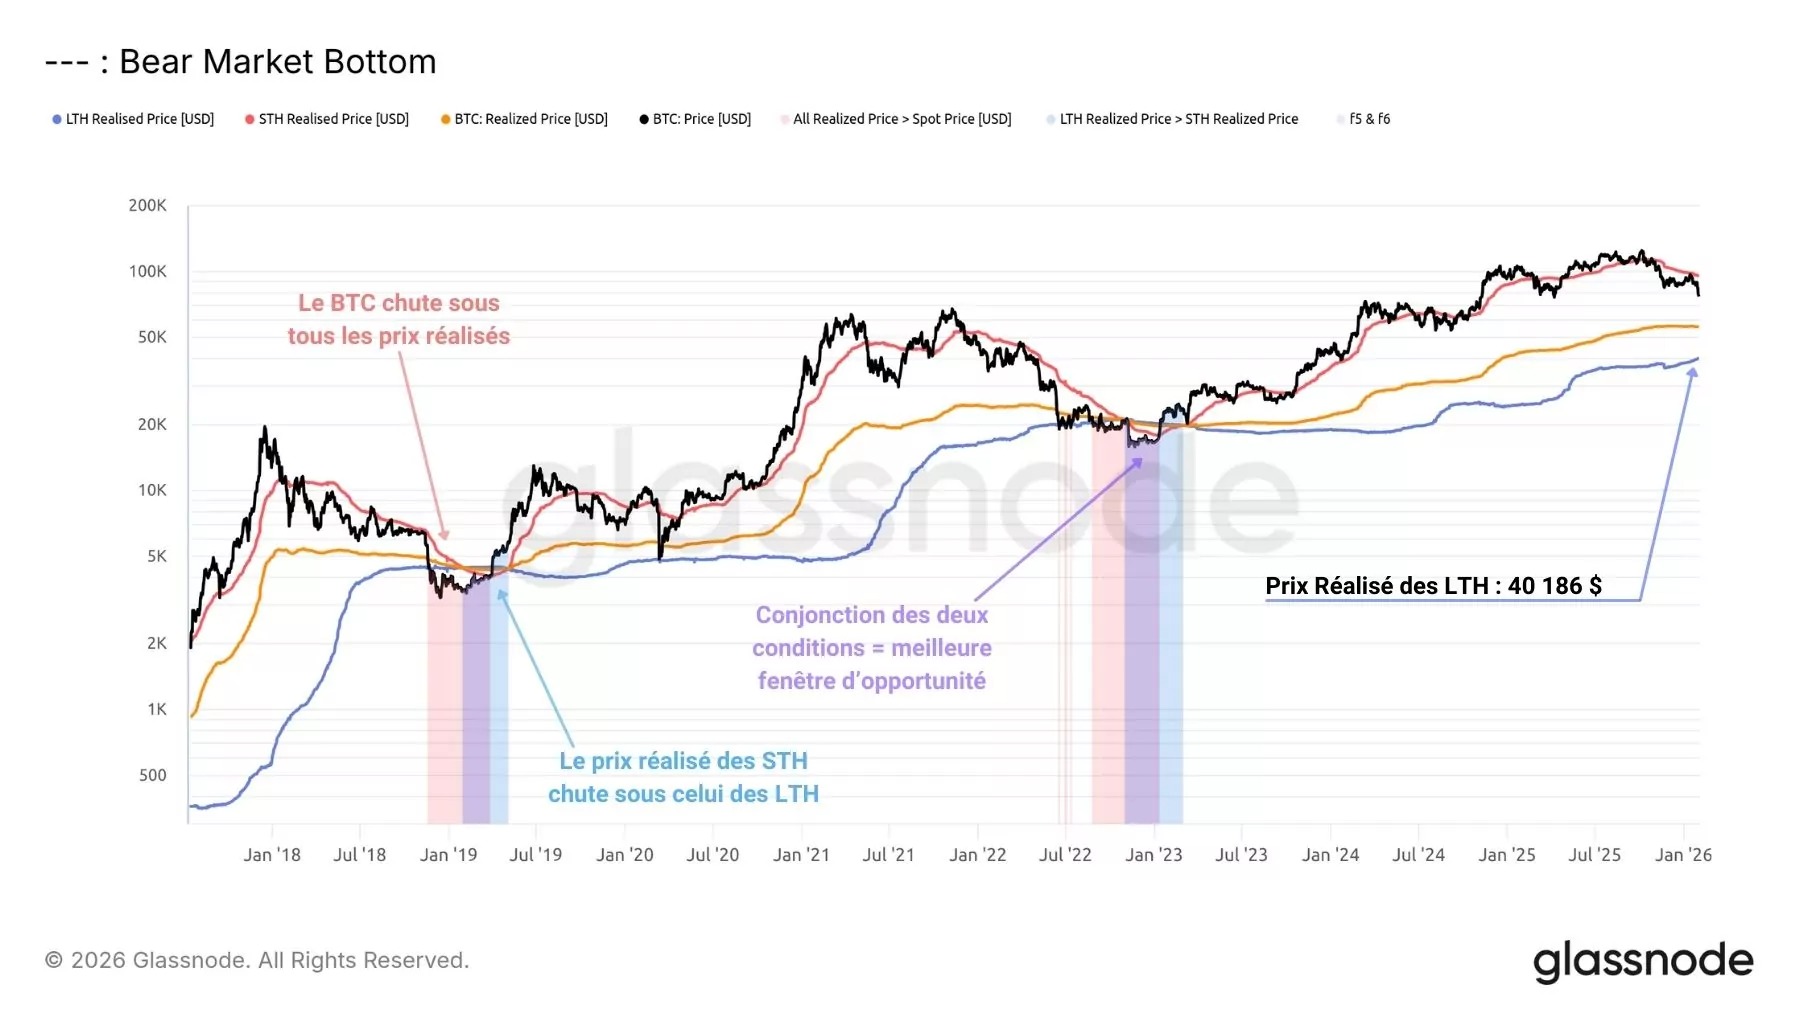
By combining the realized price and its short- and long-term variants, it is possible to identify the typical stages of a bear market floor formation:
- The BTC price falls below all of its realized prices, indicating widespread pressure on all investor cohorts.
- The realized price of short-term investors falls below that of long-term investors, signaling that new entrants are buying at a lower price than the most seasoned players;
- The spot price rises above the realized price, allowing short-term profitability to support a new growth cycle.
A window of opportunity lasting a few weeks typically forms when steps 1 and 2 overlap. It describes a gradual return to equilibrium after the final capitulation.
At this stage, the BTC market is still far from these conditions, which could take several months to materialize. Given that previous bear cycles have lasted an average of one year, this phase could emerge from October 2026 onwards.
Summary of this on-chain analysis of Bitcoin (BTC)
BTC confirms its dead cat bounce scenario and is progressing towards the advanced phase of its bearish cycle, following the bull market of 2023–2025. This dynamic marks the onset of deteriorating market conditions, where declining profitability is gradually pushing investors to capitulate. However, the scale of recent losses remains limited compared to those seen in the final stages of previous bear markets (December 2018 and December 2022).
This suggests that significant buying opportunities could still emerge in the coming weeks and months. Historically, bear market peaks have been reached below the realized price and the equilibrium price, levels at which final capitulation occurs, accompanied by a gradual exhaustion of selling pressure. These thresholds are currently in the range of $55,000 to $40,000, corresponding to a potential decline of -56% to -68% from the October 2025 ATH.