
Bitcoin may have hit its low last week, although confirmation on the daily timeframe is still needed to validate this. The pattern forming on lower timeframes remains encouraging, however, offering a solid support zone for price action.
The end of the U.S. budget impasse is imminent
As of Monday, November 10, 2025, at 12:44 p.m., Bitcoin is trading around $106,000, following a rebound late last week.
The U.S. government shutdown is entering its 40th day since the start of the budget impasse in the United States. Pressure is mounting, but the latest reports suggest the possibility of a consensus in the coming days.
In this context, the markets could regain momentum, with the expected resumption of macroeconomic data releases.
An end to the budget impasse—though it would merely mark a return to normal—would lift a significant burden from the markets by dispelling some of the uncertainties currently weighing on the state of the economy.
However, this situation remains a double-edged sword: sharp corrections could occur if upcoming data contradicts current expectations, which are currently geared toward another rate cut in December.
In the Bitcoin derivatives markets, compulsive buyers seem to have calmed down; the drop below $100,000 has had its effect, and the momentum now appears to be shifting toward sellers.
Consolidation phases seem to present an opportunity for the selling side to position themselves, and buyers are relatively scarce despite prices rising steadily.
This restored balance appears to point toward a calmer phase in Bitcoin’s price action.
Bitcoin’s performance indicators confirm a slight short-term rebound against the dollar; against Ethereum, a balance seems to be taking hold, with fluctuations of less than 2% across all time frames.
The rebound is taking shape, but it lacks…
Bitcoin is in a situation where the weekly, 3-day, and daily trends are now bearish. This isn’t a very comfortable situation, but it remains a pattern we’ve already observed during major consolidation phases in this cycle.
Indeed, in September 2024 and again in April 2025, Bitcoin absorbed liquidity below its 50-week moving average while exhibiting predominantly bearish trends.
In this situation, it seems reasonable to anticipate a shift in its own downward bias and to consider short positions.
Thus, the risk of seeing the next peak fall below the previous one increases, confirming the continuation of a trend that will only be called into question on the weekly chart if the price breaks above $116,300.
For those looking to enter a long position, it will be necessary to monitor the daily timeframe, which could provide early signals of a recovery while offering faster invalidation levels.
On this timeframe, the price still needs time to develop a reliable structure to build upon.
However, an initial positive signal could emerge if prices break above the $107,000 to $108,000 range; should this attempt fail, prices could retreat to the $100,000 to $104,000 consolidation zone, where we could form a new higher low, thereby establishing a solid new base.
If, however, BTC finds the strength to break through this first zone, then the next challenge lies between $110,500 and $112,000—a key level across multiple time frames that must be reclaimed to pave the way for $120,000.
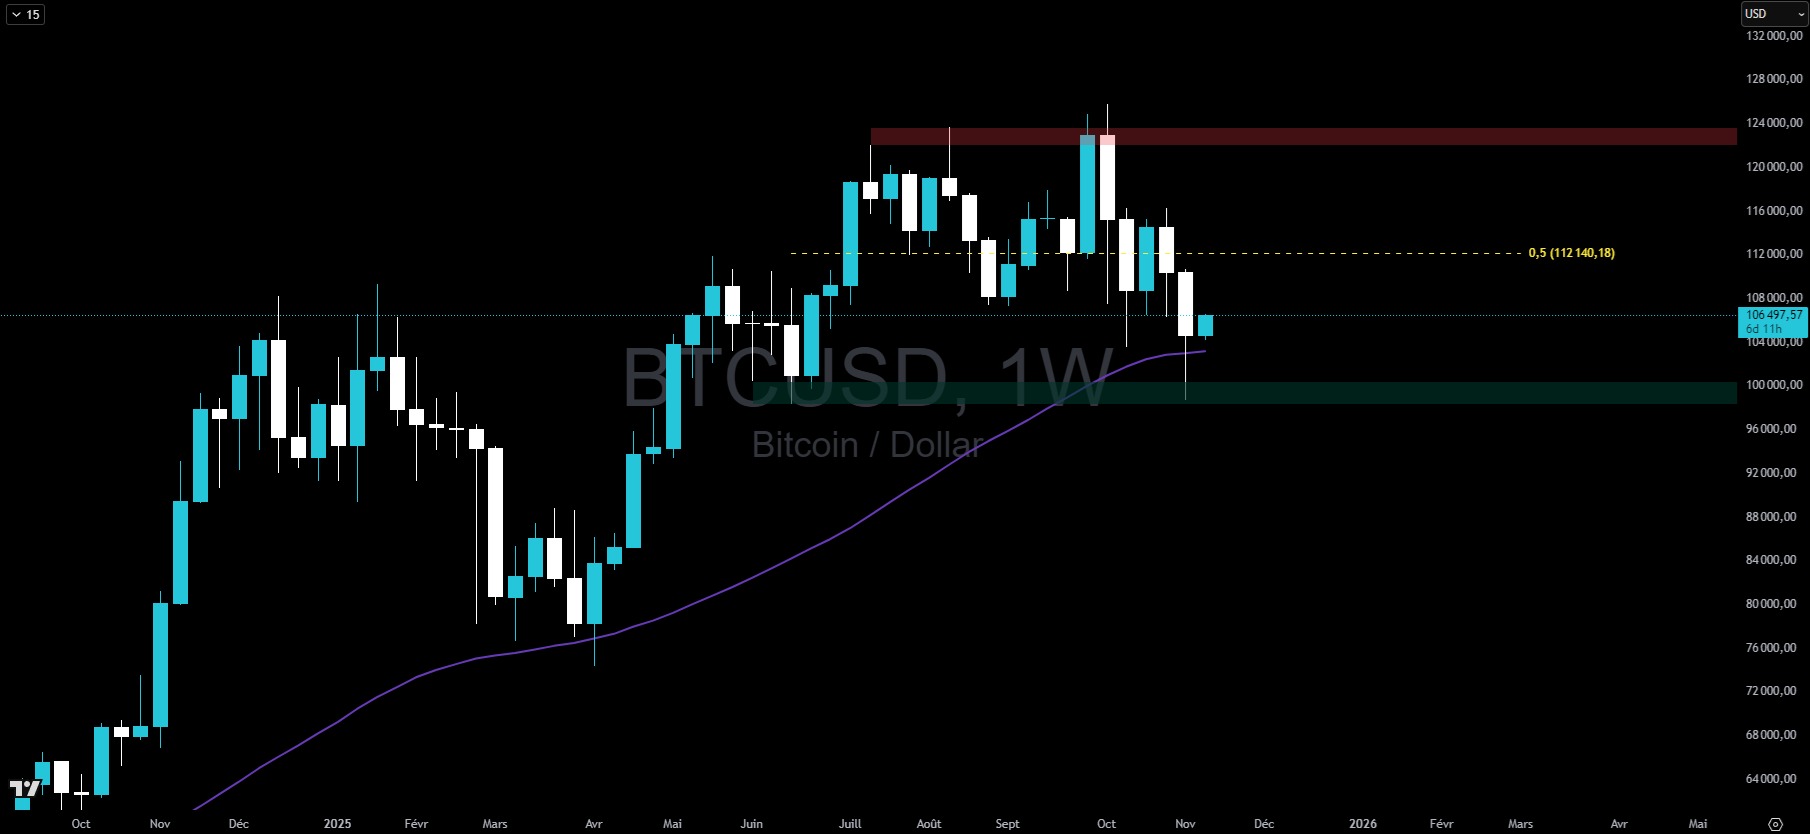
Bitcoin price chart on a weekly timeframe
Any prospect of a bullish recovery would have to be put on hold if Bitcoin were to break below last week’s low ($98,900). A return to the H4 price pattern that has been forming since Wednesday, November 5 (between $100,000 and $104,000) cannot be ruled out in order to form the daily low mentioned above.
We can also anticipate a new wave of buying below the November 4 low, but in that case, the reaction would need to be swift and demonstrate massive buyer participation—a reaction that was lacking at the start of last week.
To end on a positive note, we can observe the 4-hour pattern currently forming on Bitcoin, which shows a clear intention to stem the ongoing decline by realigning bullish highs and lows. This pattern could be the starting point (in a zone of major interest) for a significant rebound.
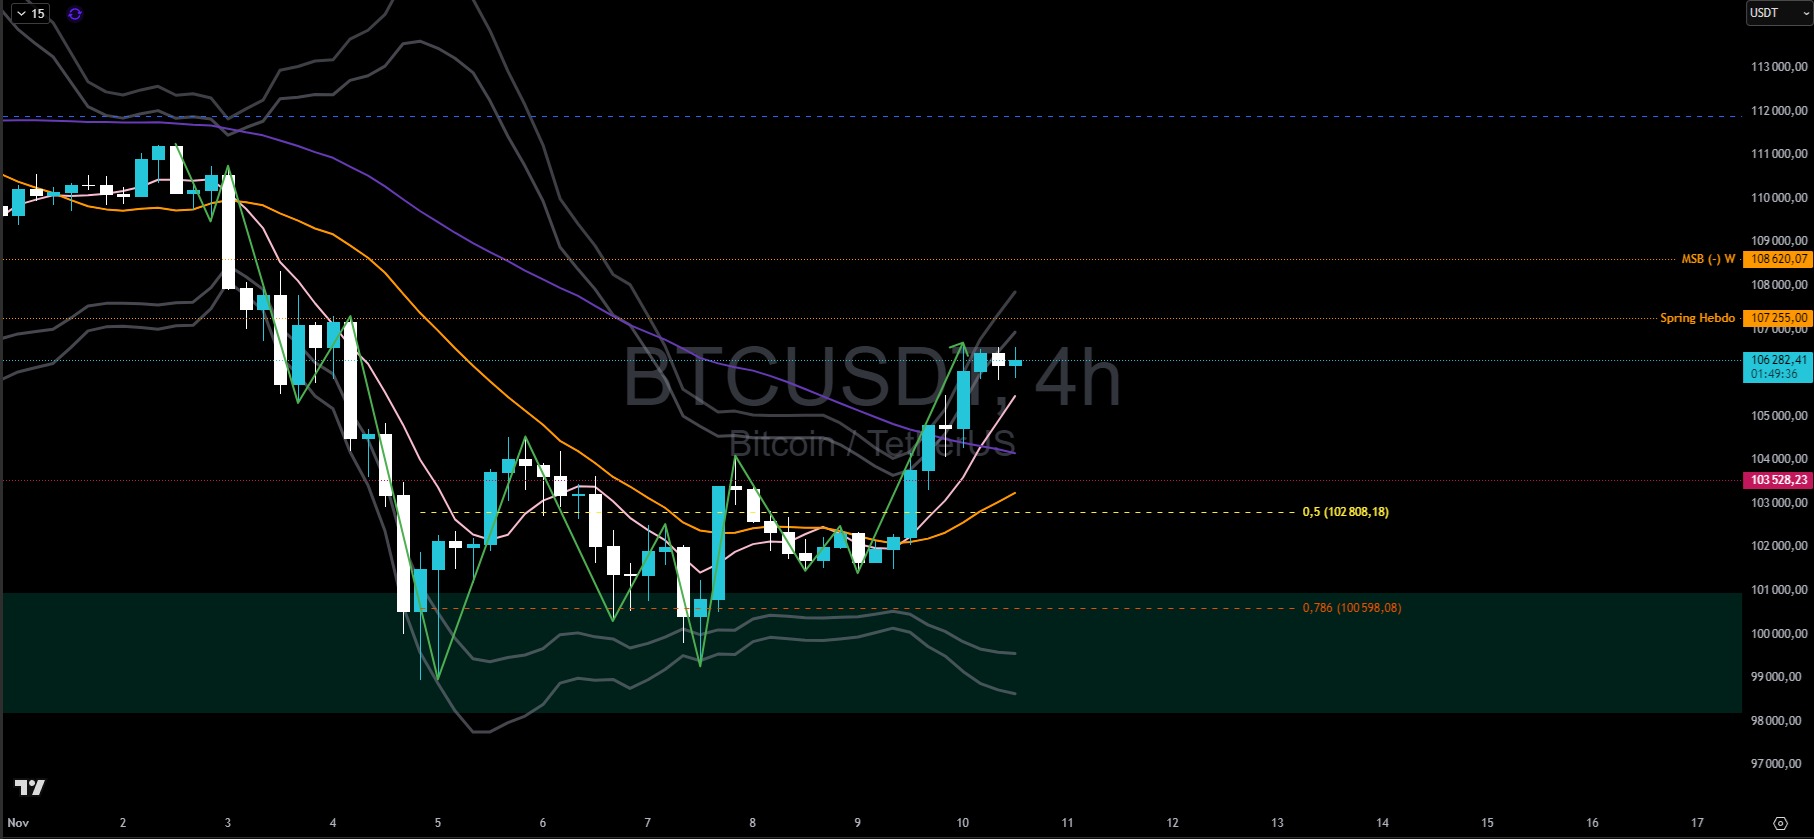
Bitcoin price chart on a 4-hour timeframe