
There is no notable demand on the spot and futures markets, which are showing a marked bearish bias. Furthermore, the current market context is very similar to the end of the bull markets observed in early 2018 and early 2022.
At a crossroads
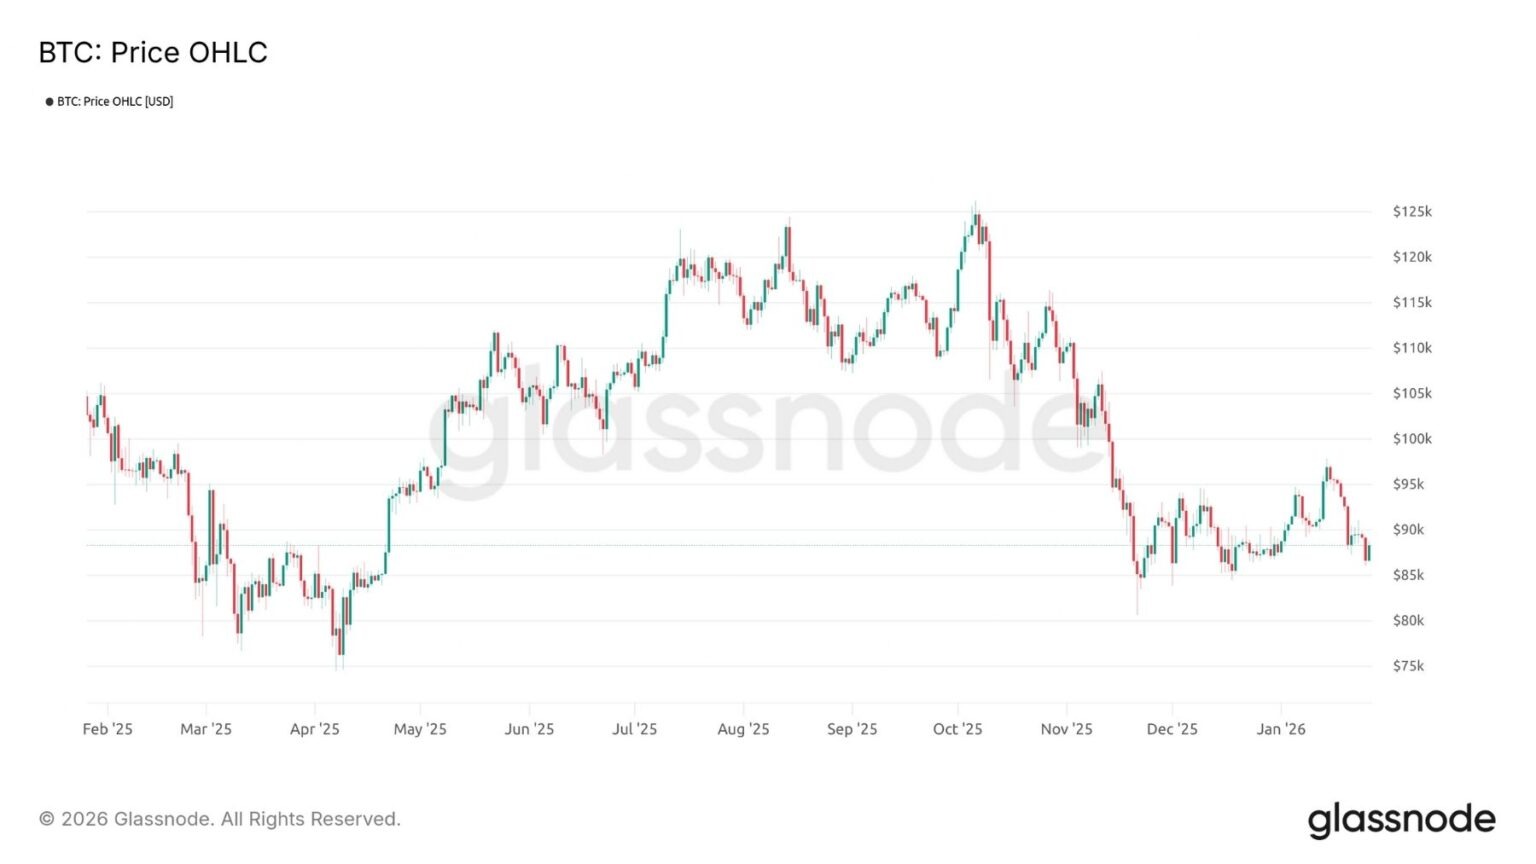
After an encouraging start to 2026, the BTC price is struggling to break through the $95,000 resistance level and maintain its upward momentum.
In the short term, the balance between buying pressure and selling behavior remains fragile and decisive:
- Either the market manages to absorb the recent selling pressure and restart a sustainable upward momentum;
- Or a deeper correction phase could take over (dead cat bounce scenario).
Which of these two possibilities will materialize in the coming weeks?
Cyclical position
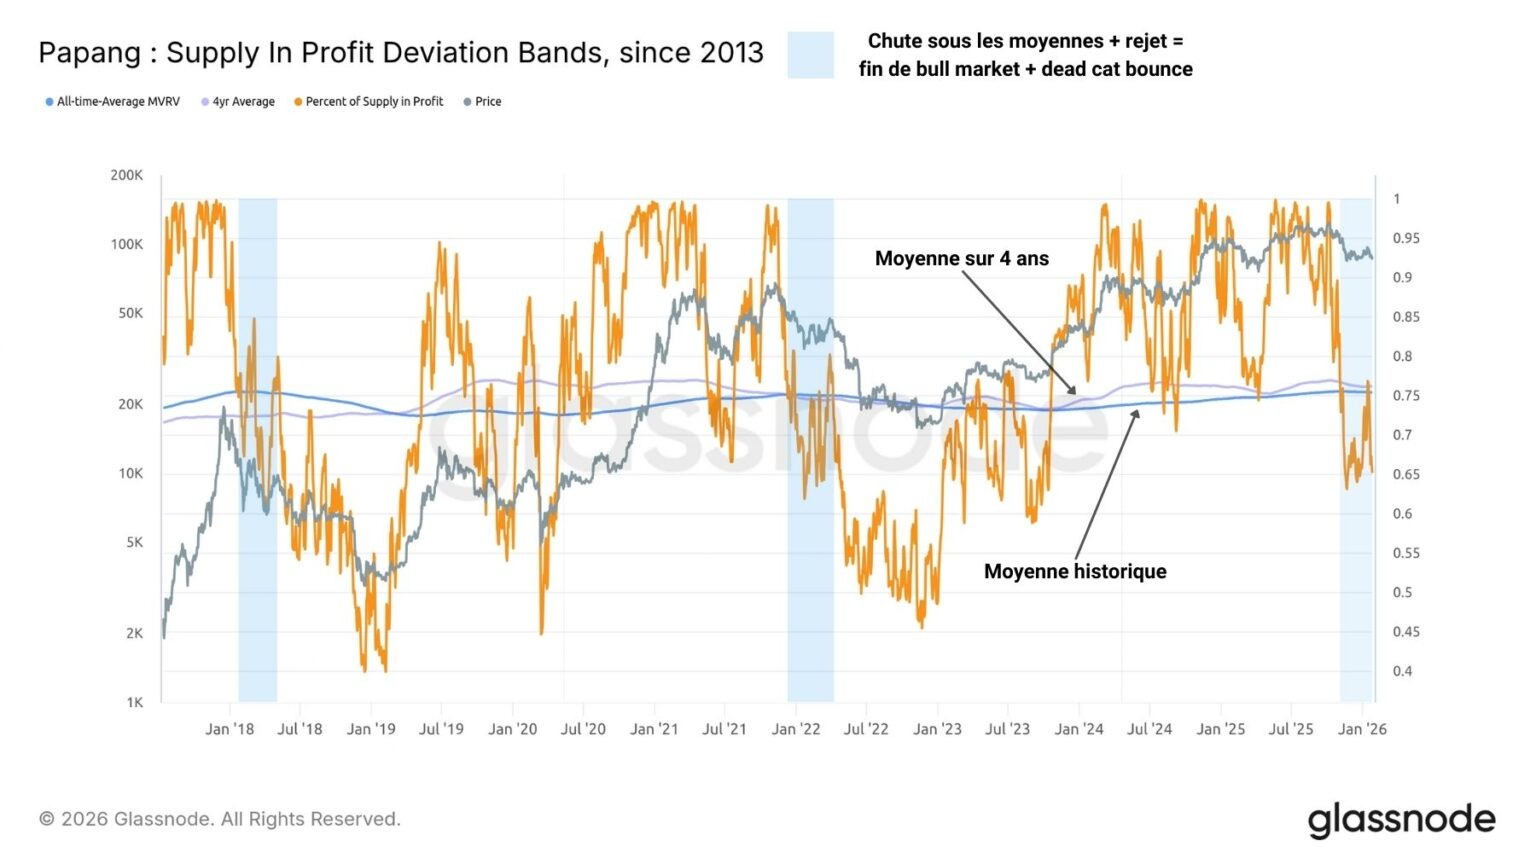
To better understand the current market situation, let’s take a step back and assess BTC’s long-term position. To do this, we can track the evolution of the percentage of supply in profit, as well as its four-year and cumulative averages. This metric measures the profitability of the circulating supply in order to estimate whether the BTC market is in an overbought, oversold, or balanced zone. The four-year and cumulative averages serve as reference thresholds to distinguish between bullish and bearish market conditions. In this regard, the correction at the end of 2025 caused the percentage of supply in profit to fall below these two levels, estimated at around 75%. While the BTC market historically exits bull market conditions when less than three out of four bitcoins are held at a profit, the rejection of this threshold in the following weeks makes the hypothesis of a dead cat bounce particularly credible.
In fact, the current market context is very similar to the end of the bull markets observed in early 2018 and early 2022. However, to confirm the start of a bear market, this dead cat bounce will need to be validated by a continued decline below the $85,000 support level.
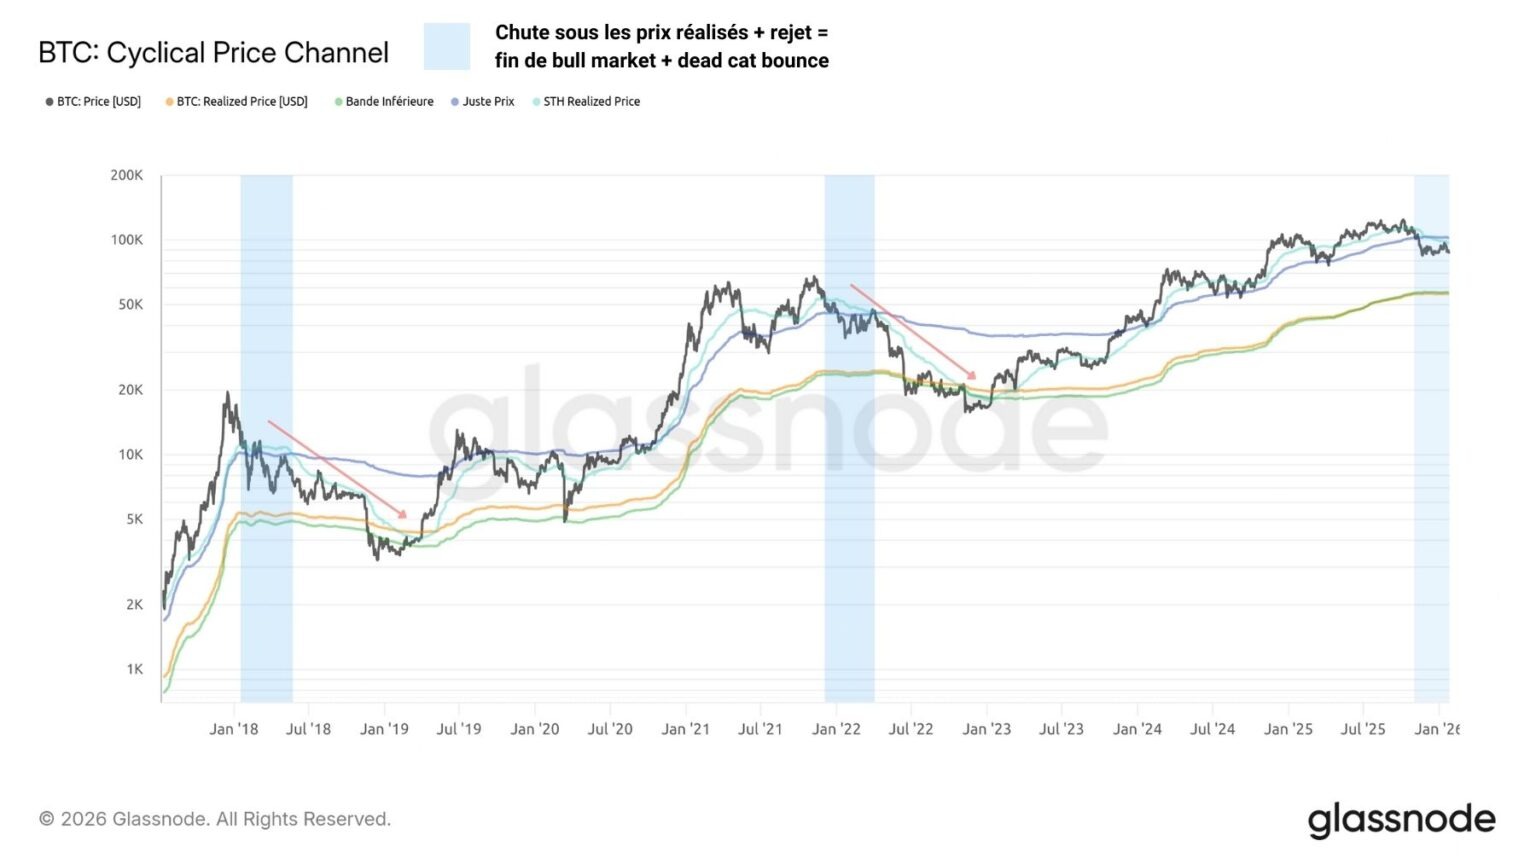
A very similar observation can be made using the “Fair Price” (blue) and the short-term average purchase price (cyan), two metrics whose functioning was detailed in our previous analysis.
By falling below these two price models in November 2025, BTC entered bear market territory before consolidating above $85,000.
The current challenge is to determine whether the market will manage to break above these two levels in order to reestablish a healthy uptrend, or whether they will act as resistance levels capable of blocking BTC’s recovery.
In recent days, Bitcoin has rejected the short-term average purchase price, further anchoring the market in a configuration similar to the end of the bull cycles of 2018 and 2022.
Supply/demand balance
In this type of context, an essential factor to monitor is the supply/demand balance:
- if there is sufficient buying pressure, the price of BTC could maintain its upward momentum and break through $95,000;
- if selling pressure takes over, the market will validate the dead cat bounce and plunge below $85,000.
In short, investor behavior plays a key role during transitions between bull and bear markets.
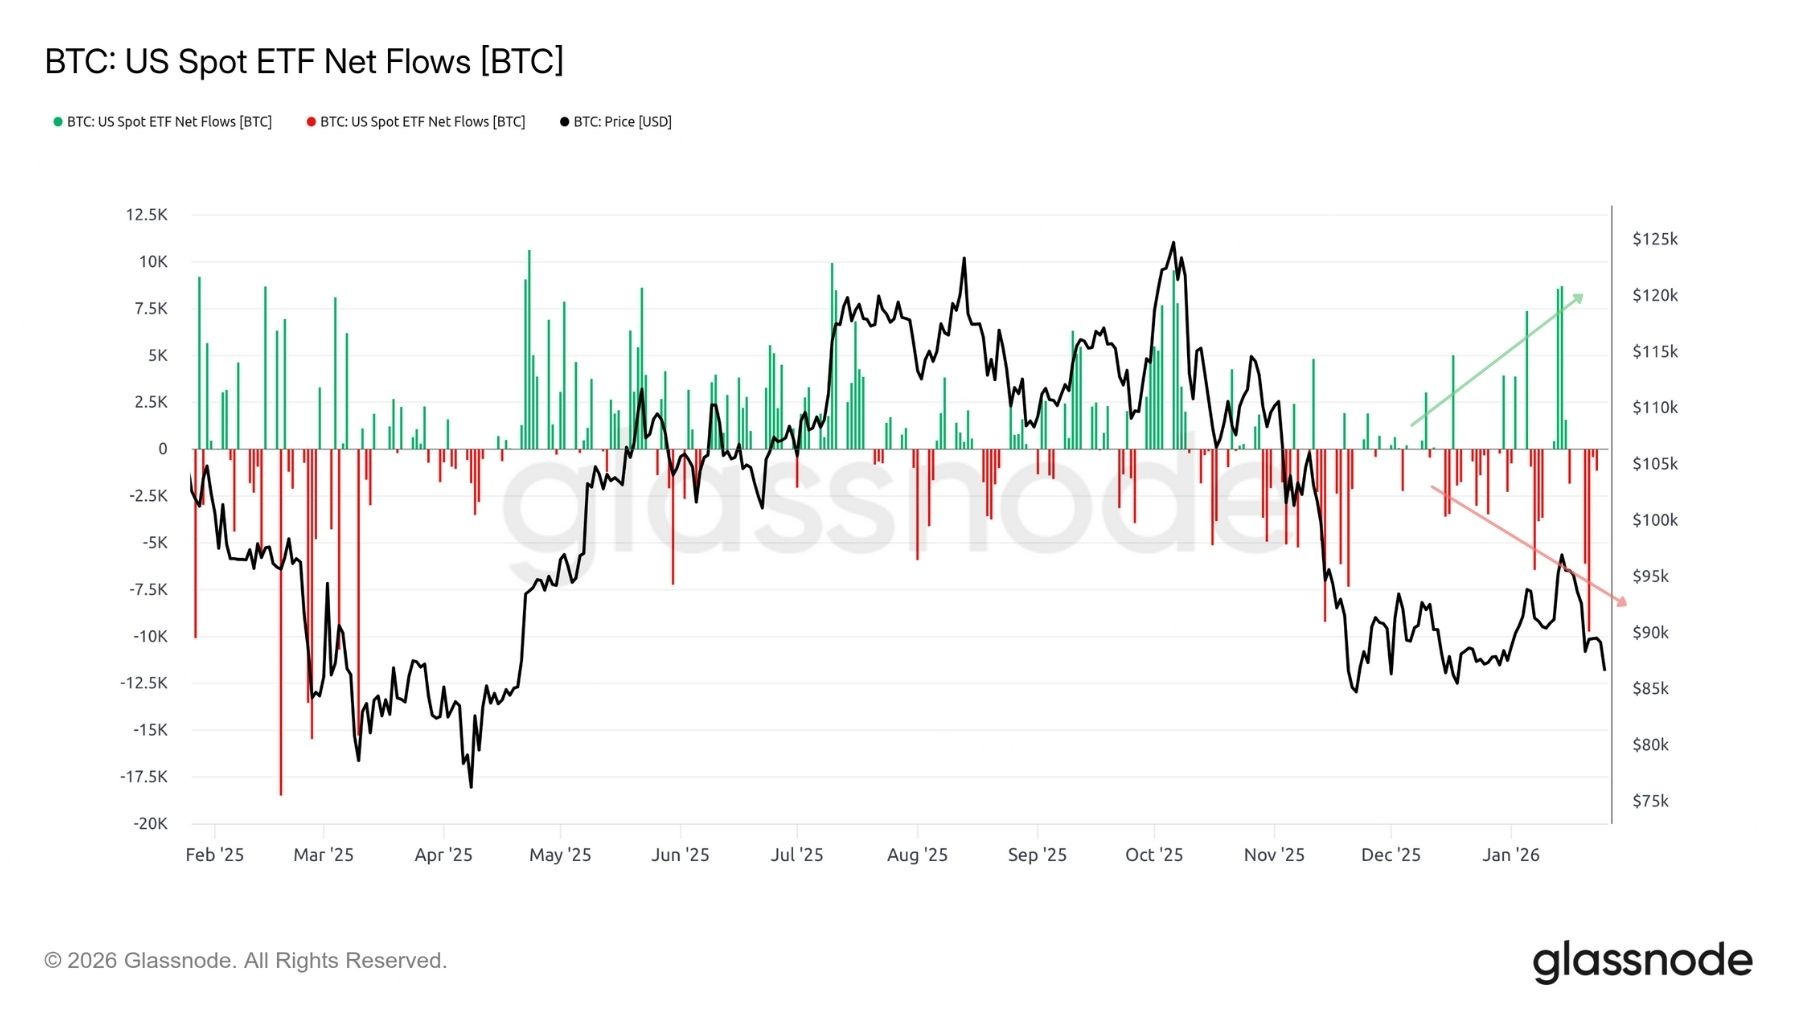
On the institutional investor side, particularly via spot Bitcoin ETFs, significant selling pressure is once again being exerted, even though large purchase volumes were still being observed in recent weeks.
It is likely that the return to the range after the failure to break through $95,000 has weakened the confidence of these players, who are now more hesitant about the short-term trend.
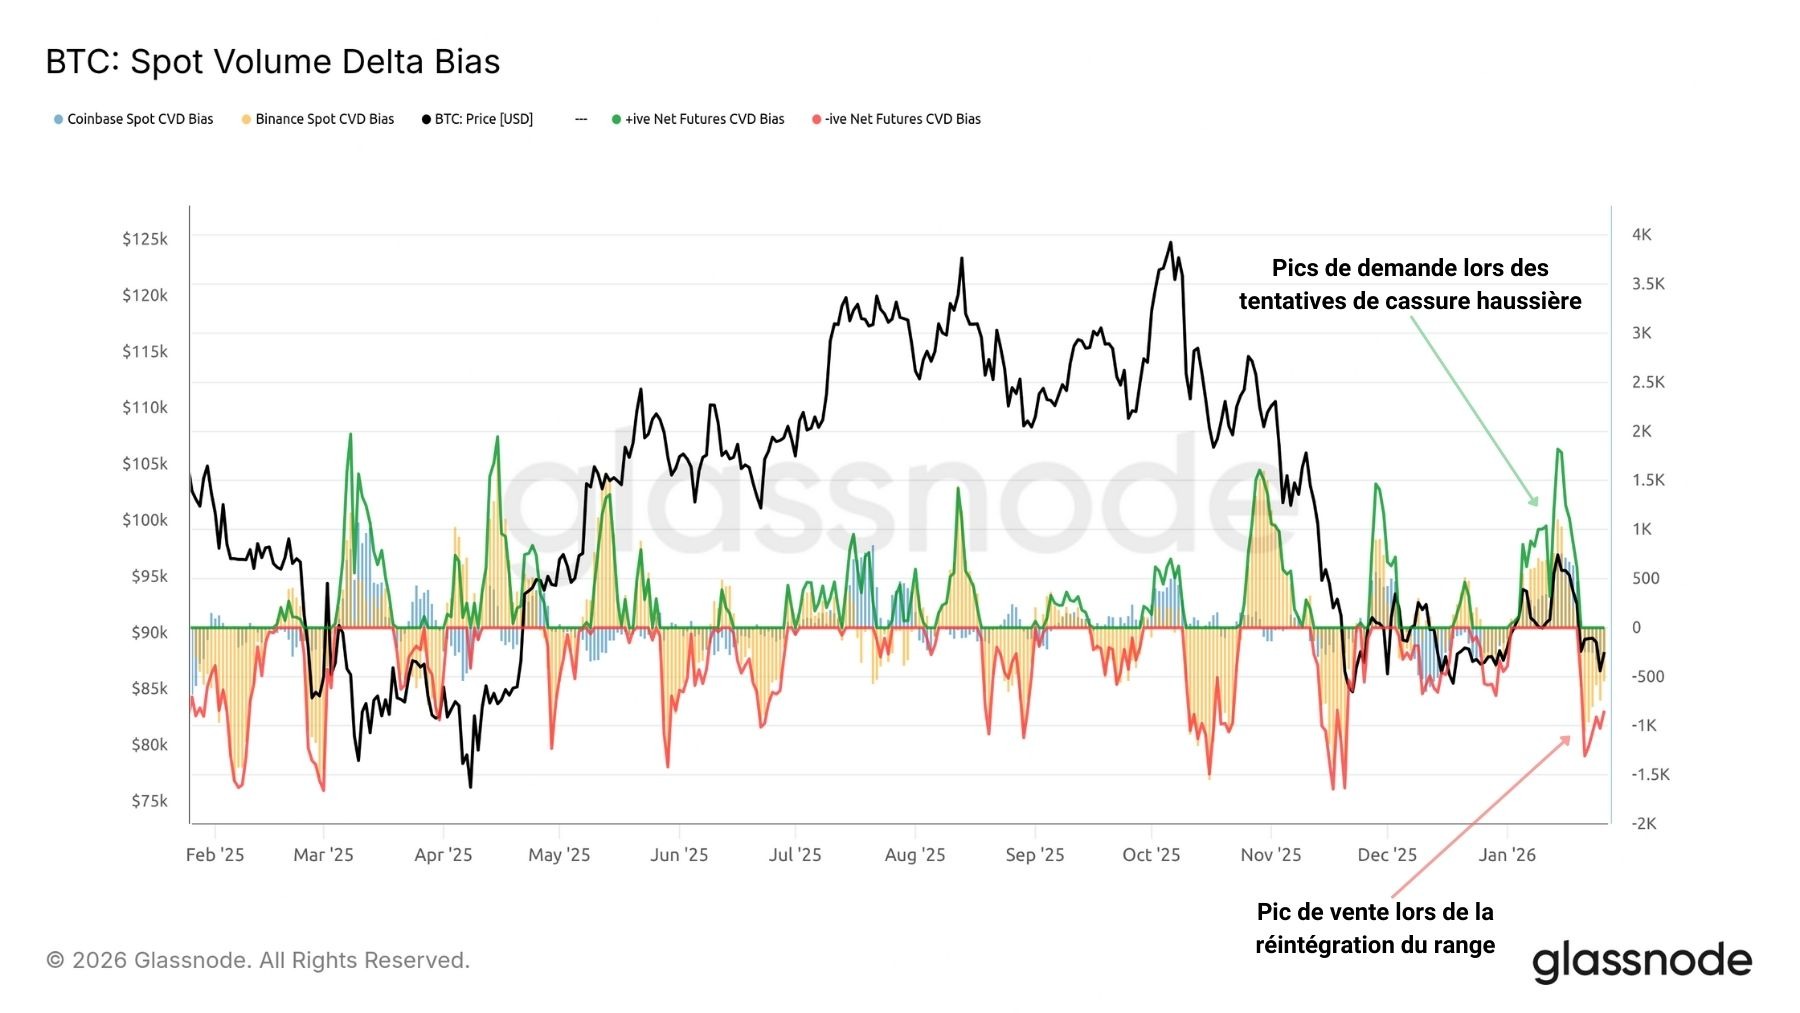
On centralized spot exchanges, buying spikes gave way to marked selling behavior this week, with more than 1,000 BTC sold on Binance and Coinbase.
While spot demand was still present during the attempt to break through $95,000, it quickly ran out of steam, signaling a lack of confidence and commitment on the part of investors.
This observation reinforces the dead cat bounce scenario, in which market participants do not have sufficient conviction to maintain their positions and end up selling their holdings in order to limit losses.
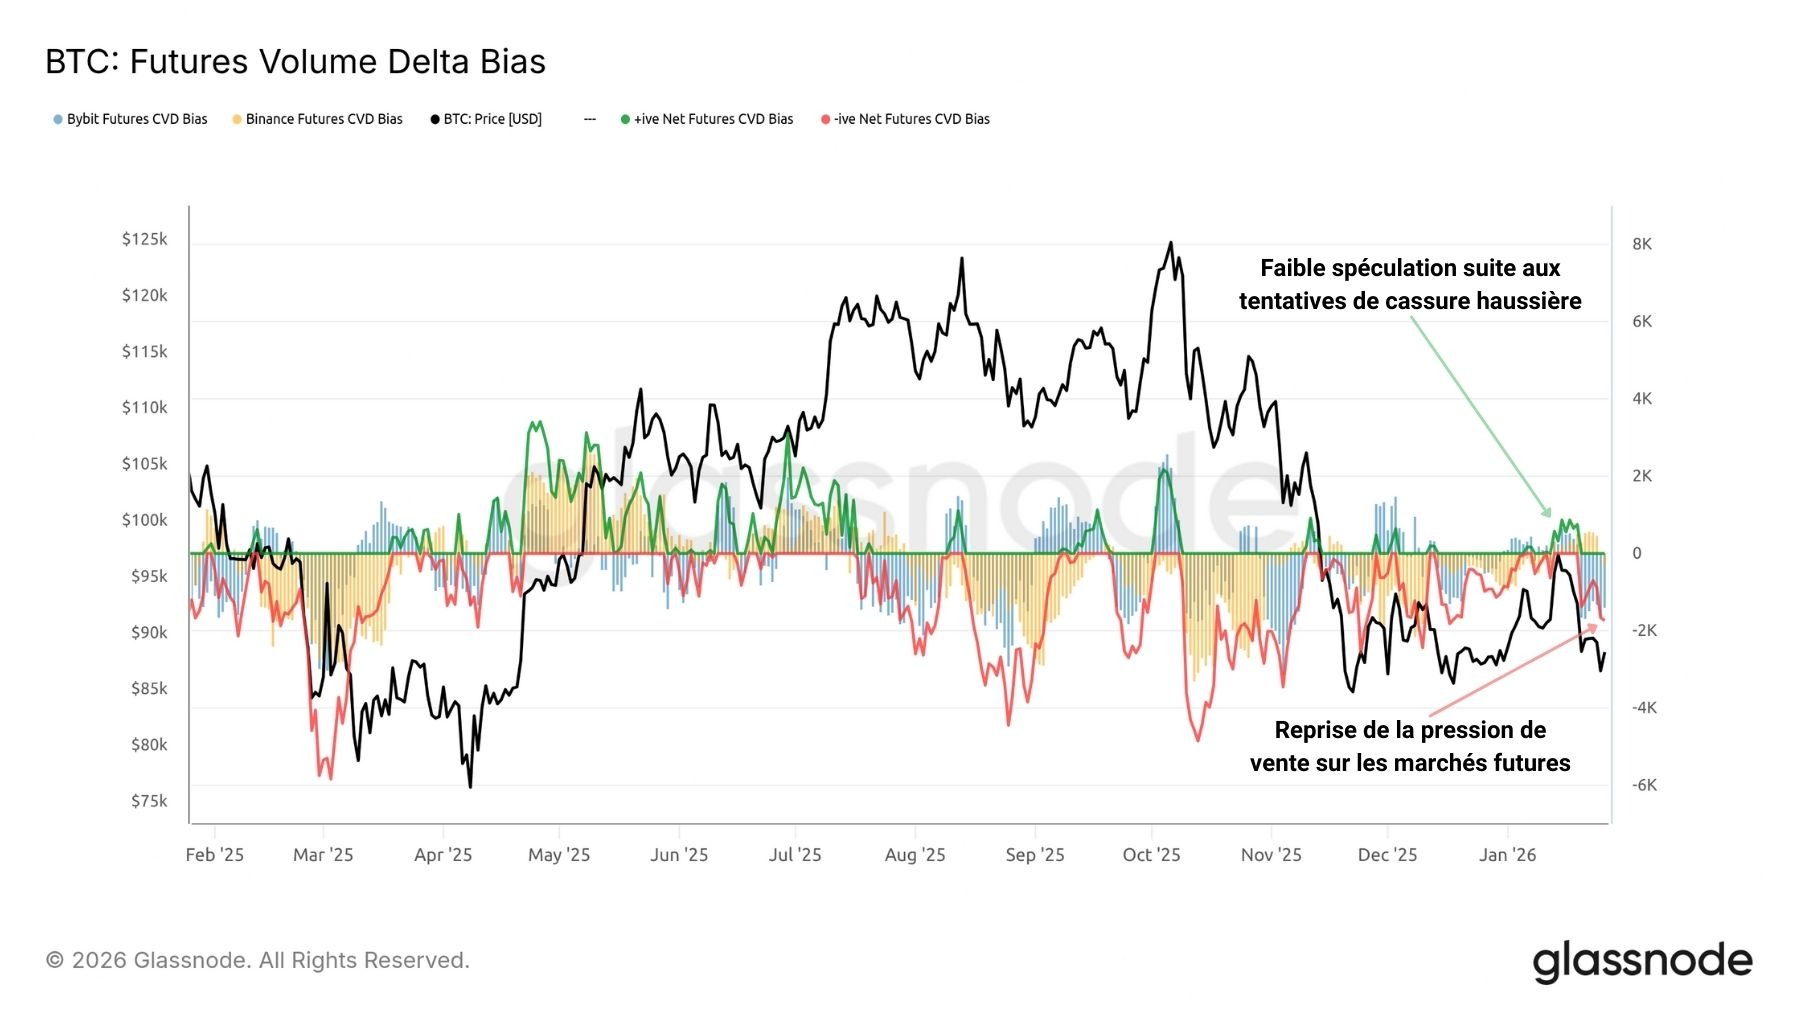
In the derivatives markets, the weak bullish speculation observed around $95,000 has turned into a resumption of net selling pressure through the opening of short positions.
The fact that speculators are more inclined to sell than to buy is a further sign of deteriorating market sentiment.
However, excessive bearish speculation could, in the short term, offer opportunities for short squeezes, which could bring temporary relief to the market.
Finally, the long positions accumulated in previous weeks also contributed to the BTC correction, generating excess speculative risk that the uptrend could have done without.
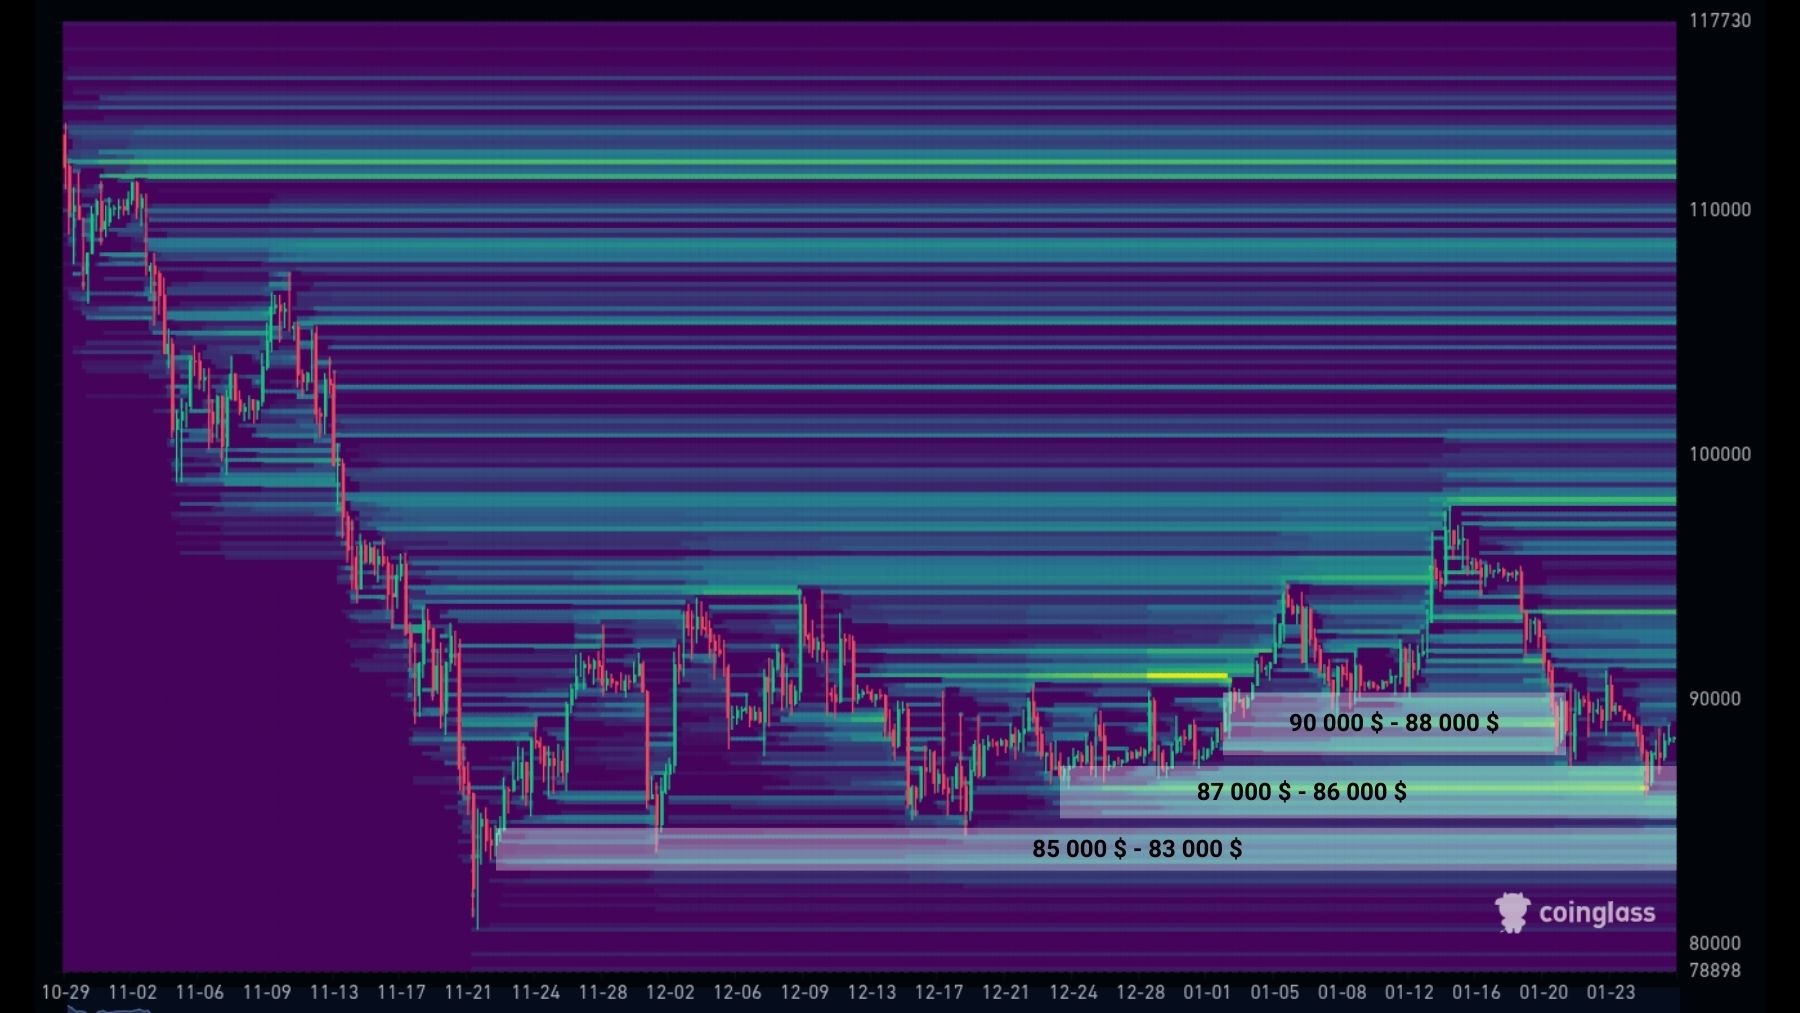
After absorbing the long liquidity below $90,000, it would be preferable for the BTC price to avoid revisiting $85,000, lest it trigger a prolonged downtrend in 2026.
Summary of this on-chain analysis of Bitcoin (BTC)
The current market context is very similar to the end of the bull markets observed in early 2018 and early 2022. However, to confirm the start of a bear market, it will be necessary to validate the dead cat bounce scenario with a continued decline in price below the $85,000 support level. In this type of configuration, an essential factor to monitor is the balance between supply and demand:
- if sufficient buying pressure emerges, the price of BTC could maintain its upward momentum and break through the $95,000 resistance level;
- if selling pressure takes over, the market will validate the dead cat bounce and plunge below $85,000.
At present, there is no significant demand on the spot and futures markets, which are showing a marked bearish bias, increasing the risk of a prolonged downtrend in 2026.