
The Merge update successfully took place last September, marking the Ethereum blockchain’s transition from a consensus running on proof of work (PoW) to proof of stake (PoS). While the Shapella update is coming in the next few weeks, what about the state of the network over the past six months? Let’s take a closer look.
Transaction fees on Ethereum are on the rise
While the average transaction fee on Ethereum hit a multi-year low of $0.97 on October 2, it has risen significantly since then and stood at $4.21 as of March 20:
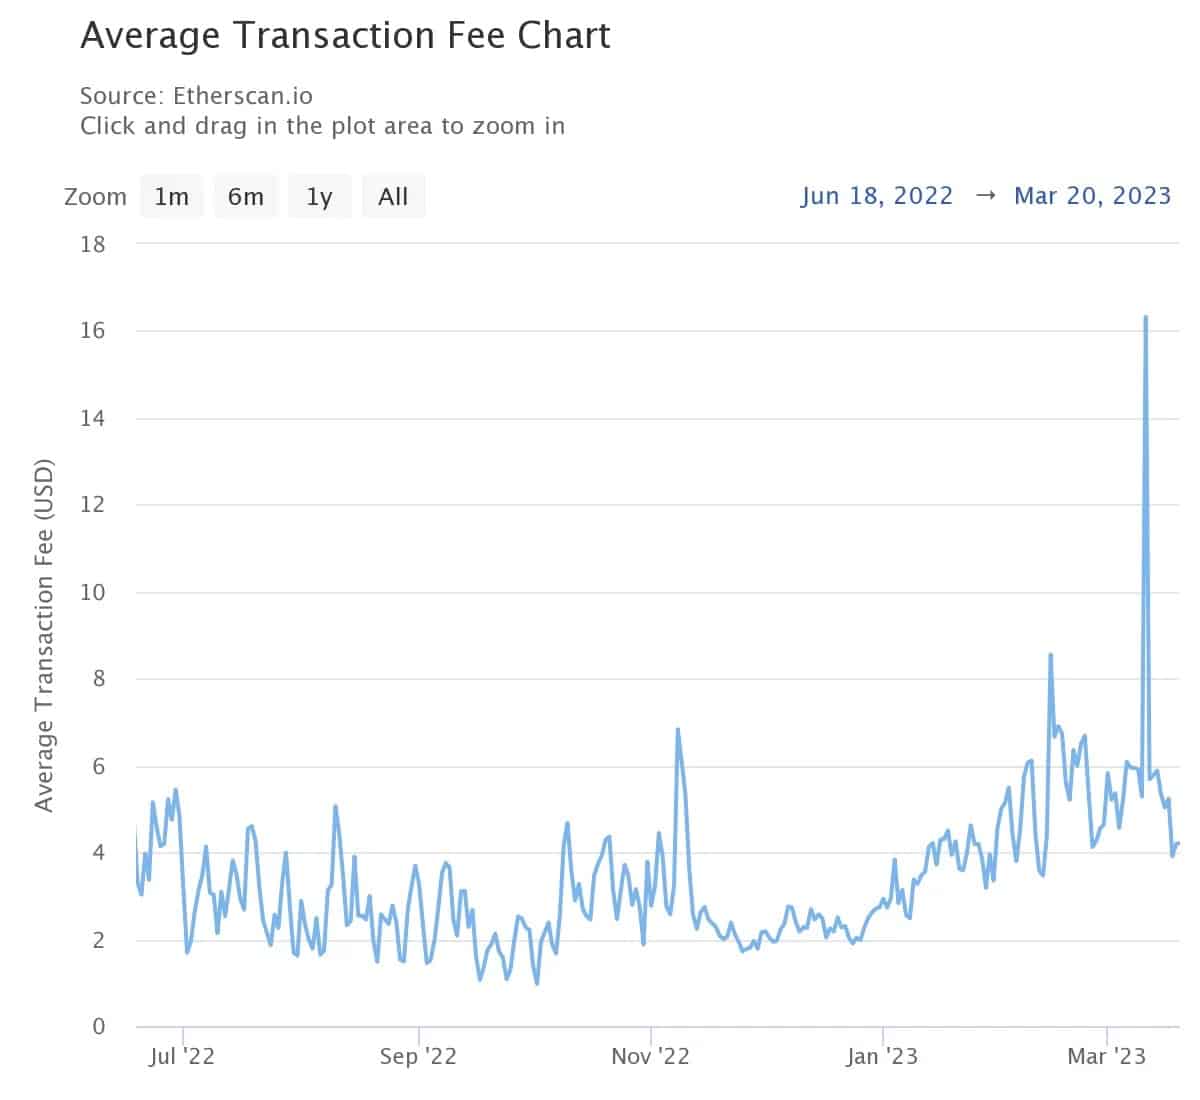
Figure 1 – Average transaction fees on Ethereum
What is interesting to observe is that some data such as the number of daily transactions or the amount of daily active addresses are certainly increasing, but not in proportions that explain this return to rising fees.
In fact, the last low in network activity was even on January 1 with 742,785 transactions. Factually, the New Year is most certainly the main reason for this sudden and ephemeral drop in activity. If December shows a slightly lower activity than the other months, these data remain roughly the same between now and the summer of 2022, easily exceeding one million transactions per day:
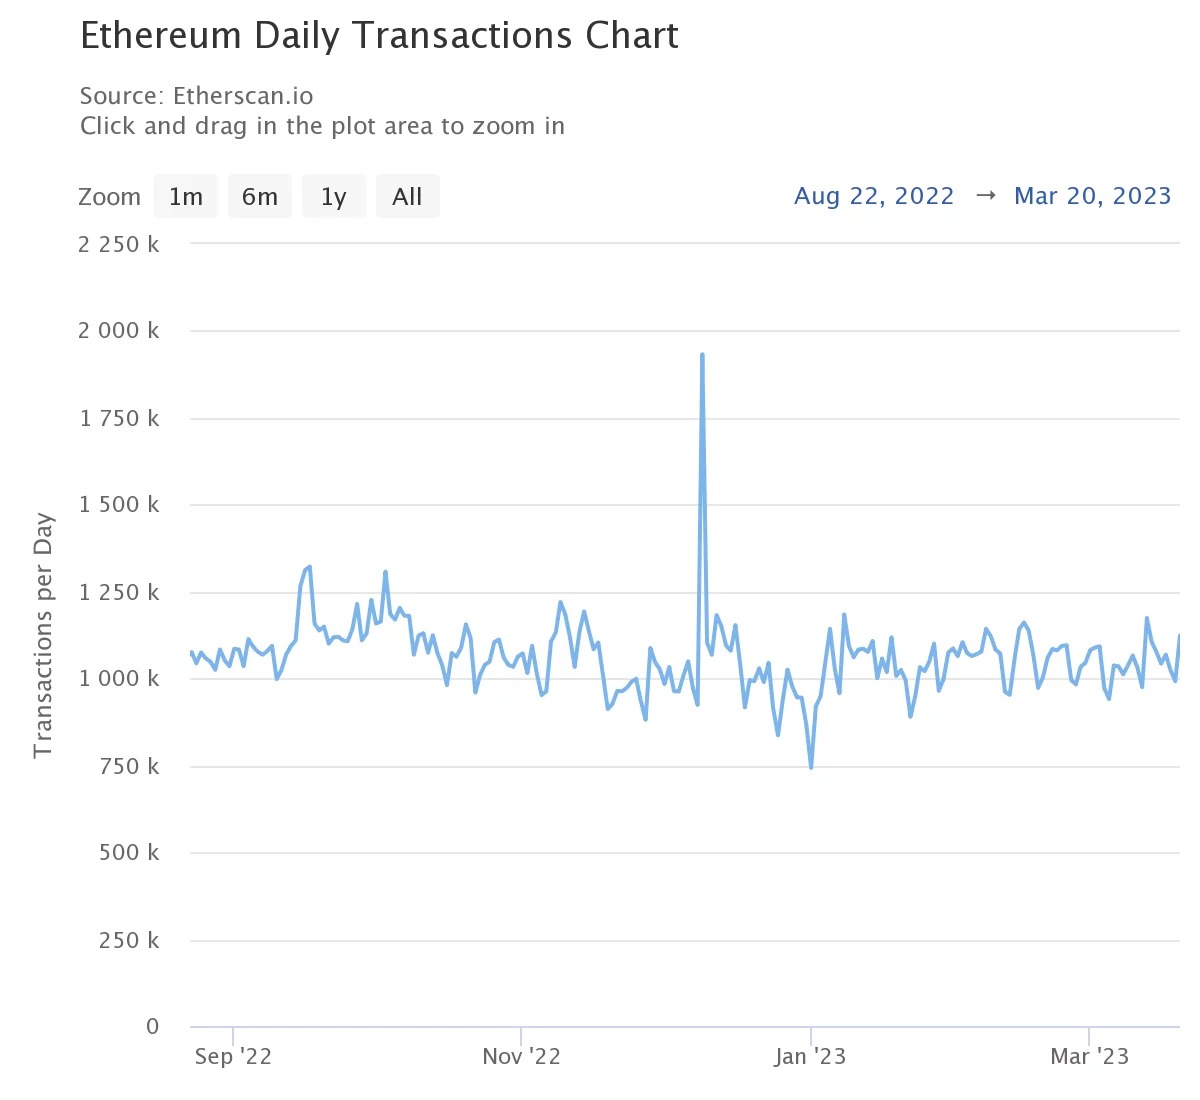
Figure 2 – Daily transactions on Ethereum
The study of the number of daily active addresses shows a similar range, with bounds more or less between 380,000 and 480,000. Over the same period, we see a few spikes or drops across these bounds, but no real upward trend.
As for the total number of addresses created on the network, Ethereum now has over 225.5 million.
An answer from the smart contracts side?
Before we go any further, it should be noted that the number of transactions alone does not explain an increase in fees. In fact, everything will depend on the nature of these transactions: a transfer between two addresses will cost less than an exchange on Uniswap (UNI) for example.
To express this, we have to look at the number of GWei that the smart contract we are using consumes. To simplify, the more functions a smart contract code uses, the more GWei it will consume for a transaction, and one GWei corresponds to 10-9 ETH.
While the ETH price has risen from $1670 to $1808 at the time of writing since October 2, this only explains 8.2% of the increase in transaction costs.
However, an interesting lead is found in the number of smart contracts created. On Dune Analytics, a compilation of data established by the analyst answering to the pseudonym of Dexy, shows that over the last 365 days, the creation of new smart contracts has increased very strongly since October. Indeed, over a period of one year, 77.6% of new smart contracts were created from October 1, 2022:
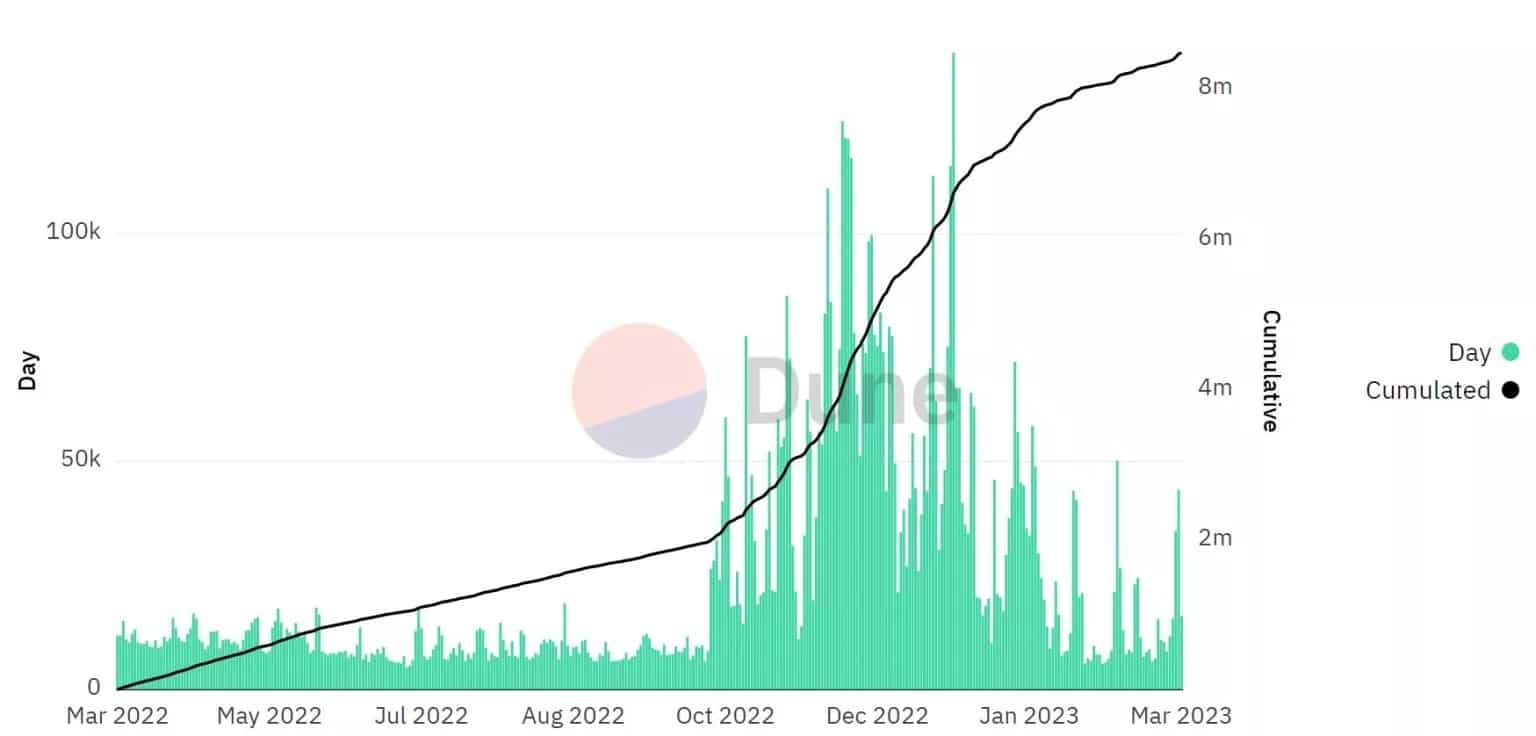
Figure 3 – Daily creation of smart contracts
There are at least two possible explanations for this. The first would be that the creators of smart contracts wanted to take advantage of the low transaction costs to proceed with the deployment on the network, thus mechanically increasing the costs.
But a more subtle reason can also be considered: the success of the Merge update. The change in consensus was a big undertaking, and it is likely that some developers chose to delay the release of their applications to see if they would work after The Merge.
Watching the creation of smart contracts in weekly data may give credence to both possibilities, as the period between summer 2021 and fall 2022 is particularly empty:
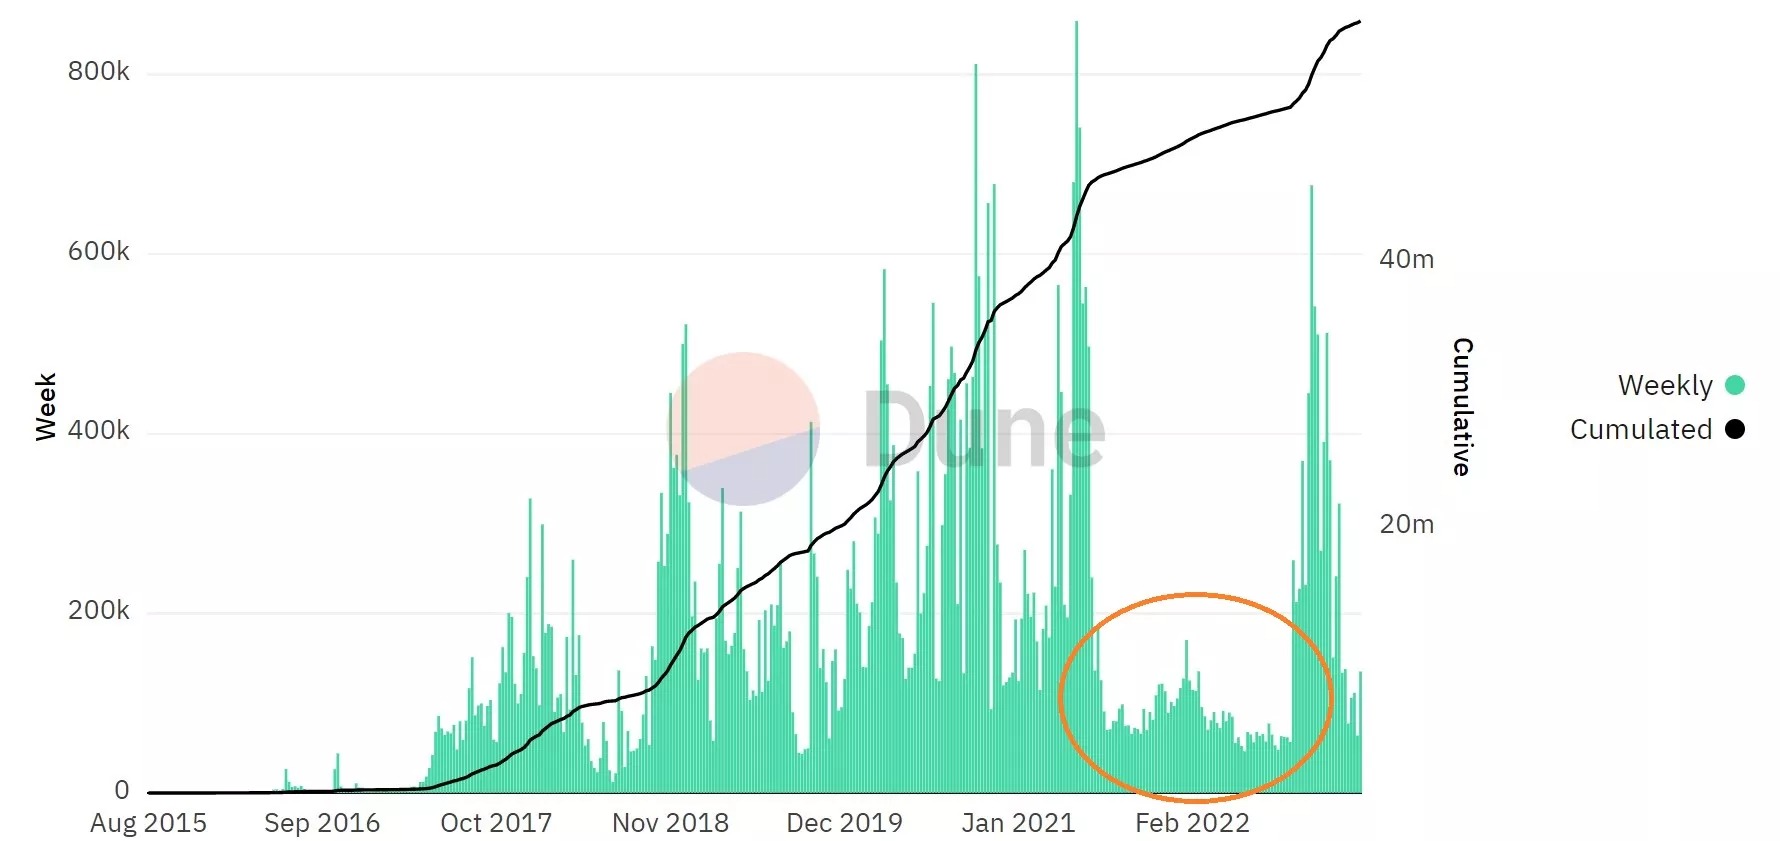
Figure 4 – Weekly smart contract creation
The point of decentralized applications
In this study, it is also important to look at the decentralized applications that generate the most transaction fees. In the daily rankings, we regularly see the same applications coming back, and in this case, Uniswap, OpenSea and Blur are regulars on the podium.
Over the last 24 hours, these three alone account for 18% of the gas consumed on the Ethereum blockchain:
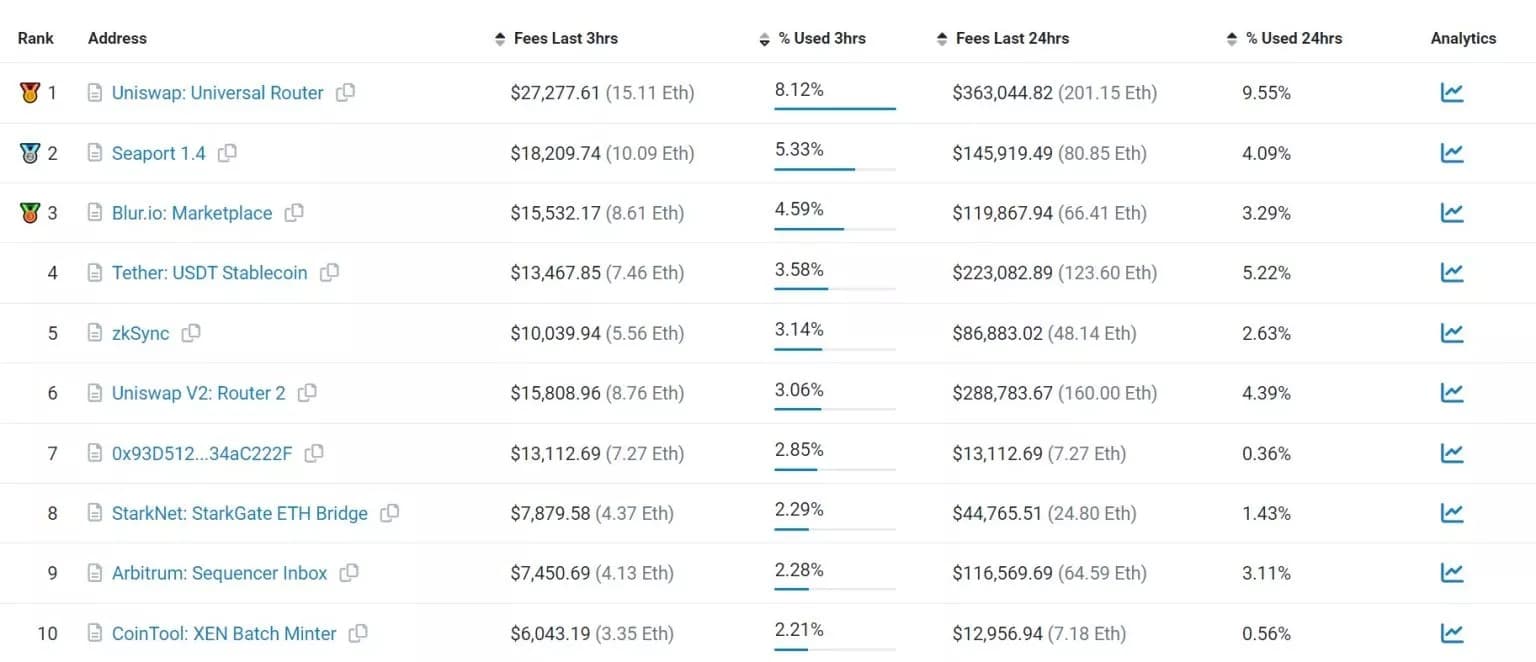
Figure 5 – Gas consuming applications
The non-fungible token (NFT) marketplace Blur has been in the news a lot in recent weeks, due to its airdrop. Many investors then generated large volumes on the platform, hoping to make themselves eligible.
In order to judge how much the network is being used by decentralized finance (DeFi) applications, we can take a look at one of them: Uniswap. The smart contract Universal Router only really got off the ground in January, so it will be fairer to look at “Uniswap V2: Router 2” in 6th place, which offers a longer track record:
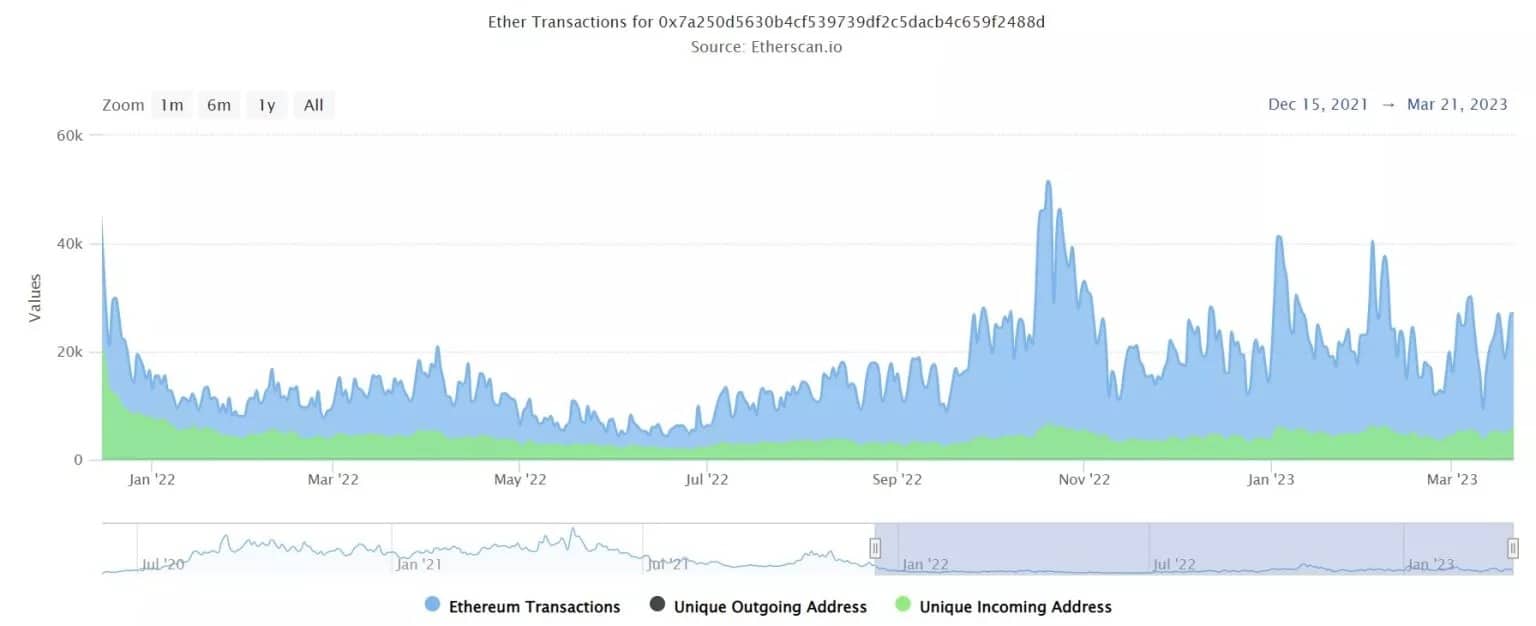
Figure 6 – Transactions on Uniswap Router 2
After a low point in the late spring of 2022, activity picked up slowly over the summer before accelerating in the early fall, often exceeding 20,000 transactions per day.
As we’ve seen, it’s hard to point to just one reason for the rising transaction fees on the Ethereum blockchain. In fact, each of the elements mentioned above may have its role to play and beyond the simple number of transactions, it is important to focus on what is behind them.
In any case, this network activity is reflected in the number of ETH in circulation. Since The Merge, these have dropped by almost 67,000 and since the London update, over 3 million ETH have been burned:
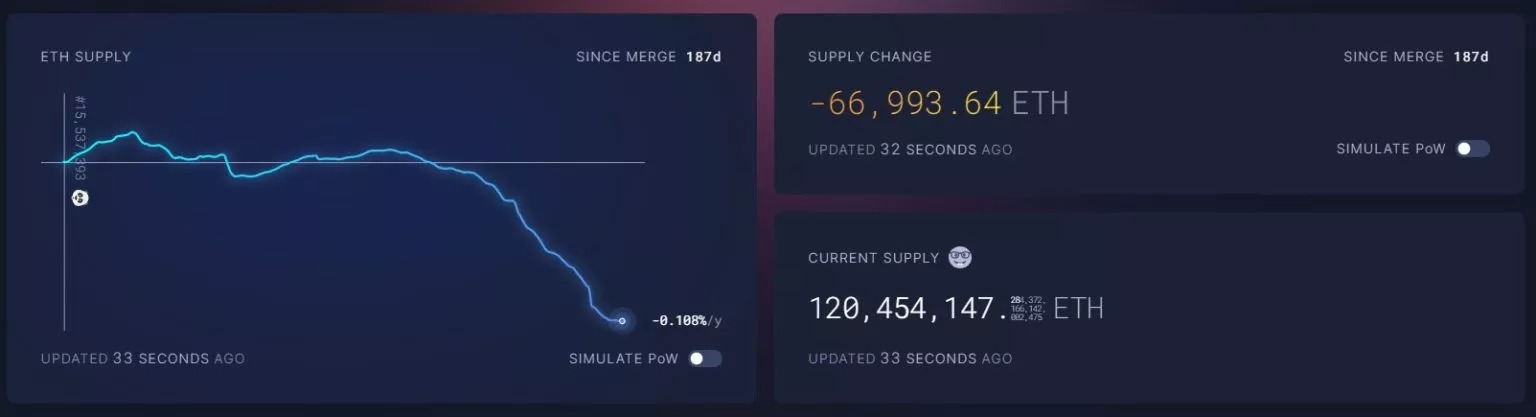
Figure 7 – Reduction of ETH in circulation