
While 2023 was marked by the bullish recovery of the cryptocurrency market, the NFT sector is recording particularly reduced activity compared to the years 2021 and 2022. With a steadily falling number of participants, fewer transactions and low volumes, NFTs no longer appeal to more than a limited portion of the audience present in recent years.
NFT: After the hype, back to reality
While 2023 has been marked by the bullish recovery of the cryptocurrency market, certain business sectors seem to be struggling to recover the interest and commitment of participants. Among the latter, the NFT sector is recording particularly reduced activity compared to 2021 and 2022.
With a steadily falling number of participants, fewer transactions and low volumes, NFTs no longer appeal to more than a limited portion of the audience present in recent years.
Today, we’ll examine this dynamic through various metrics to determine how the NFT sector is faring. First element: The share of NFT transactions out of all transactions carried out daily on the Ethereum blockchain is falling.
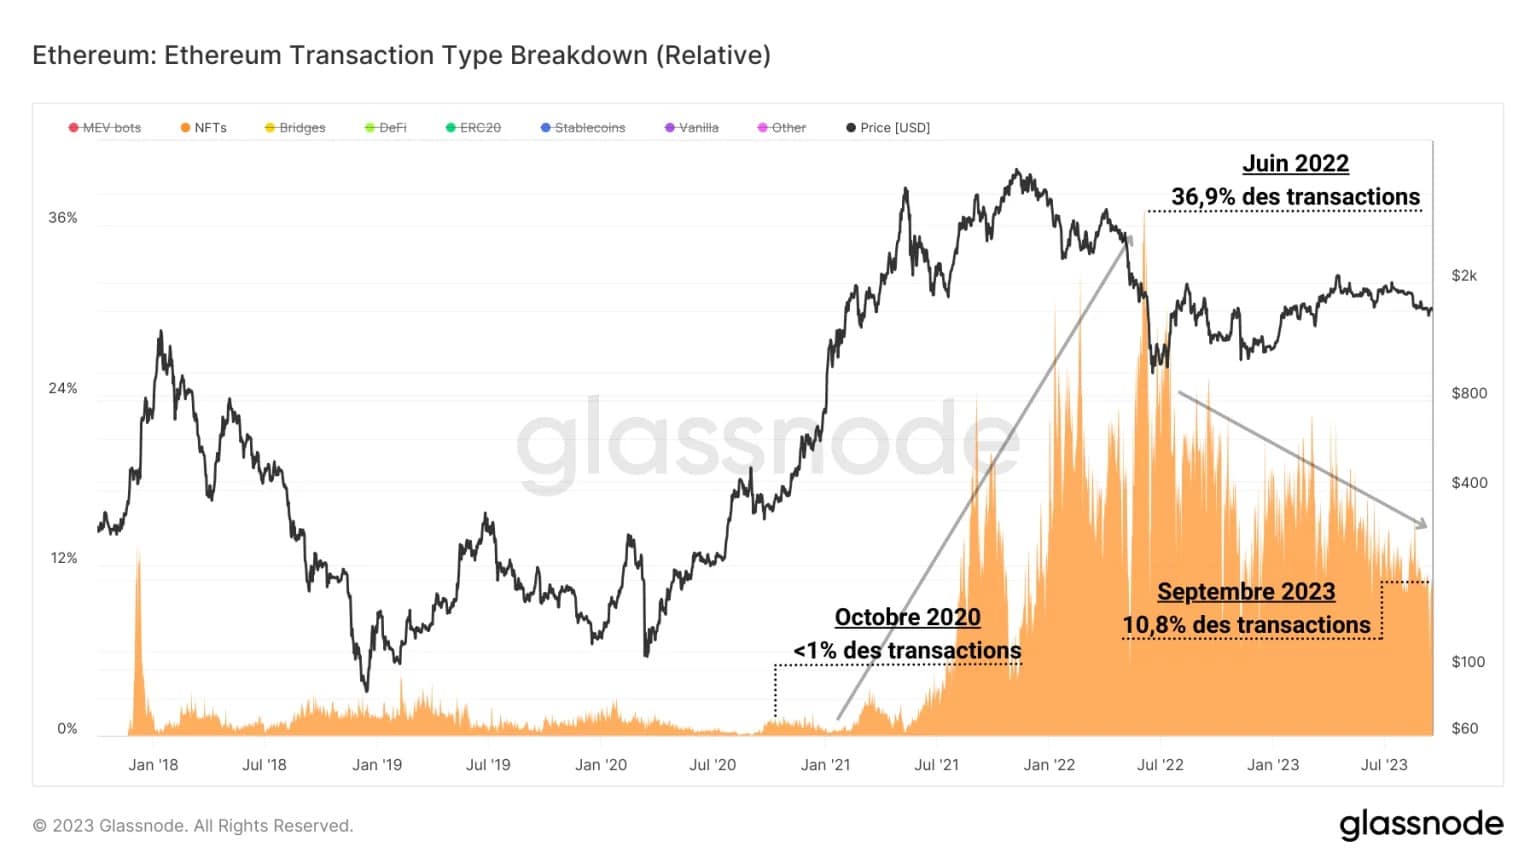
Figure 1: Number of NFT transactions out of all daily transactions
Between October 2020 and June 2022, the share of NFT transactions rose from less than 1% to more than a third of daily transactions, indicating a very strong interest among participants in NFT-related applications and speculations.
However, the share of NFT transactions today represents only one tenth of daily transactions, suggesting that the majority of speculators have left the market and that only users attracted by the fundamentals of the sector remain.
The consumption of gas and the number of traders
Breaking down the proportion of gas consumed by NFT transactions out of the total gas consumed on a given day, according to the sector’s main marketplaces, a similar observation takes shape.
Prior to the arrival of OpenSea in 2020, the majority of transactions did not take place on marketplaces, and were carried out directly on the Ethereum chain, as evidenced by the notable dominance of “Other” transactions (transactions carried out on the native chain, with no link to a marketplace or aggregator).
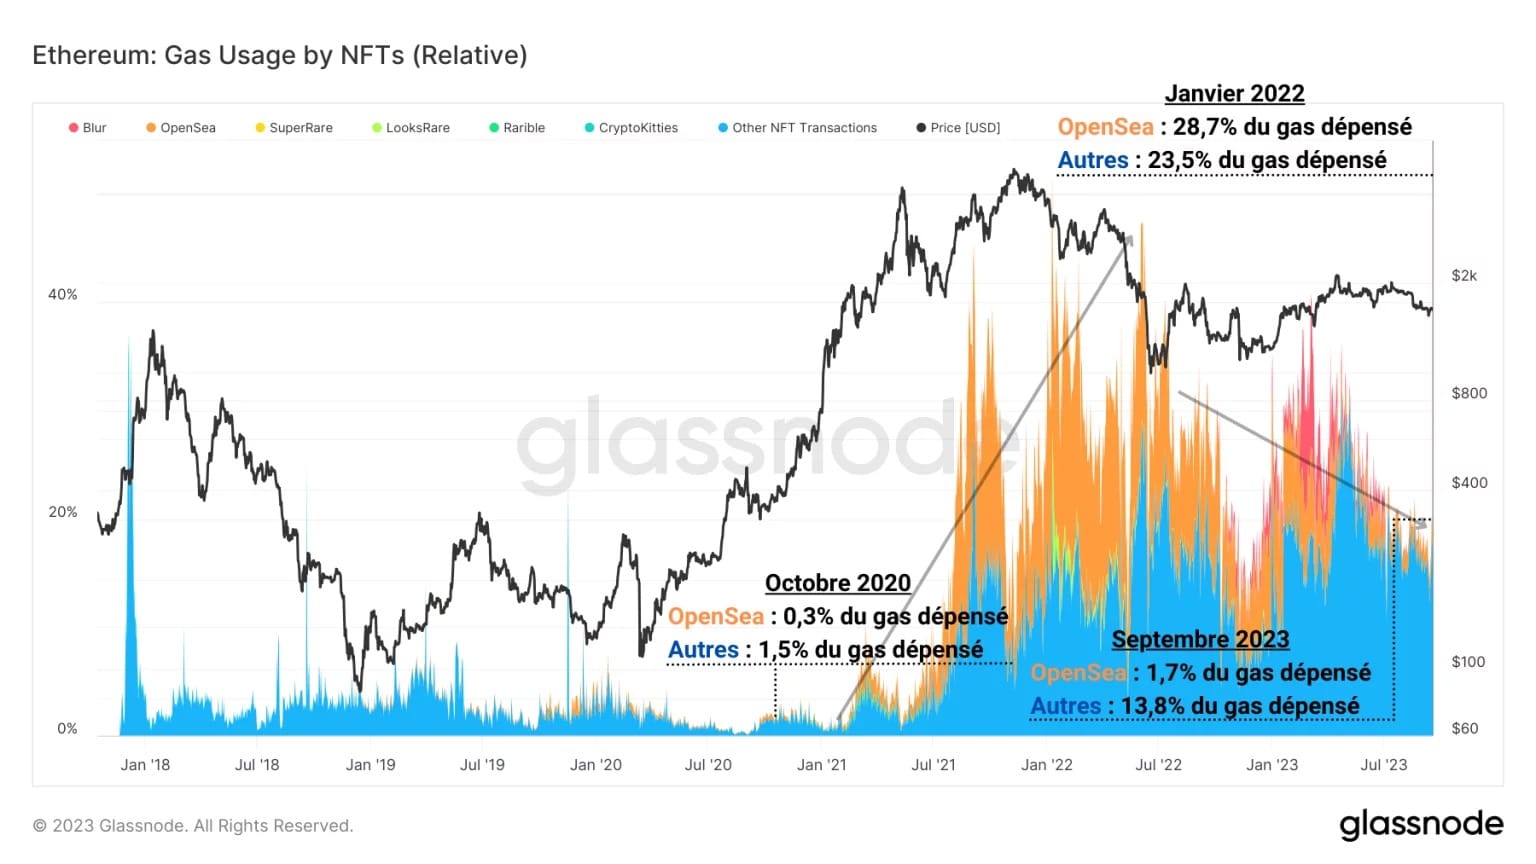
Figure 2: Gas consumption of NFT transactions out of total gas consumed daily
Between 2020 and 2022, the hype surrounding NFTs gave life and strength to numerous marketplaces (LooksRare, Rarible, Blur, etc.). Yet the dominance of gas usage during this period belongs to OpenSea, which established itself as the sector leader, aggregating almost a third of the gas consumed daily for several months.
Nevertheless, the drop in interest in NFTs between 2022 and 2023 caused such a loss of traction that the proportion of gas consumed by marketplaces is now approaching the values preceding the 2020 – 2022 hype, with “Other” transactions clearly having regained the upper hand.
If we break down the weekly number of traders by marketplace, we can see the overwhelming dominance of OpenSea, which has always accounted for the majority of marketplace participants.
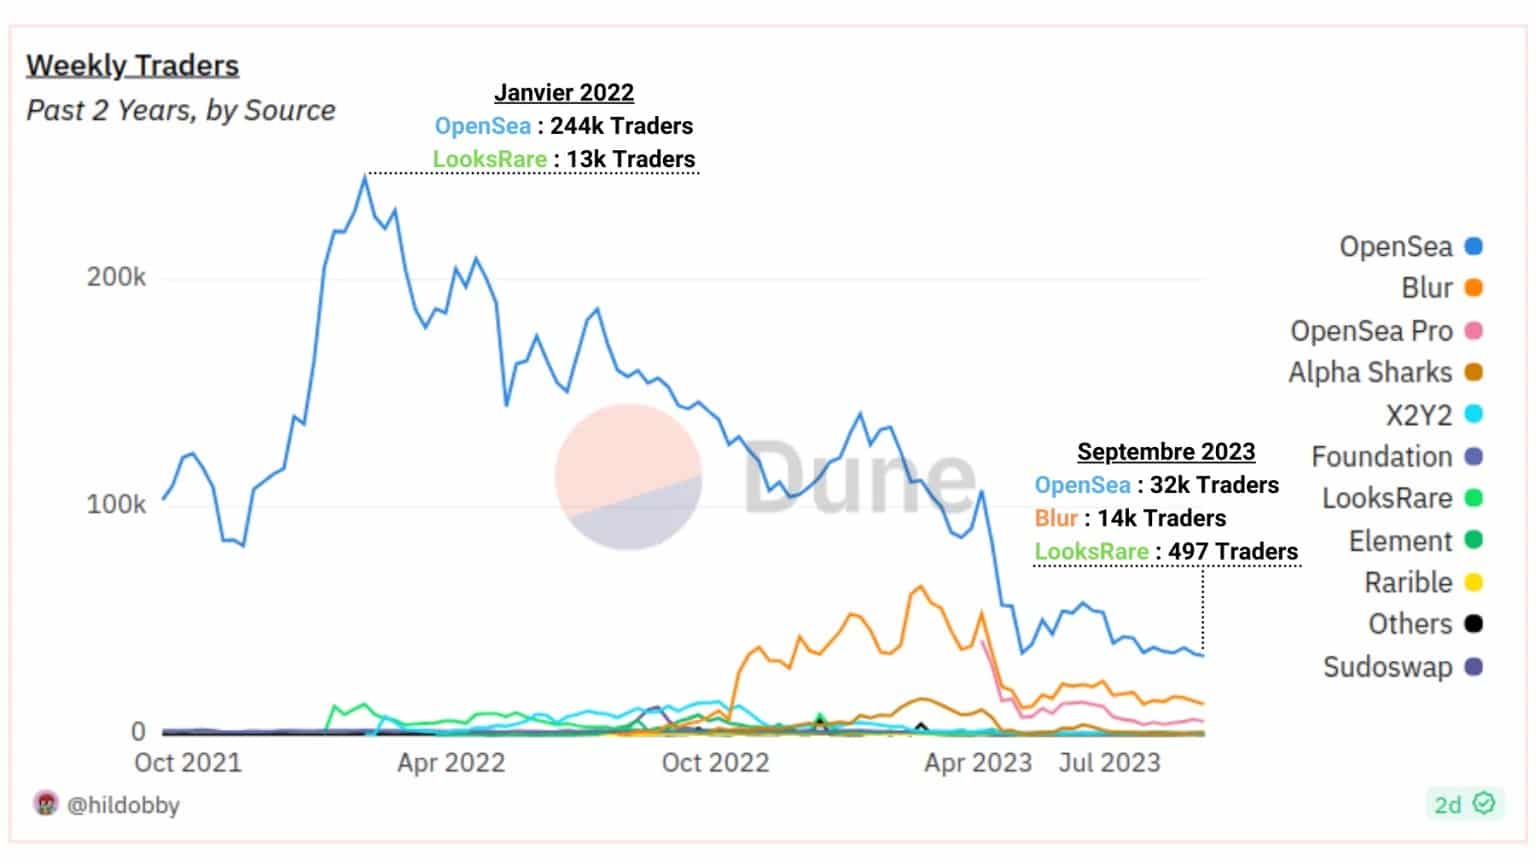
Figure 3: Number of NFT traders per marketplace
However, its dominance has fallen from 94.21% in January 2022 to 66.7% in September 2023, indicating that new marketplaces are somehow managing to attract and retain a sizeable share of the public.
Currently, the second-largest marketplace is Blur, which, despite its late appearance in 2022, far outstrips all competing platforms to OpenSea thanks to the interest generated by its airdrop strategies.
The number of transactions and trading volumes
As the number of traders has dropped significantly, so have the number of transactions carried out on these same marketplaces.
- At the beginning of 2022: the number of weekly transactions was between 560,000 and 580,000, with the bulk (around 90%) of transactions carried out on OpenSea;
- February 2023: the number of weekly transactions was just over 600,000, due to increasing activity on Blur, which now accounted for more than half of all transactions;
- In September 2023: activity was divided by 6, approaching 100,000 weekly transactions as OpenSea regained the advantage.
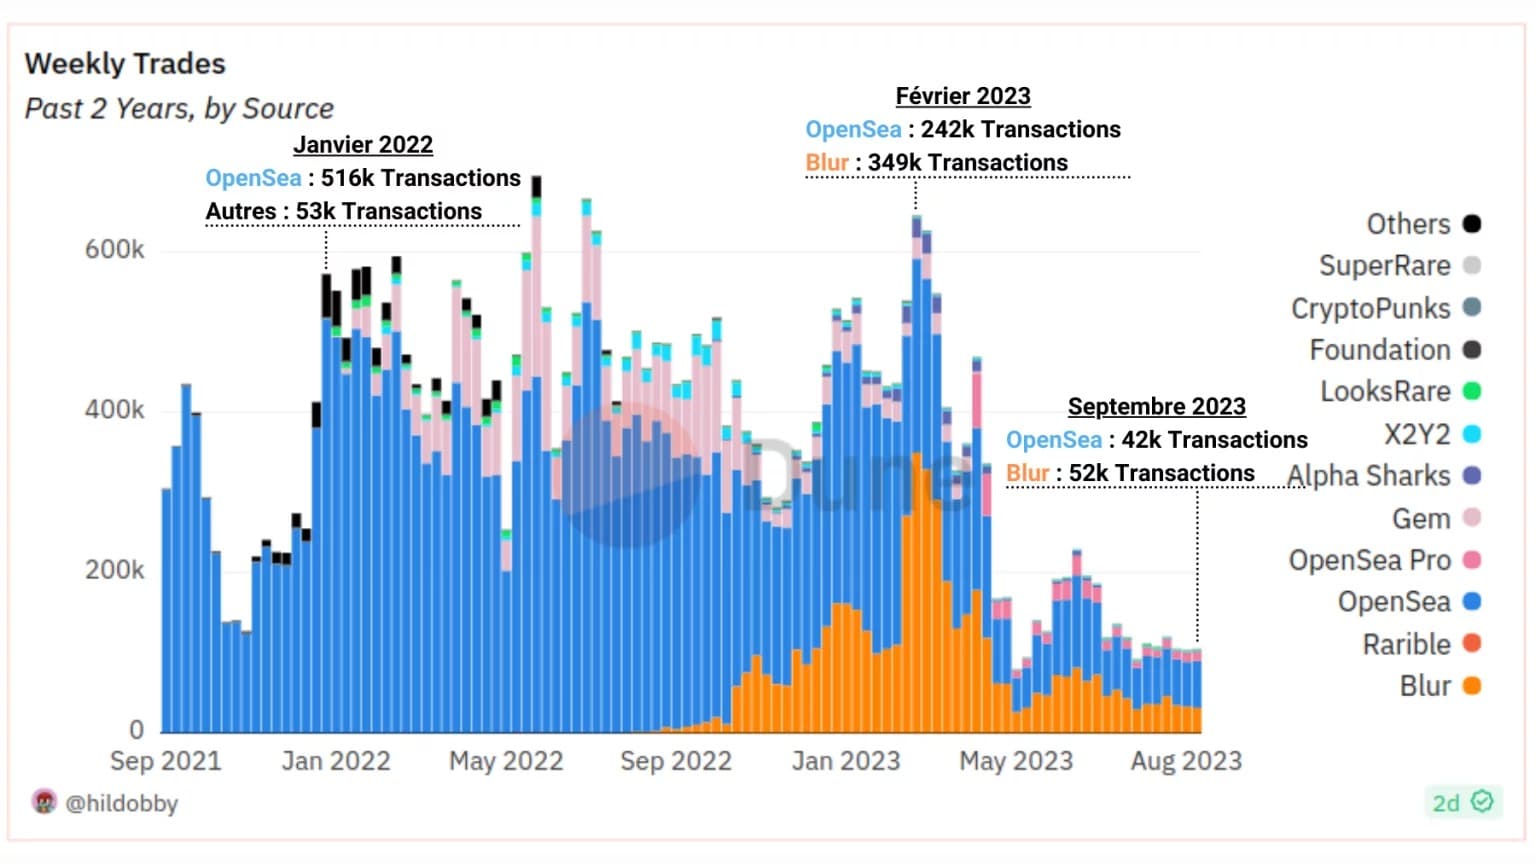
Figure 4: Number of NFT exchanges per marketplace
We can note here the sharp drop in the number of transactions during 2023, leaving the sector very little active, with fierce competition between OpenSea and Blur to attract and retain participants.
From the point of view of trading volumes, the overall dynamic of decline remains present, while the relationship between industry players brings a new nuance to the relationship between marketplaces:
- At the beginning of 2022: weekly volumes peaked at almost 500,000 ETH, with the bulk (around 85%) of volumes transferred via OpenSea ;
- February 2023: volumes dropped below 400,000 ETH as the share of volumes on Blur exploded, accounting for over 80% of weekly volumes;
- September 2023: volumes have been divided by 8, dropping to around 50,000 ETH a day, while Blur retains overwhelming dominance.
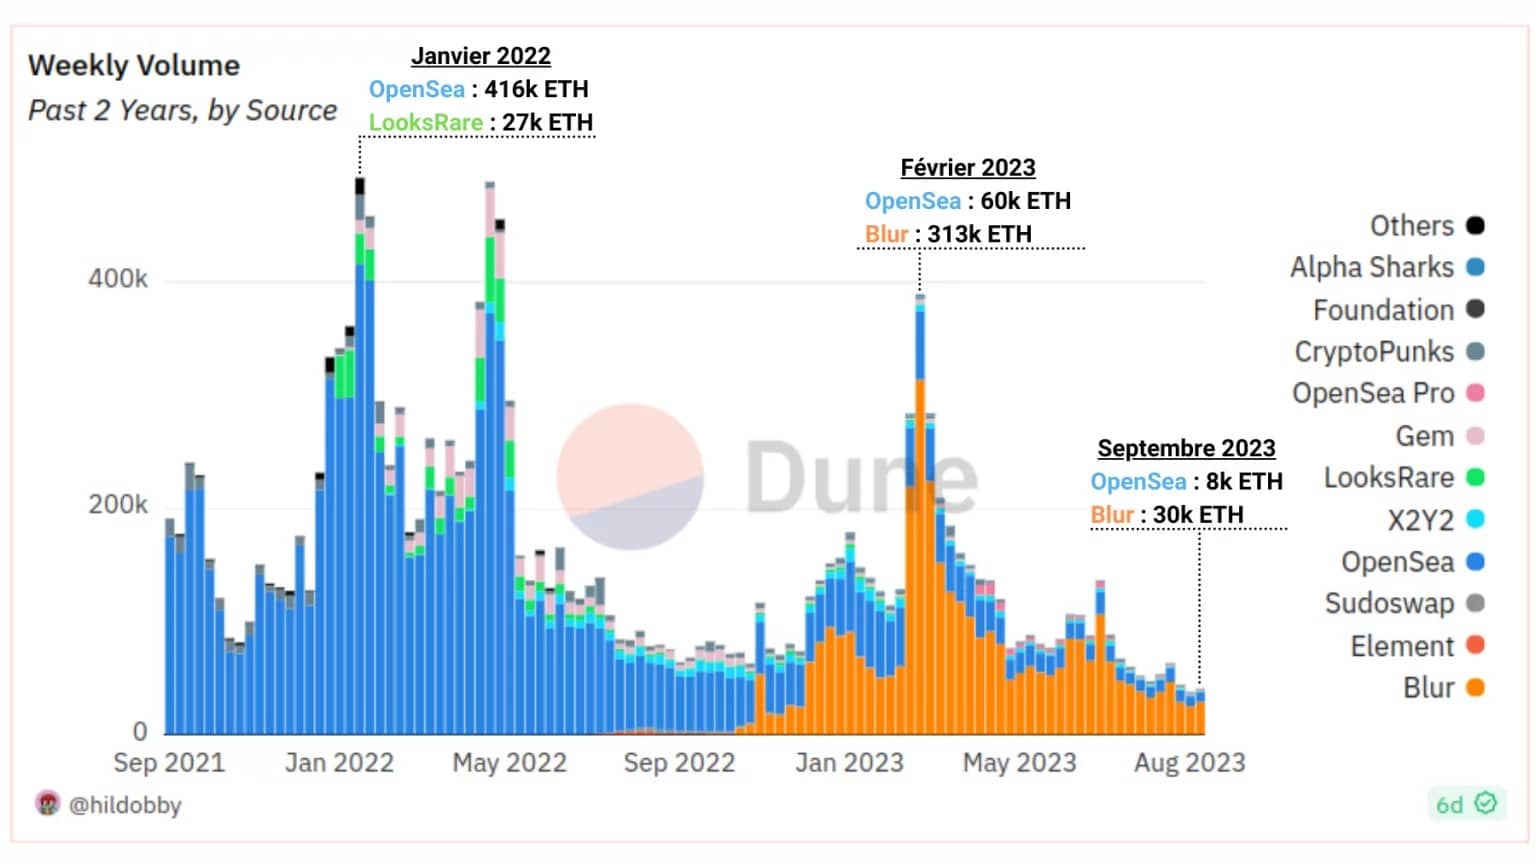
Figure 5: NFT trading volumes by marketplace
We can note here the sharp drop in trading volumes over the course of 2023 and Blur’s prowess in monopolizing the majority of traffic in record time.
Fees and royalties
Studying the value and distribution of marketplace fees offers a key economic angle from which to measure revenues from activity within the NFT sector.
If business seemed to be going well at the start of 2022, with over a hundred million dollars in fees paid to Looks Rare and OpenSea, this trend didn’t last long.
By March 2022, total weekly fees had dropped below the $50 million mark, and OpenSea reclaimed the top spot previously held by LooksRare and its strong entry into the sector.
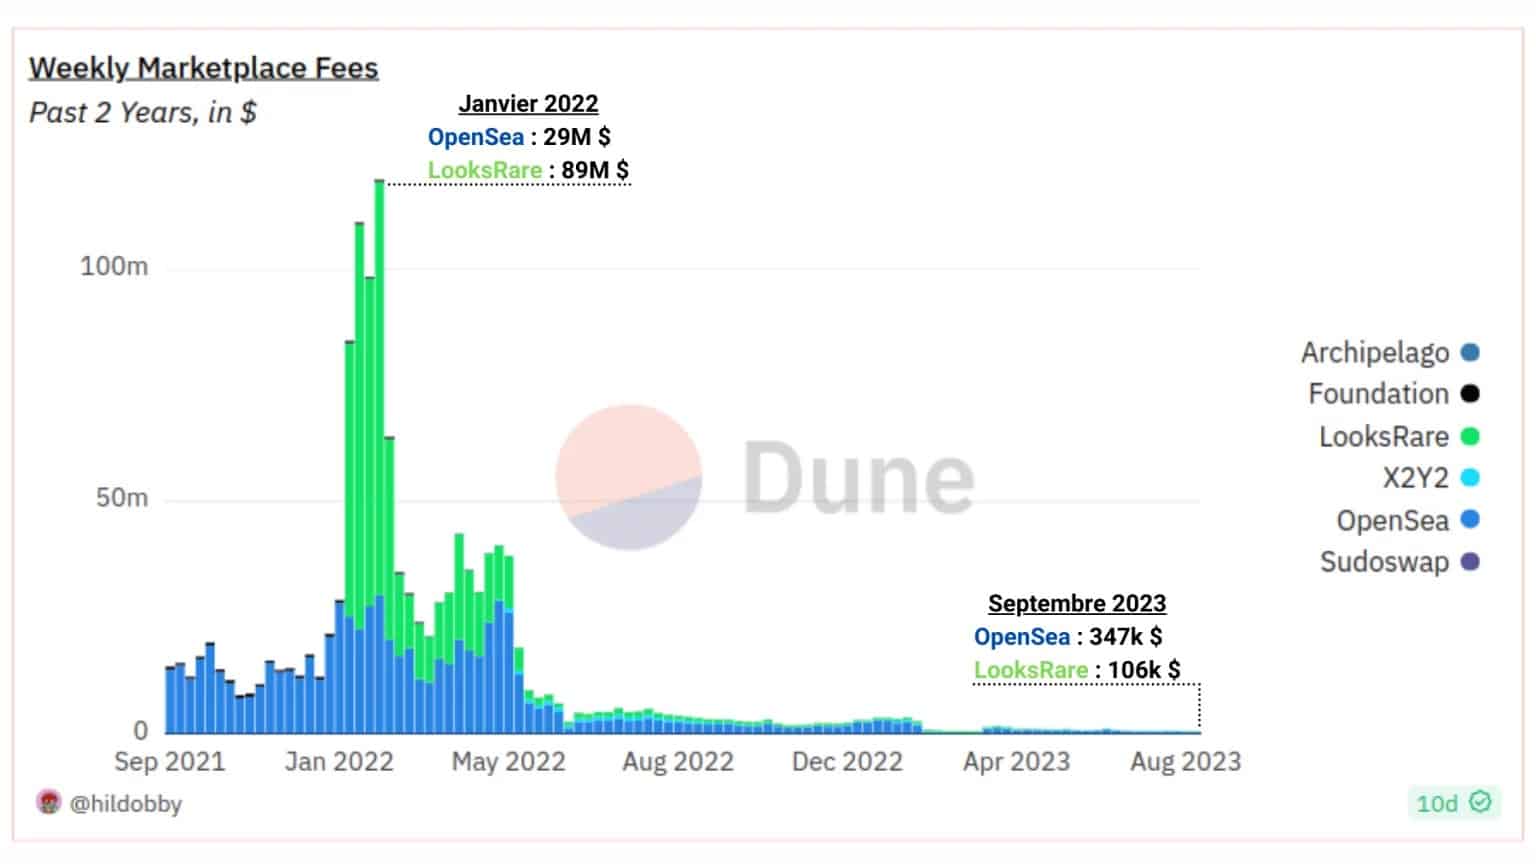
Figure 6: Fee volumes by marketplace
From April 2022, total fees barely exceed the million mark, and by early 2023, they fall below the $500,000 per week threshold.
This drop is partly due to the fee-cutting policies of many marketplaces, a strategy aimed at attracting more users via attractive rates. That said, it is also symptomatic of the general decline in interest in the NFT sector.
Measuring the royalties paid to artists on marketplaces offers another angle from which to measure activity within the NFT sector.
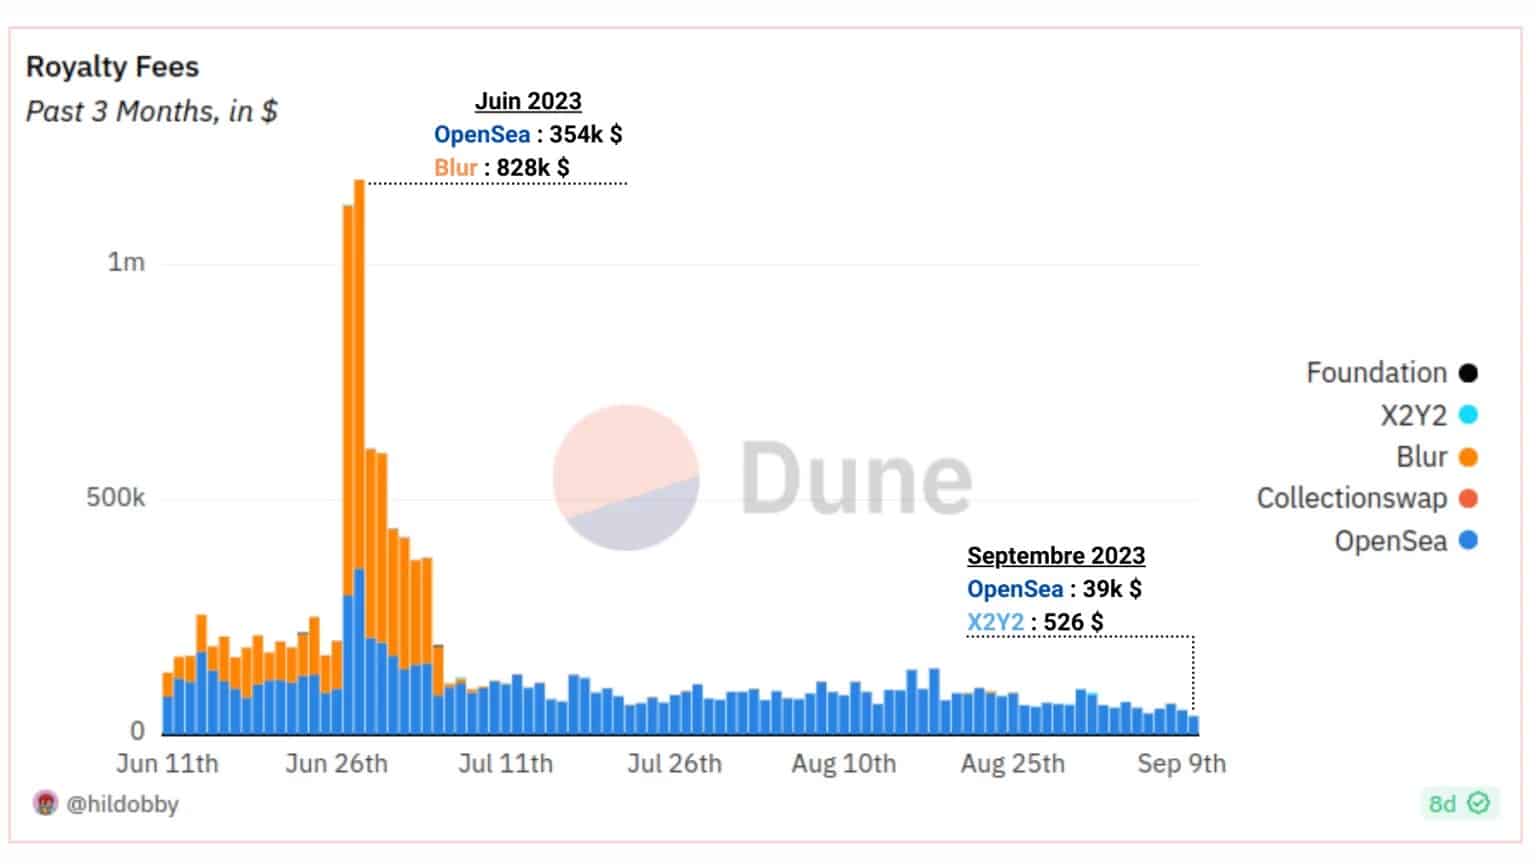
Figure 7: Royalty volumes by marketplace
While royalty revenues reached a daily peak of over a million dollars in June 2022, this episode was very short-lived, as Blur will limit the royalty rate, taking away the possibility for creators to increase them as they see fit.
With the exception of Blur, the majority of royalties were then paid via OpenSea, which regained its position as leader in July, concentrating the vast majority of royalty-related costs.
What about Bitcoin registrations?
While the number of NFT traders has been falling steadily since January 2022, the year 2023 was marked by a phenomenon of a new kind that rekindled the flame of NFT enthusiasts: Ordinal Theory and Bitcoin Inscriptions.
While the number of Inscriptions users barely exceeded 2,000 unique entities per day in March, a major hype emerged between May and June 2023, leading to the creation of a multitude of Inscriptions and a momentary congestion of the Bitcoin network, with more than 10,000 unique users per day.
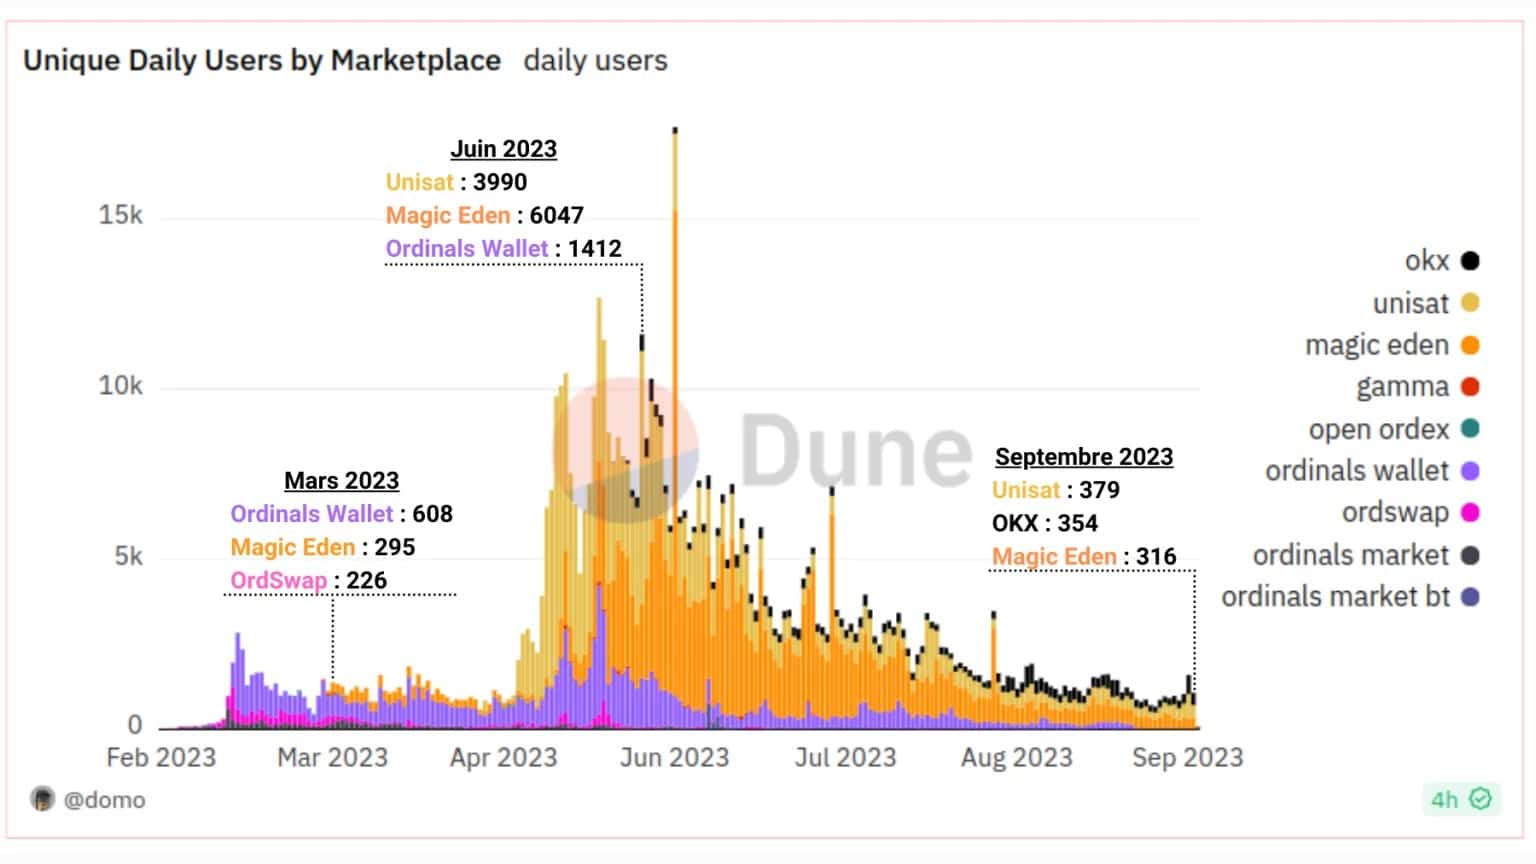
Figure 8: Unique users by marketplace
The trend has since slowed and we can currently count less than 2,000 unique users per day: we’re back to the level of early 2023.
Summary of this on-chain analysis
Finally, the data indicate that the NFT sector is recording a particularly reduced level of activity compared to 2021 and 2022, and that the Registration hype has only attracted NFT enthusiasts for a short while.
Since January 2022, the number of participants has been falling steadily, the number of transactions has been divided by 6, trading volumes by 8, fees by 1000 and royalties by 100.
Nevertheless, metrics relating to NFT activity remain higher than before the hype of 2021 – 2022, suggesting that the sector has retained its ability to bring sufficient innovation to the market to retain the interest of part of its audience.
Among the marketplaces, OpenSea is in pole position in terms of number of transactions, fees and royalties, but Blur dominates by far in terms of trading volumes.