
Following a profit taking, the Bitcoin (BTC) price is establishing a new sideways movement in a range between $21,200 and $24,100. What are the price levels that BTC has recently reacted to, and what are the potential support/resistance areas to watch for?
Bitcoin retraces below $22,000
Following the January 2023 price surge, the price of Bitcoin (BTC) rose to test $24,000, before entering a narrow range in the $23,000 area.
Last week, the price of BTC broke below this range to stabilise below $22,000, beginning a new lateralisation.
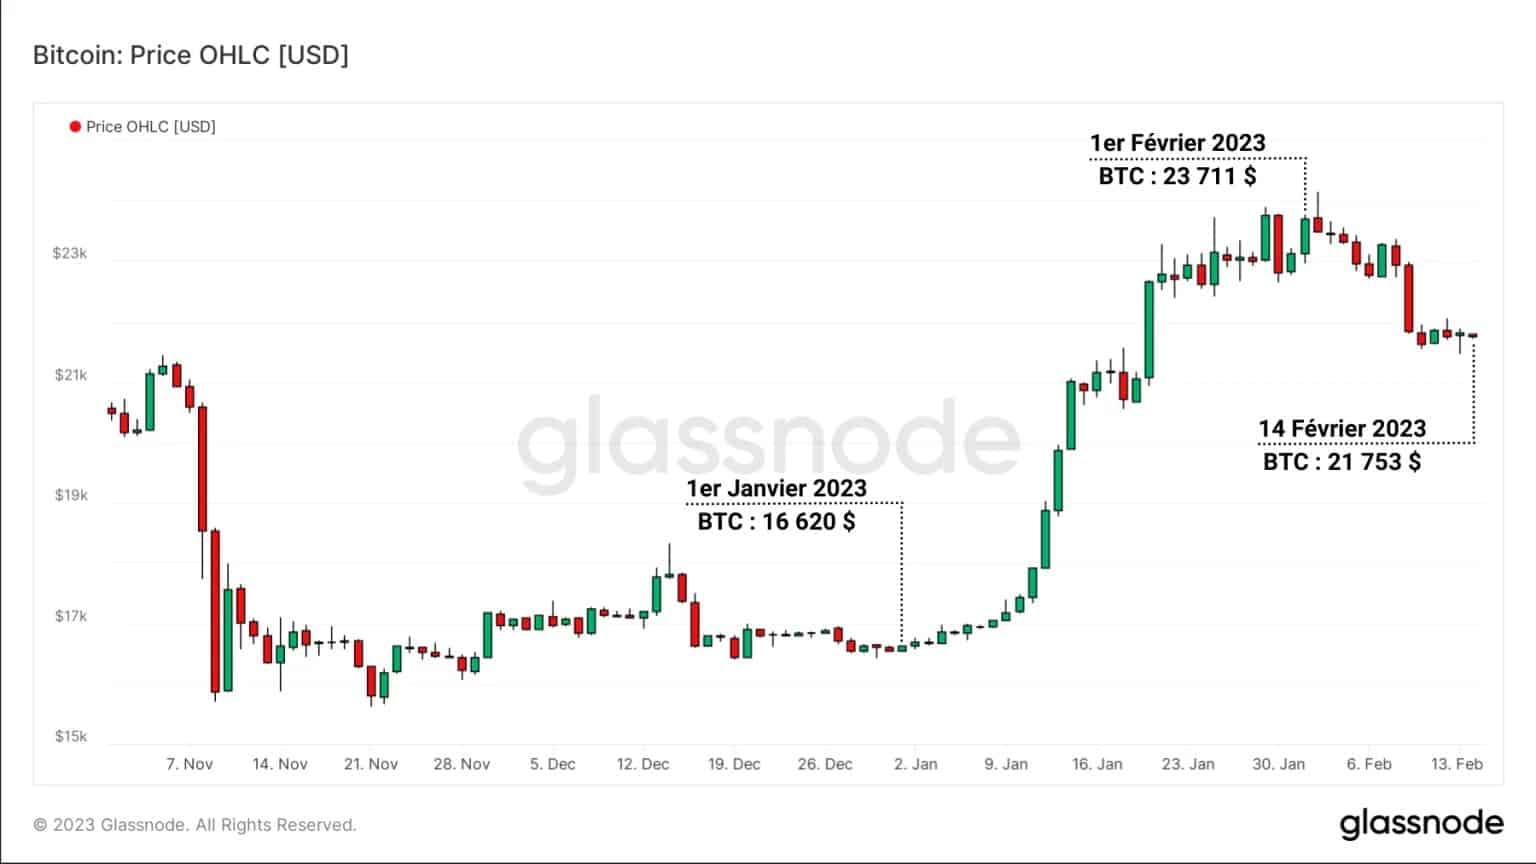
Figure 1: Daily BTC price
As the uptrend initiated at the beginning of the year slows down, we will observe today the price levels to which the BTC price has recently reacted, the potential support/resistance zones to watch.
To do so, we will use a metric mentioned several times in our previous analyses: the distribution of realized UTXO prices, or URPD.
Potential levels of support/resistance
Using URPD, we can visualise the distribution of acquisition prices of BTC in circulation and identify clusters of volume that may be holding back or accentuating a price movement.
The following graph represents the distribution of realised prices as of 1 January 2023. Here we can clearly see three major areas of interest:
- BTC from older cycles (green), held in profit for several years, with a cost base of less than $11,000.
- BTC acquired in the current range (orange), between $15,700 and $24,100, with an impressive price concentration achieved at the $16,400 level.
- BTC held at a loss since the November 2022 ATH (red), the majority of which has been sold during the turmoil of the bear market.
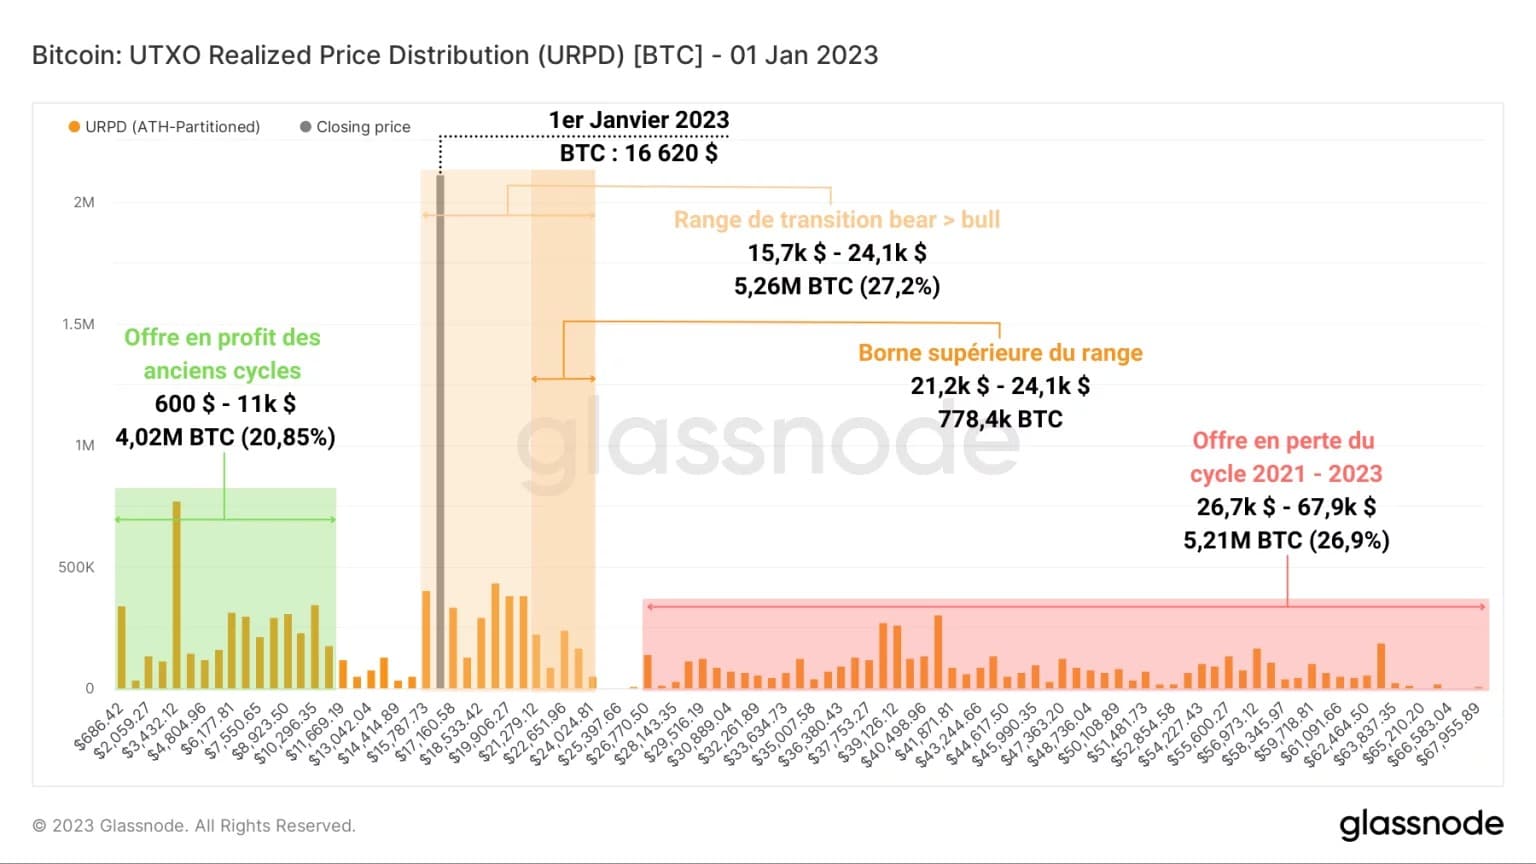
Figure 2: URPD (1 January 2023)
We can note that the cost base of many entities was at that time in the lower part of the orange zone, providing a strong support in case of a decline.
One month later (February 1, 2023), following a price increase that brought the BTC price close to $24,000, the composition of the URPD changed to the distribution below.
It can be seen that the price increase caused realised prices to migrate to higher levels, in the upper end of the range (in dark orange), between $21,200 and $24,100.
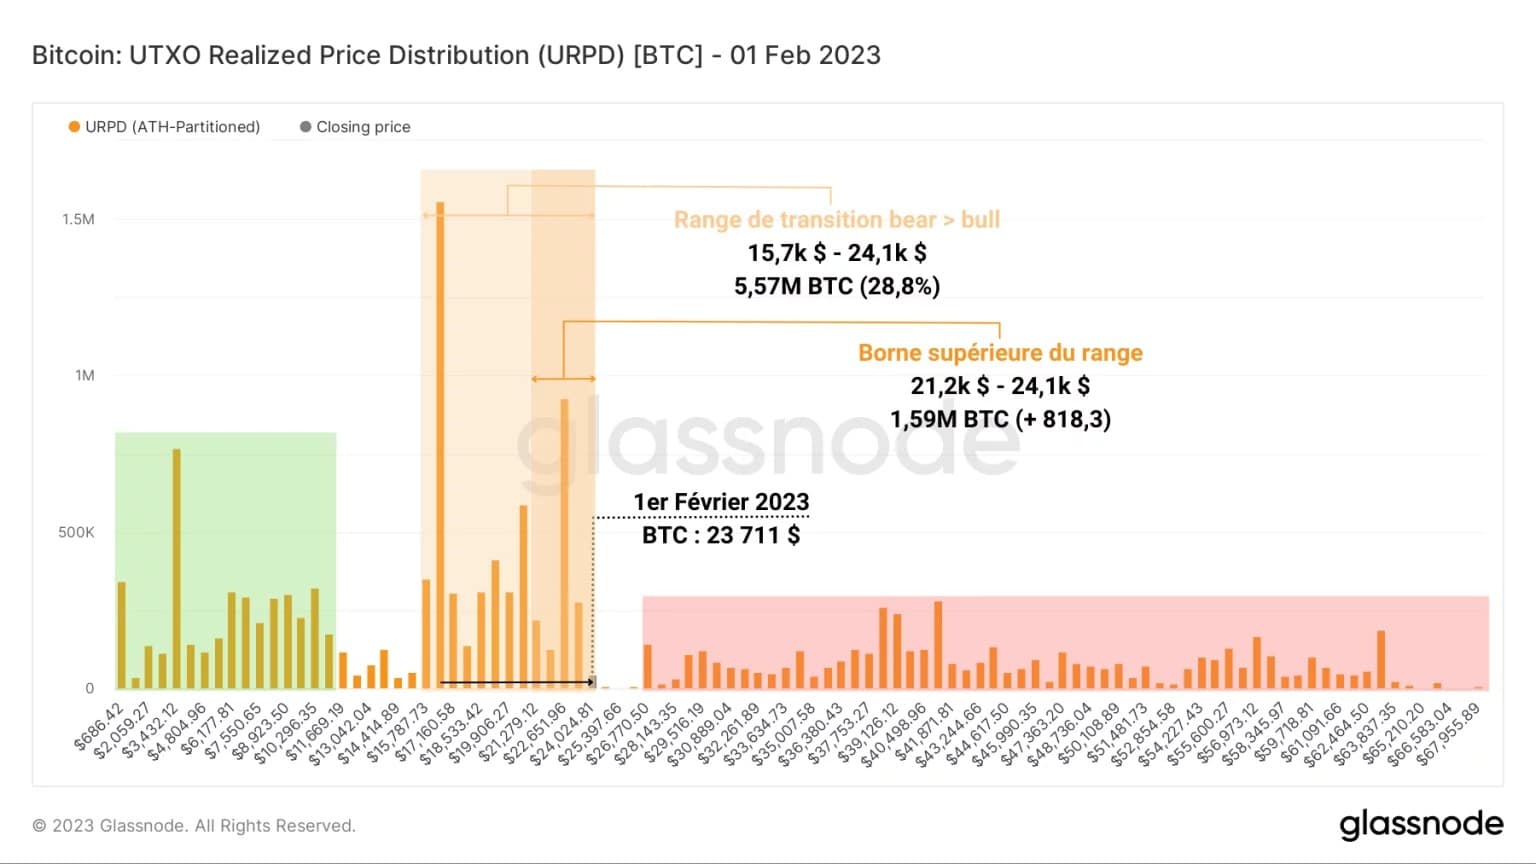
Figure 3: URPD (1 February 2023)
Indeed, more than 800,000 BTC changed hands in this price range in one month, signaling a notable profit-taking of the BTC accumulated lower, at the $16,400 level.
In addition, we can note that the BTC price ran into a low-volume area between $24,100 and $26,700, which appears to have acted as upward resistance since then.
Following the breach of cost bases by several groups of holders, this obstacle represents an important psychological pivot that marks the border between sideways movement and resumption of the uptrend.
Finally, following the recent return of the price below $22,000, the current distribution of realised prices shows a net increase in the volume of BTC between $15,700 and $24,100, which concentrates more than 29% of the outstanding supply.
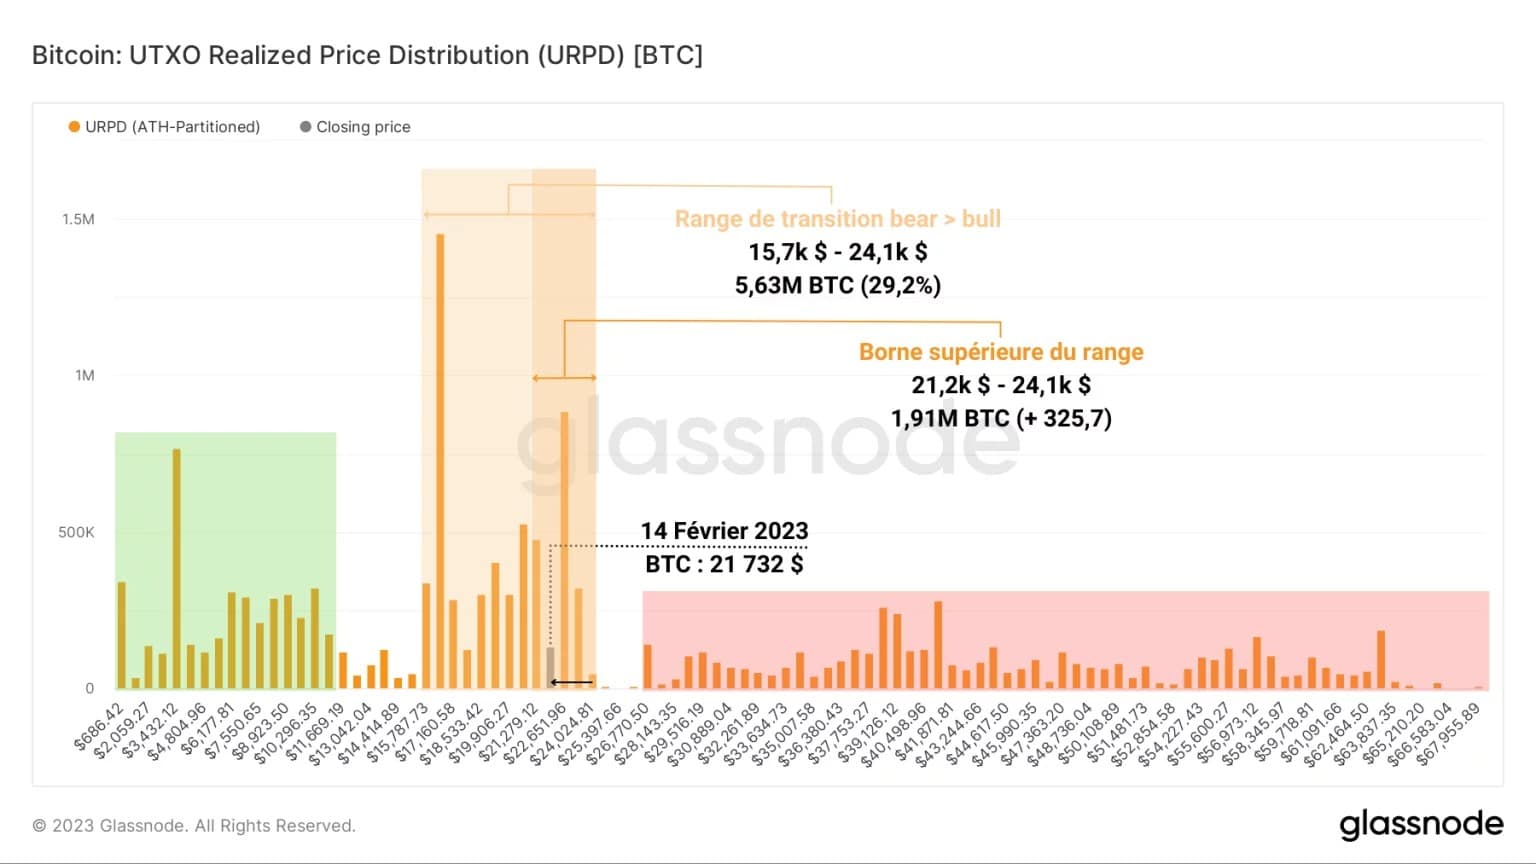
Figure 4: URPD (14 February 2023)
The upper bound has seen a total of 325,700 BTC added since February 1, meaning that profit taking has slowed as the price has fallen.
With just under two million BTC now clustered in a price range of just under $3,000, between $21,200 and $24,100, breaking through this resistance zone and testing it as support are conditions that would favour a healthy continuation of the uptrend.
Note that the low volumes between $24,100 and $26,700 have the potential to create a tailwind that could propel BTC above $27,000 on a bullish breakout.
Opposite this resistance area is a widely recognized support zone, which has acted as a bear market floor since November 2022.
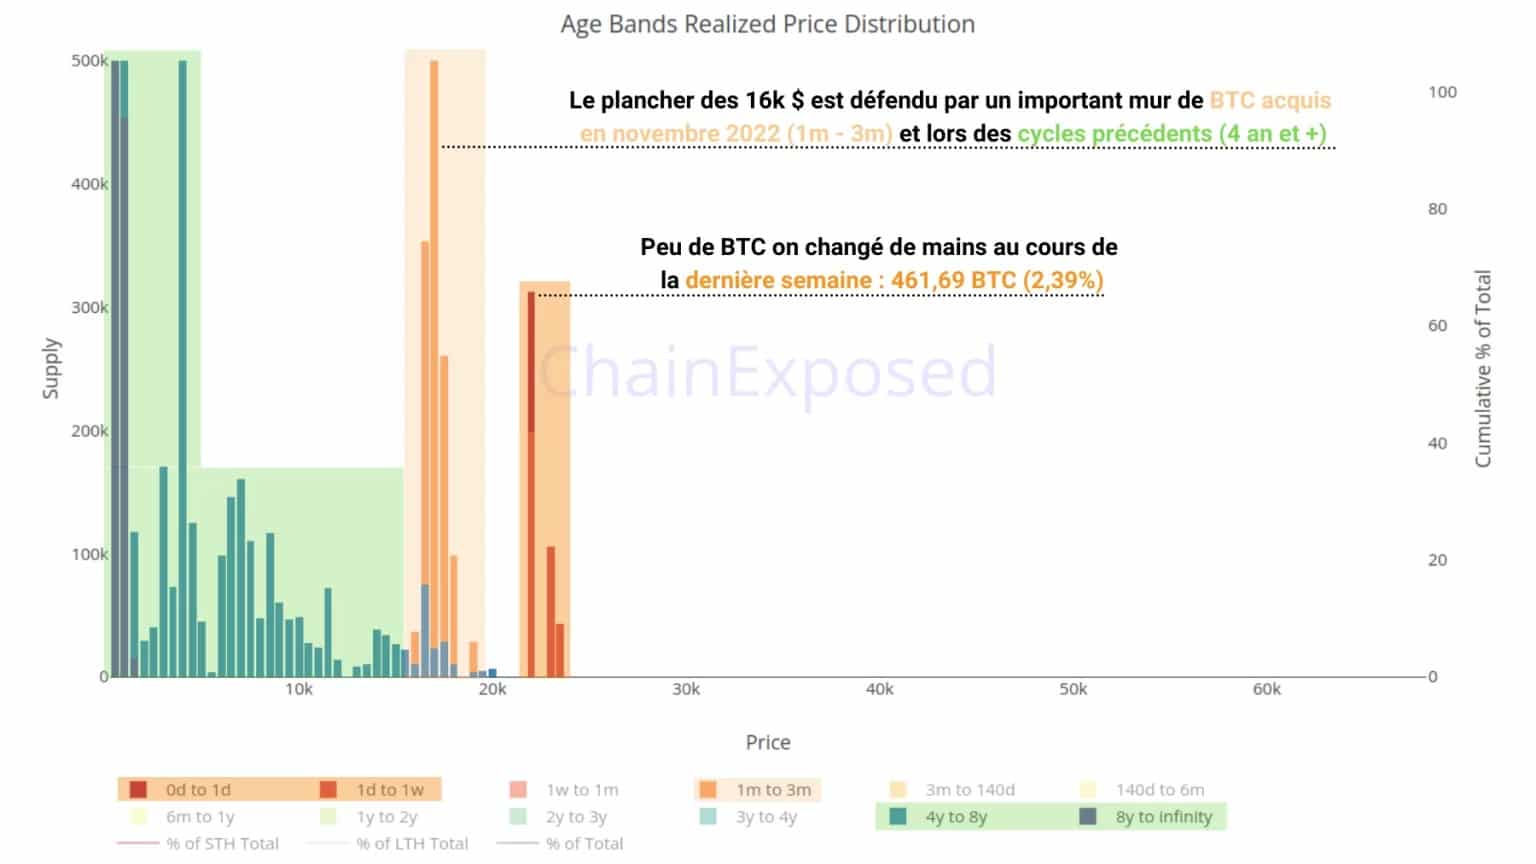
Figure 5: URPD by age band (14 February 2023)
Situated between $15,700 and $16,400, and concentrating nearly 1.8 million BTC, this veritable wall includes both BTC accumulated during the November capitulation (1 month – 3 months) and BTC from previous cycles (4 years and more).
These BTC have not been spent during the January 2023 rally, suggesting that their holders are waiting for better prices to sell or simply do not intend to sell (HODling behaviour).
If BTC were to break through this support from below, the low volumes between $15,700 and $11,000 could again create a bottoming out and accelerate the market’s fall.
Summary of this on-chain analysis of BTC
Overall, this week’s data indicates that the current range concentrates a dominant portion of the outstanding supply (approximately 5.6 million BTC, or 29% of the supply), the majority of which is being held at a profit at this time.
It appears that the BTC price is establishing a new sideways movement towards the upper end of the range, located between $21,200 and $24,100.
The in-depth study of the URPD and its age band variant allows us to confirm that the BTC price is compressed between:
- Resistance at the $24,100 level, which caused profit taking when the price approached it;
- Support at the $15,700 level, concentrating a large volume of BTC from previous cycles and BTC accumulated during the November 2022 sell-off.
Whether it is a breakout from the top or the bottom, the exit from this range is likely to generate a large price movement, fuelled by low volume prices at both ends of this price range.
On a bullish breakout, the price would quickly rise above $27,000, while on a bearish breakout, the market could go for the $11,000 area.