
After 3 months of correction in the cryptocurrency market, Bitcoin (BTC) is finally back on the rise. Is this the end of the downward trend that seemed to be set for the long term?
Bitcoin is back in an uptrend
We’ve been watching it all along, the price of Bitcoin (BTC) has been in a downward sloping wedge since November. We finally had to wait until February to see the first reversal signals.
As we can see on the daily chart, Bitcoin managed to break the upper trendline of the pattern, triggering a bullish momentum towards the next resistance. While Bitcoin is currently attempting to break through a key level at $44,300, indicators are encouraging and suggest a return above the psychological $50,000 level in the coming weeks.
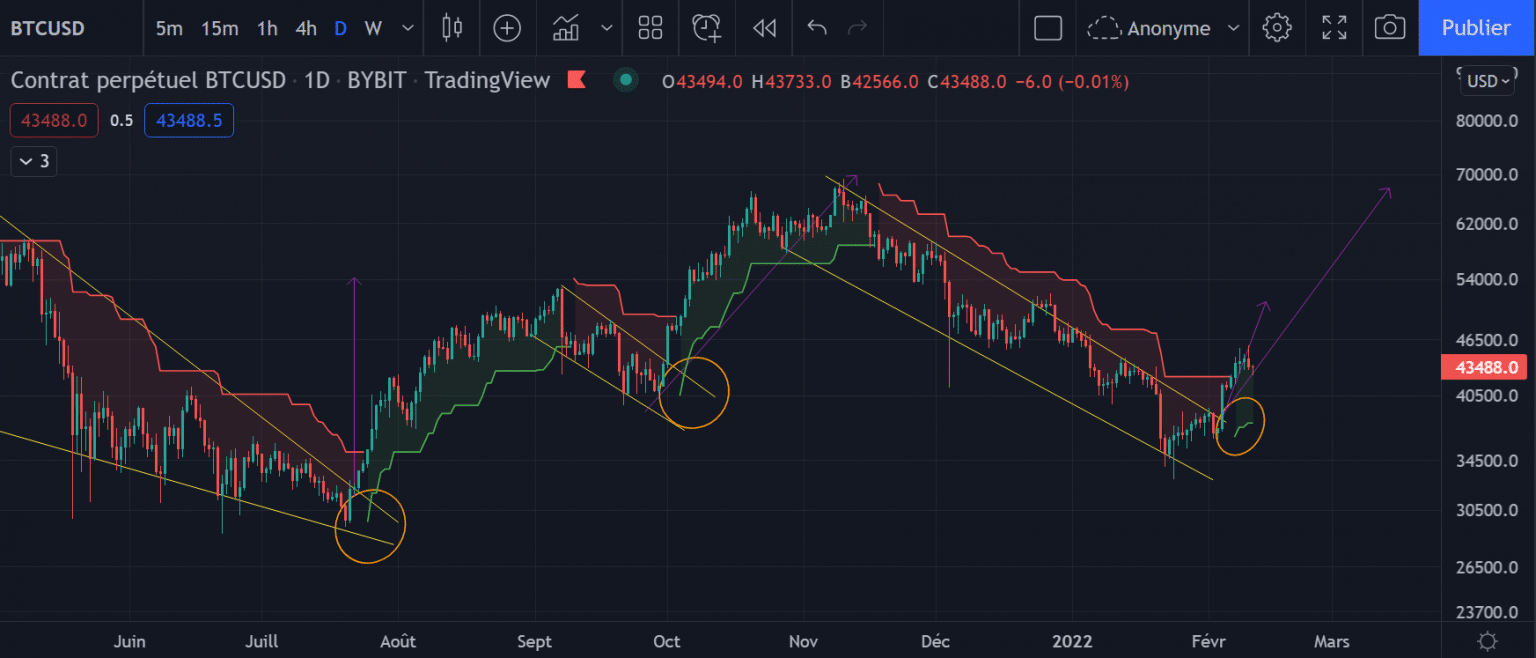
The Bitcoin Daily Chart
First of all, the target for breaking a downtrend wedge is usually set in two parts. First, the Bitcoin price must reach the previous top within the pattern which corresponds to a theoretical return to the $49,400 level. Then, if this resistance breaks, BTC should reach its full target, corresponding to the high point of the Bevel at $67,800.
In addition to these bullish targets, the Supertrend indicator is showing a trend reversal having flashed green a few days ago.
If we look at what happened after each of its signals in 2021, we see that the price is systematically moving back up towards the breakout target of each preceding pattern.
If the accuracy of the past continues, the Bitcoin price may well enjoy a new uptrend towards $67,800 in the coming months. This nascent trend will be invalidated, however, if the price returns below the $37,800 support level at the close (green flat on the Supertrend).
Ether on its way to $4,000
The price of Ether (ETH) is still technically in a downtrend in the form of a descending broadening pattern.
In general, this type of pattern heralds an upcoming market reversal. But still, the high trendline must be broken to trigger a bullish momentum and a target in this sense.
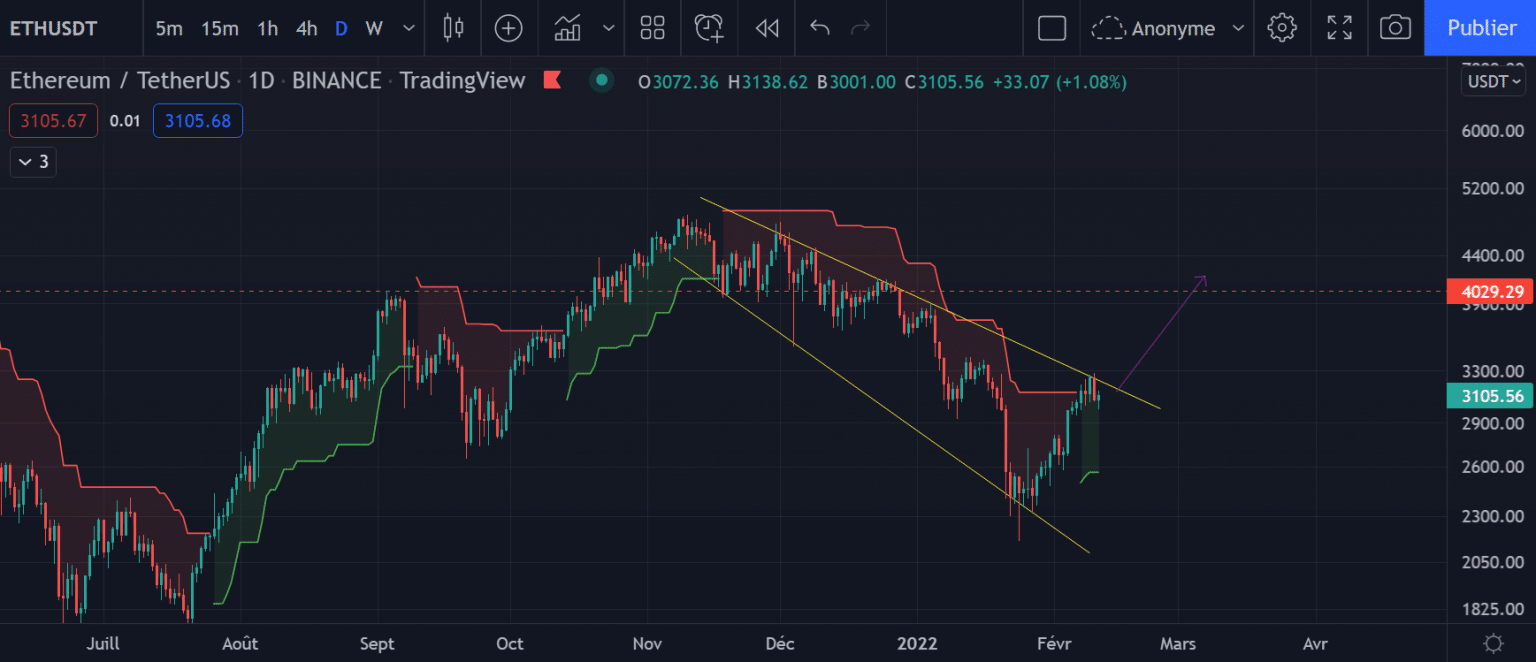
Ether (ETH) chart in H4
We can see that while the ETH has not managed to regain the upper trendline of the pattern in support, it has managed to break through important resistance at $3,100, which has triggered a green signal from the Supertrend indicator. This means that, in theory, the ETH should finally break the trendline of this long downtrend.
In concrete terms, as long as the $2560 level holds at the close, Ether should continue to rise and look for a bullish target around $4000. If on the contrary the support level does not hold, this should lead to a return of the price to the lower trendline around $1,900.
In conclusion
A rebound is underway in cryptocurrencies, which are gradually hinting at the return of a bullish trend. Bullish targets are being set up, but identified supports will need to be preserved for Bitcoin and Ether to continue rising serenely.