
On October 20, 2021, the Bitcoin (BTC) price exceeded $66,000 and reached a new all-time high, before entering a bull trap on Monday, November 8, and entering one of its biggest bear markets in history. Today is Thursday, October 20, 2022, so the market is celebrating the 1st anniversary of its ex-ATH, the time interval from October 20 to November 8.
Bitcoin (BTC): the former all-time record celebrates its 1st anniversary soon
Is BTC technically oversold after a year of bear markets and against the backdrop of a global-macro fundamental crisis?
When looking at the major bear markets in the short history of the Bitcoin price (bear market study over the last 13 years), there are 5 major bottoming dates:
- November 2011 with more than 90% drop since the previous all-time high;
- January 2015 with an 80% drop since the former record;
- December 2018 with -80%;
- the month of March 2020 (low point of the stock market shock of the health crisis) and its -72% ;
- and finally, the level of stabilisation of the market since June 2022 with also the -72% measure.
The price of Bitcoin is therefore down 72% from its previous all-time high, or 72% for almost a year.
Settling on the same drawdown as the low of the Covid-19 fall in the West is not a sufficient argument for a low point, but when one practices technical analysis on this curve (see chart below), particularly the price/momentum approach (momentum being represented here by the RSI technical indicator), a bullish divergence is present.
A chartist trend line suggests that a final purge at -80% down from the ex-ATH (i.e. around a price of $14,000 for BTC) could take place before a true bullish market recovery.
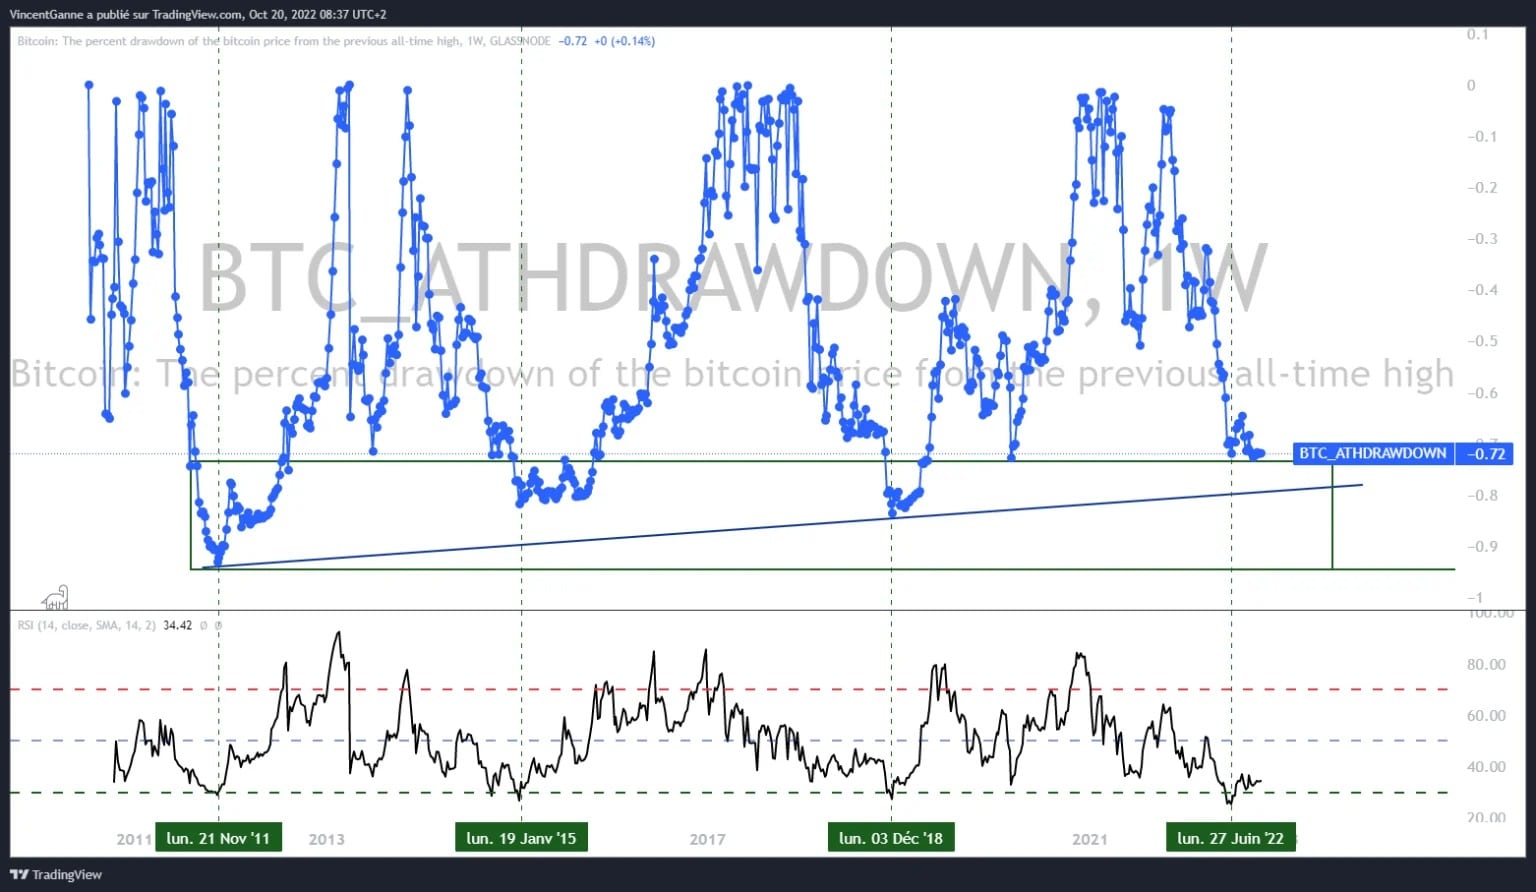
Chart that exposes the percentage decline in BTC since its former all-time high
Bearish yearly momentum reaches extreme low, watch out
More broadly, is the Bitcoin price oversold in terms of momentum after this 72% drop in one year? This is a magnitude of correction that can be found more or less equally on the total market capitalisation of the cryptocurrency market, down 65% in 12 months.
In order to answer this question in a straightforward manner, basic mathematical functions are the right tool. Relative momentum (or more simply rate of change in % over a given period) allows us to identify the extreme levels of inflection of a financial asset, up and down.
The chart below shows the 12 month relative momentum of Bitcoin and historically the market has always recovered (within the short history of Bitcoin) after losing 75% year-on-year.
You can see that the curve is very close to this level, so the market will very soon make a choice between bouncing back and repeating its historical pattern or sinking and entering a chart no man’s land.
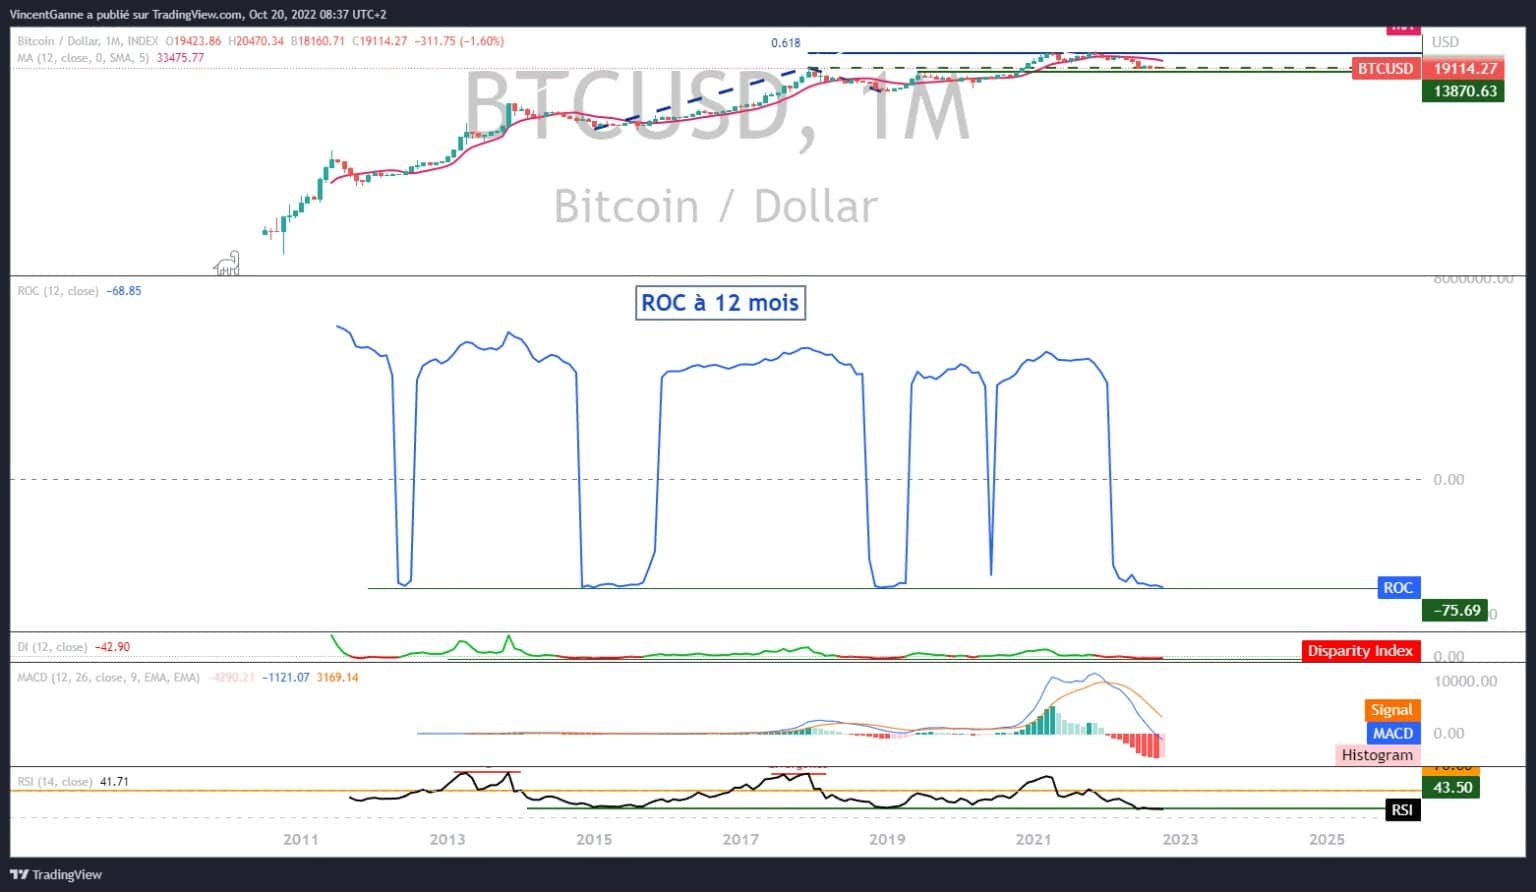
Chart that exposes the relative 12 month momentum of BTC (12 month ROC)