
This first week of February is the week of all dangers on a fundamental level for price action in the stock market. Firstly, it brings together all the fundamental influencers for the market, in particular the FED and ECB, and secondly it may challenge the very euphoric bullish start to the year for risky financial assets. Let’s take a look at the fundamentals as the technical analysis signals become more and more favourable
The US Federal Reserve (FED) is close to its Terminal Interest Rate
It’s pretty hard to make a definite choice of adjective to describe the start of 2023 in the stock market. Having scoured the headlines of the leading financial press, it is the adjective “euphoric” that stands out the most, or surprising, exaggerated, etc.
We are not here to give a French lesson but, all the same, this bullish recovery of the assets slaughtered in 2022 has surprised many. In my opinion, the start of the year in the stock market can be described as presumptuous and here is why:
- The market is putting all its eggs in the same fundamental basket, which in itself represents a significant downside risk if it is wrongly anticipated;
- The market is betting that the almighty FED’s terminal rate will not rise above 5% (note that this week the FED raised it to 4.75% in its first policy decision of the year);
- The market is anticipating a quick “pivot” by the FED, i.e. the start of a downward trend in the FED FUNDS interest rate by the third quarter of 2023;
- The market is finally considering that structural disinflation has been well underway since the end of last year, which is where the main market risk lies.
Indeed, any rebound in core inflation measures early in the year would cast huge doubt on the ability of Central Banks to get inflation back to 2% and remove much of the fundamental justification for the rebound in equities and cryptos since January 1.
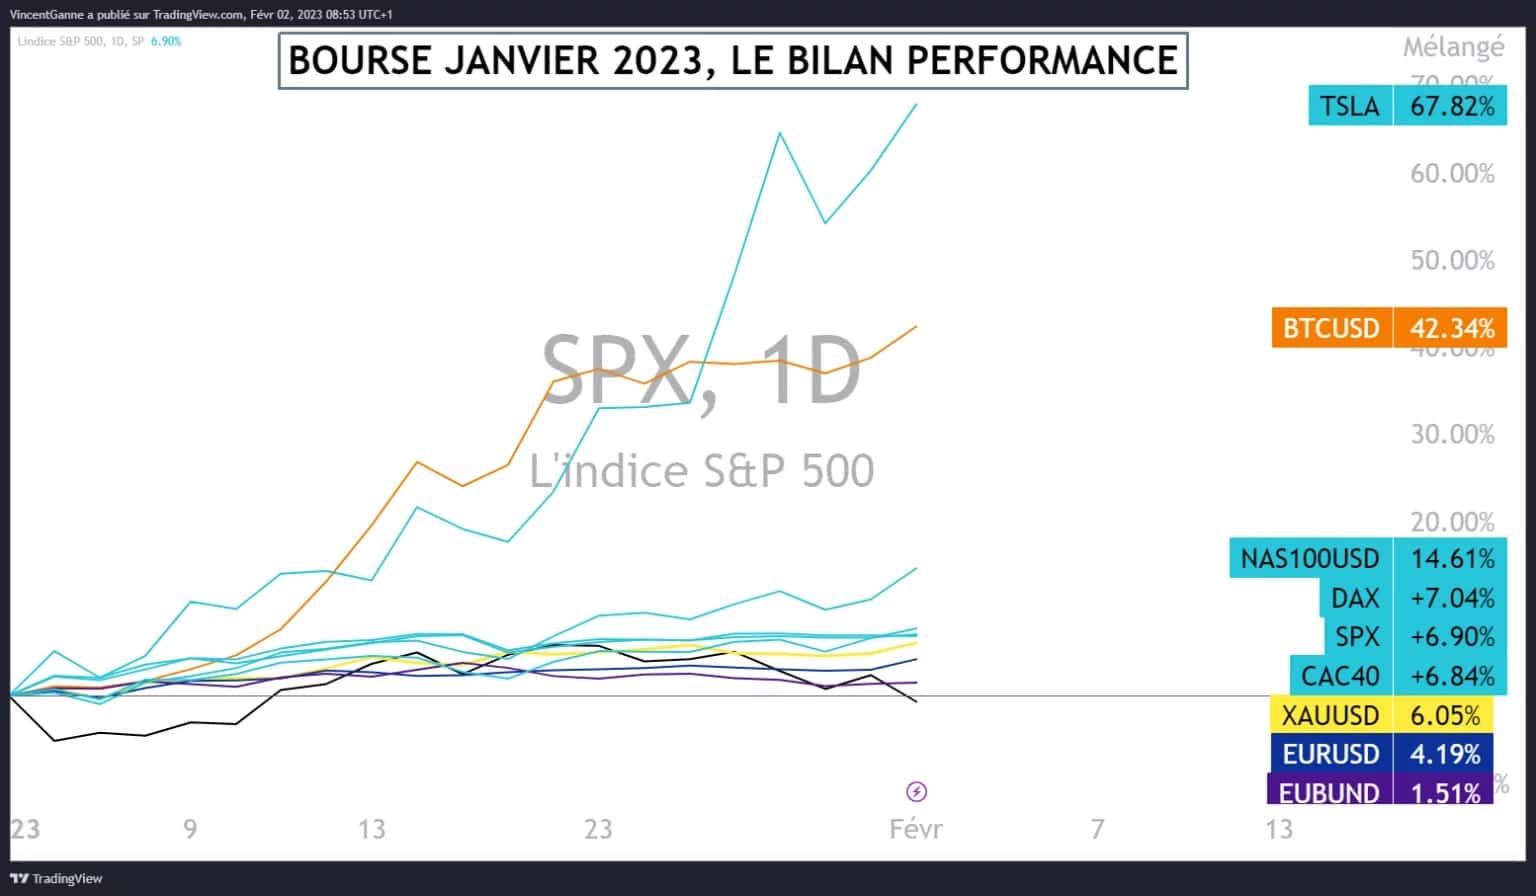
Chart that reveals the performance of a selection of financial assets representing all asset classes since the beginning of the year
Bitcoin (BTC), a new technical monthly close is engaging
Let’s return to the technical analysis of the Bitcoin price, which is up more than 40% since the beginning of the year. The market has risen from $16,000 to $24,000 with almost no pause, which is always a technical risk of a sharp retracement when the price momentum is vertical.
Let’s take a step back with a focus on the latest chart update in monthly data, the only time horizon with a range of several weeks to months. Bitcoin has just recorded its best monthly technical close since Q1 2019, which at the time signalled the end of the bear market.
In particular, you will notice the new uptrend on the LMACD histogram, the MACD technical indicator in logarithmic scale. Finally, for the short-term technical framework, the market remains in an uptrend as long as the support at $21,000 is preserved with the bearish gap at $25,000 in sight.
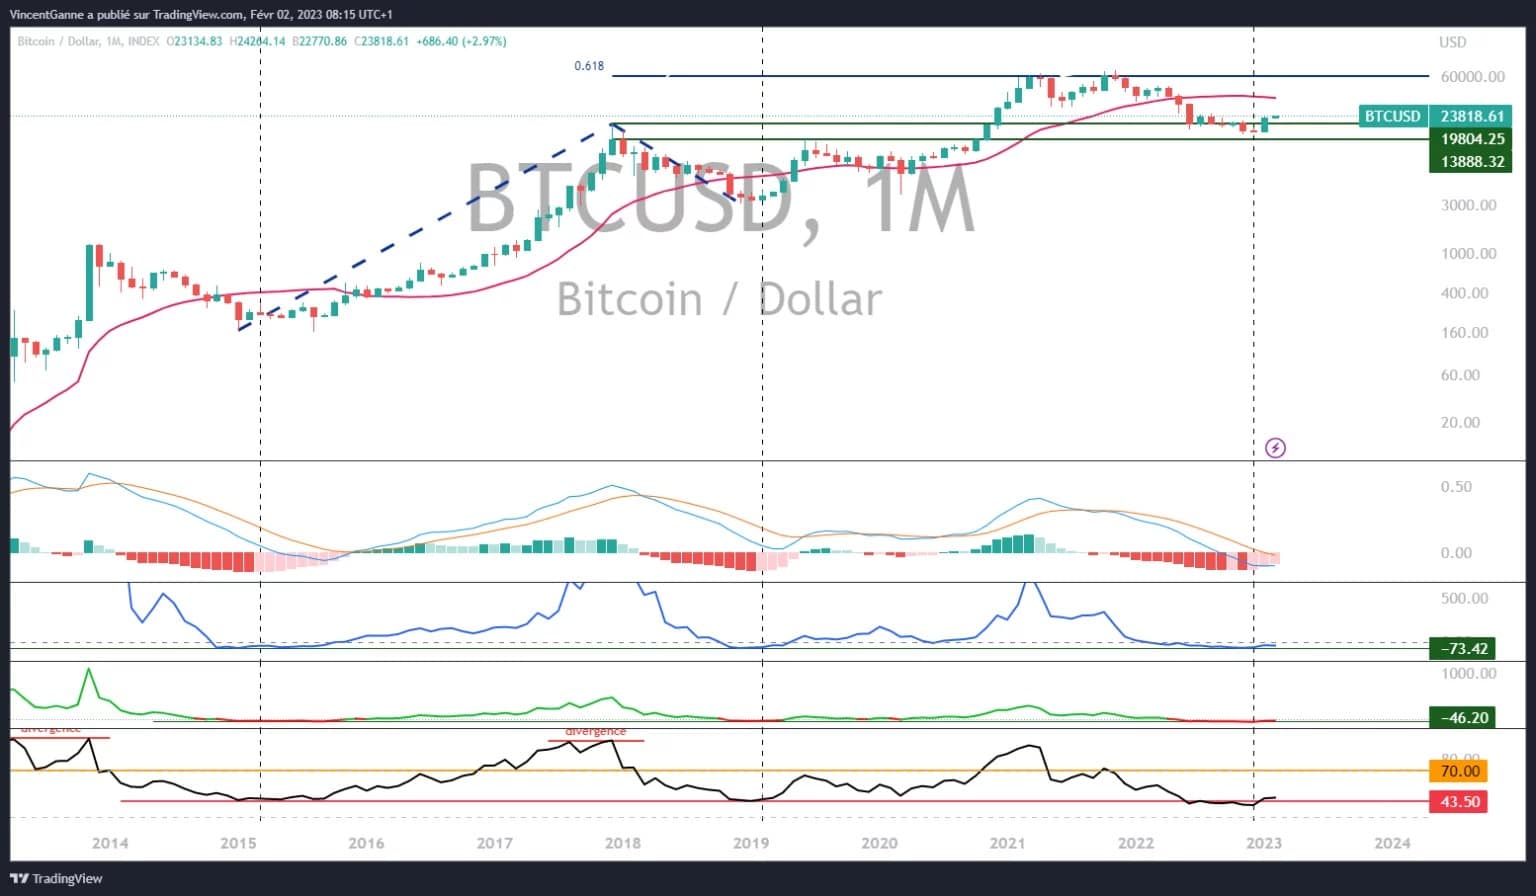
Chart that exposes the bitcoin price in monthly data and under a logarithmic scale