
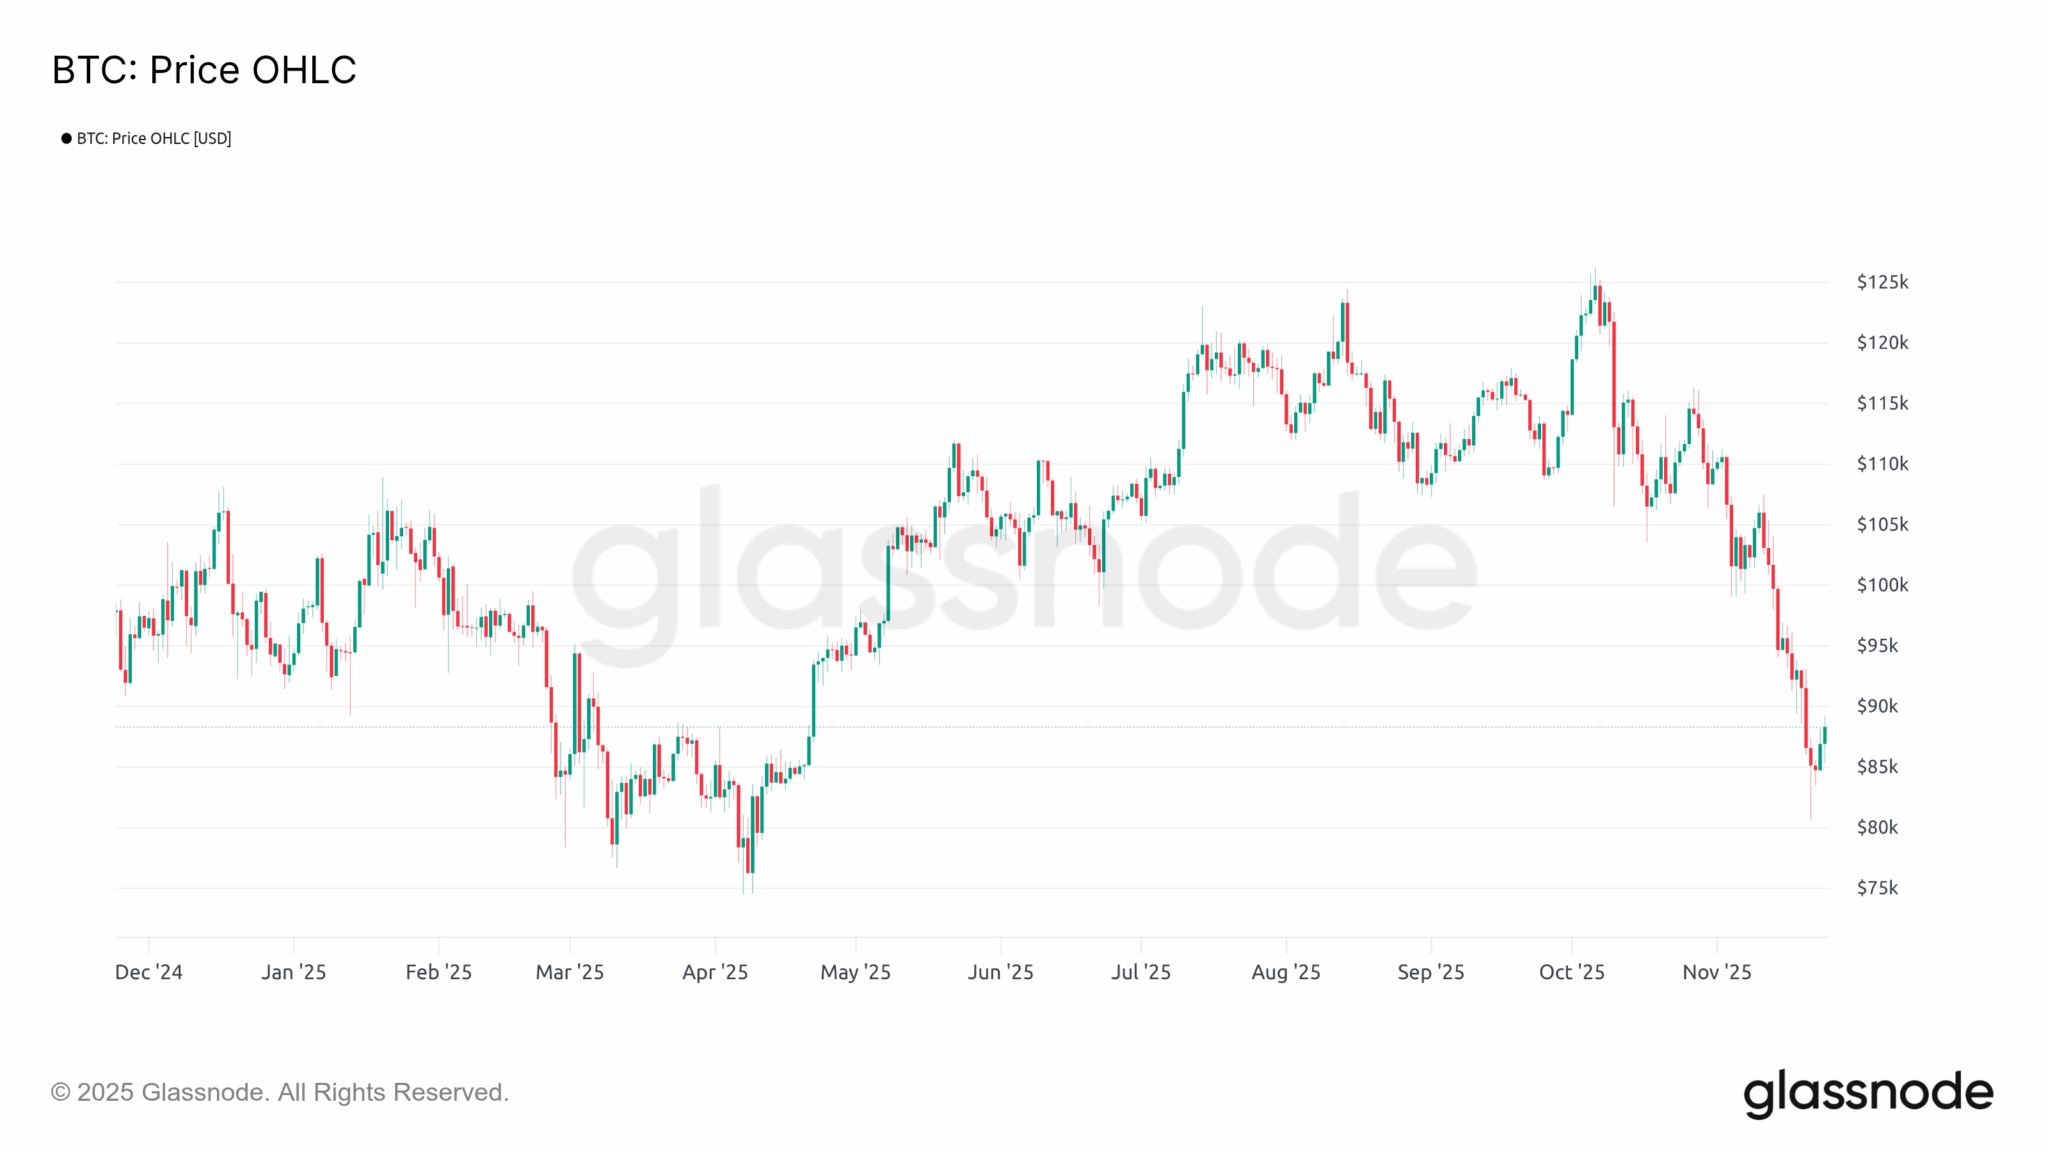
While the price of BTC sank last week, sliding further into a typical bear market zone, the selling pressure observed on exchanges and spot Bitcoin ETFs is finally beginning to ease. This is a welcome respite, even if it is not yet enough to convince us of a real trend reversal.
We must save Private Bitcoin
While the price of BTC accelerated its decline last week, sinking further into bear market territory, selling pressure on exchanges and spot Bitcoin ETFs appears to be easing.
The current market structure seems to favor a short-term rebound, although fears of a dead cat bounce remain legitimate. Is there still hope for BTC? Let’s take stock together!
Key price levels
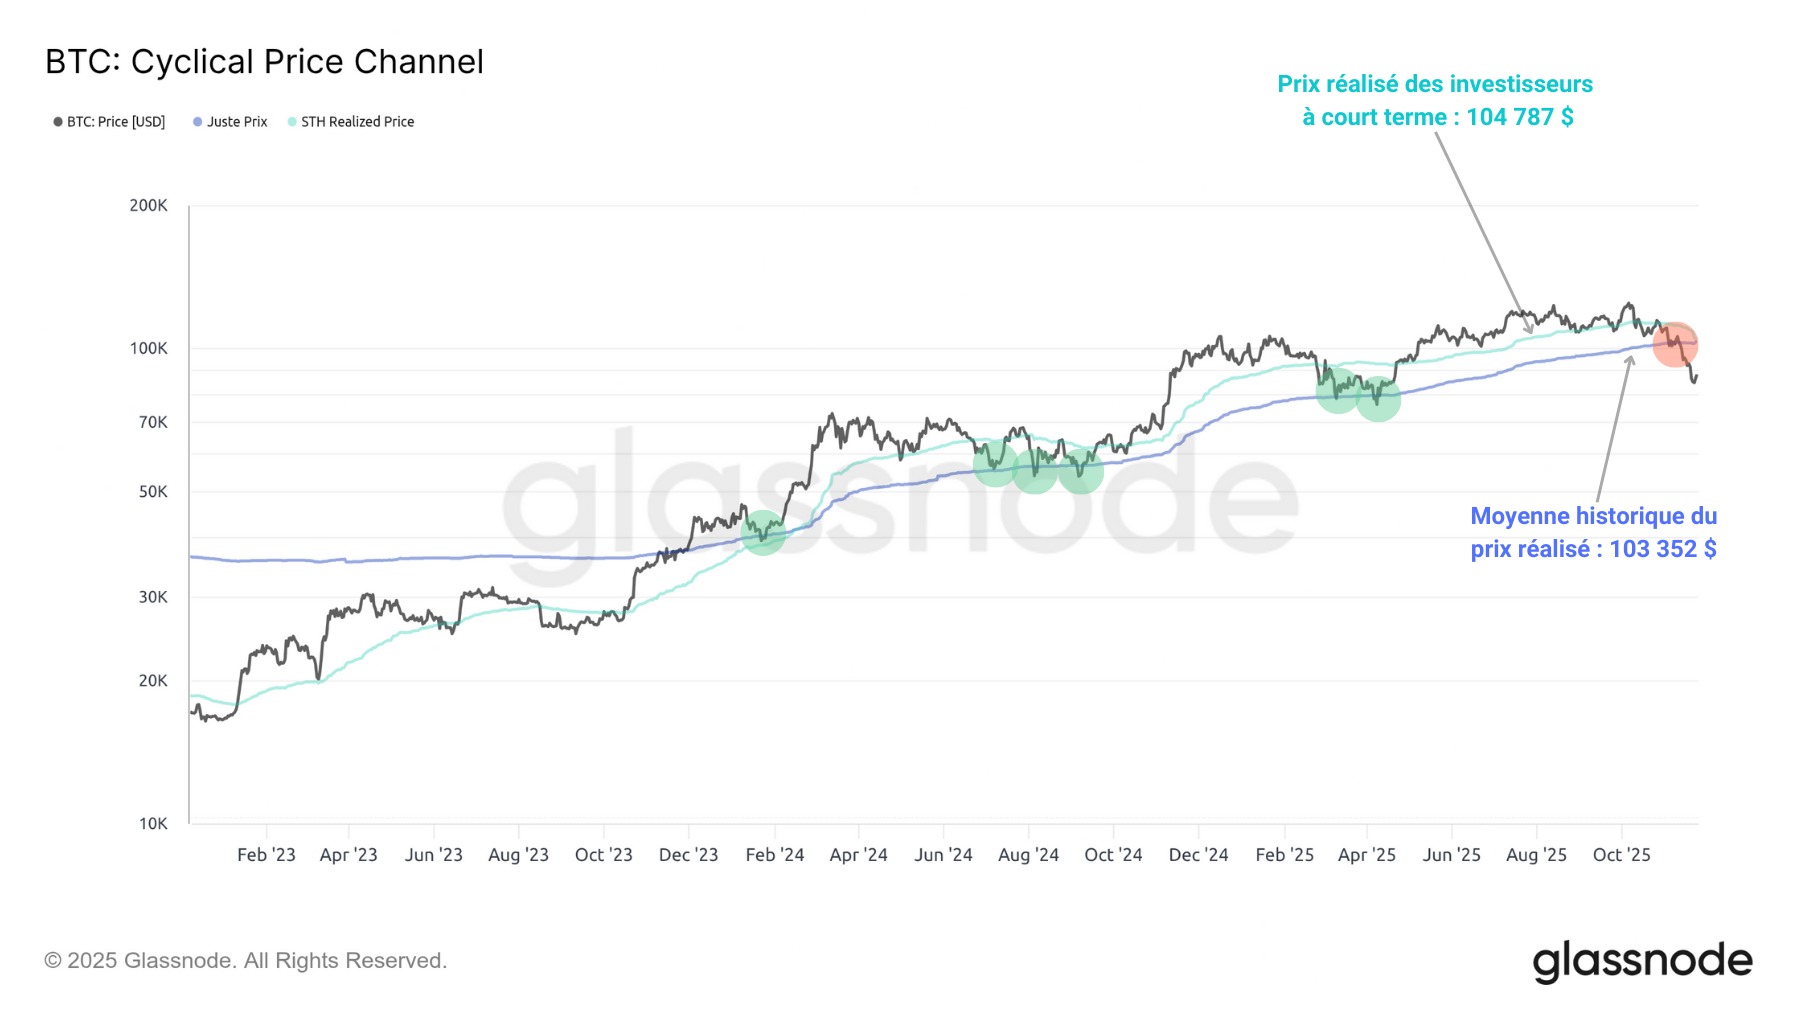
To understand the current market situation, we must first look back at the price levels that Bitcoin has tested in recent weeks.
The key metric is the cumulative average purchase price of BTC (blue curve). This is a kind of market equilibrium point, estimated at $103,352, which represents the boundary between a bull market and a bear market.
When BTC fell below this threshold, after defending it throughout the bull market, it triggered a rapid capitulation and a drop of around 20%.
If a rebound occurs, this level will serve as a major confidence test to estimate whether the rise is a simple technical recovery or a true dead cat bounce.
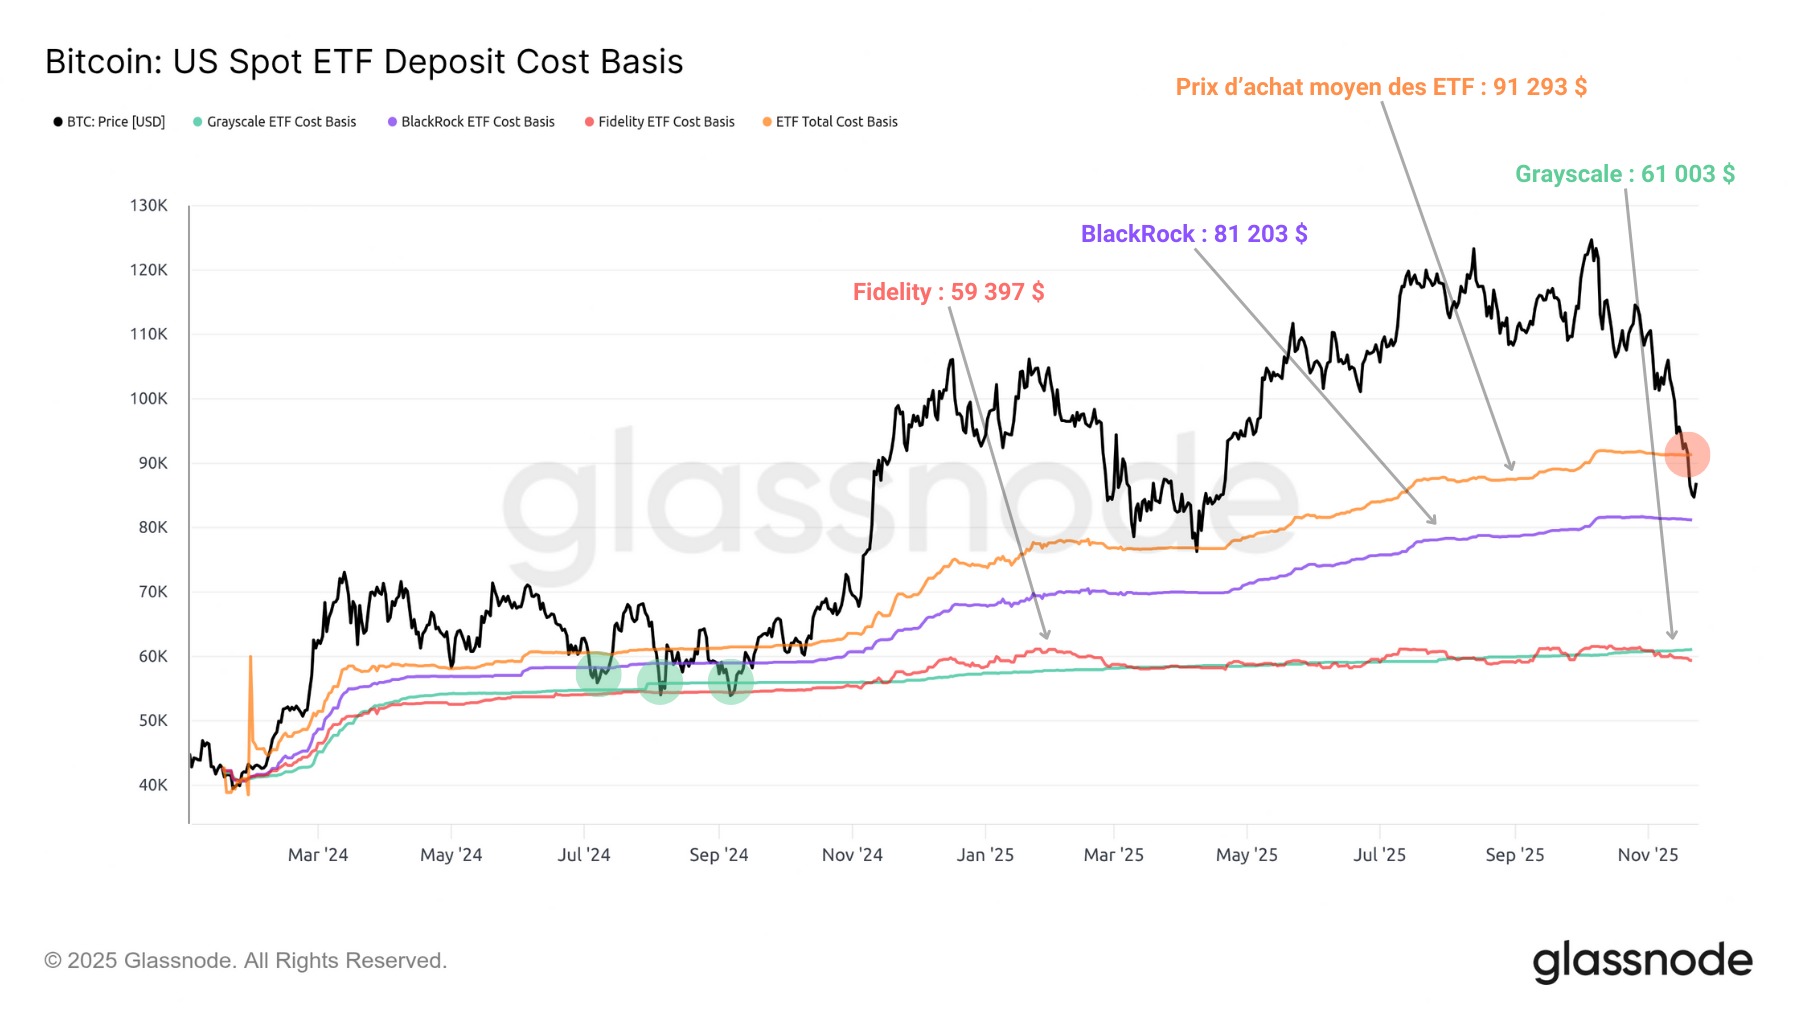
During its decline, the price of BTC fell below the average purchase price of spot Bitcoin ETFs and even dipped close to the average price of BTC held by BlackRock.
In theory, these thresholds represent major support levels, with institutional investors seeing the current decline as an attractive buying opportunity. During the summer of 2024, several of these thresholds served as support for the BTC price, around $55,000. It remains to be seen whether ETF inflows will confirm this theory in the coming days.
Short-term opportunity?
Following a correction of nearly 35% from its ATH, BTC is likely to attempt to stabilize before choosing a new direction. It is in this context that short-term opportunities may arise, particularly if significant demand is expressed on the spot markets.
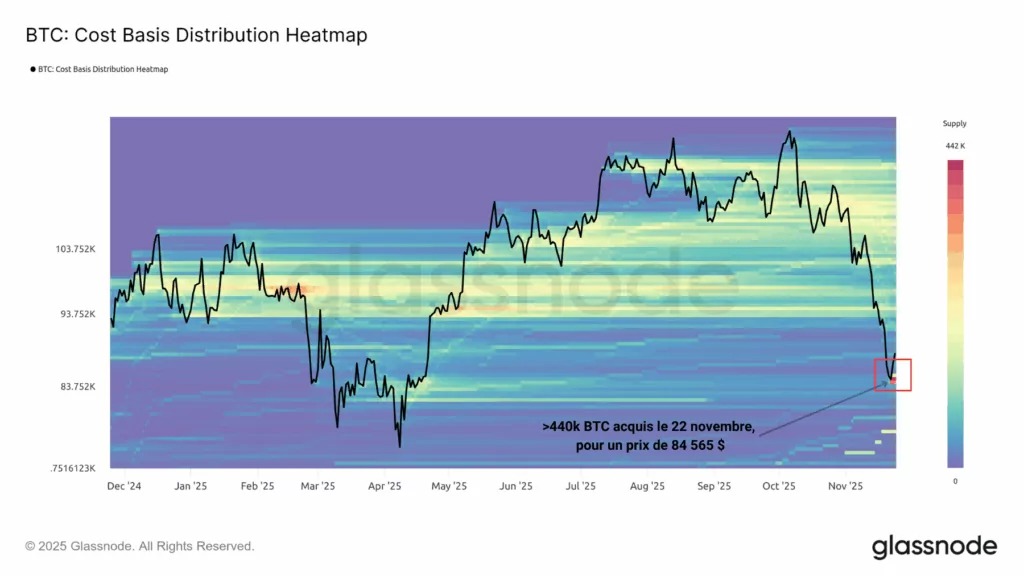
Last Saturday, nearly 440,000 BTC changed hands at around $84,500. Such accumulation is not insignificant; it reflects a return of appetite on the spot market. Are some investors aware of something we don’t know?
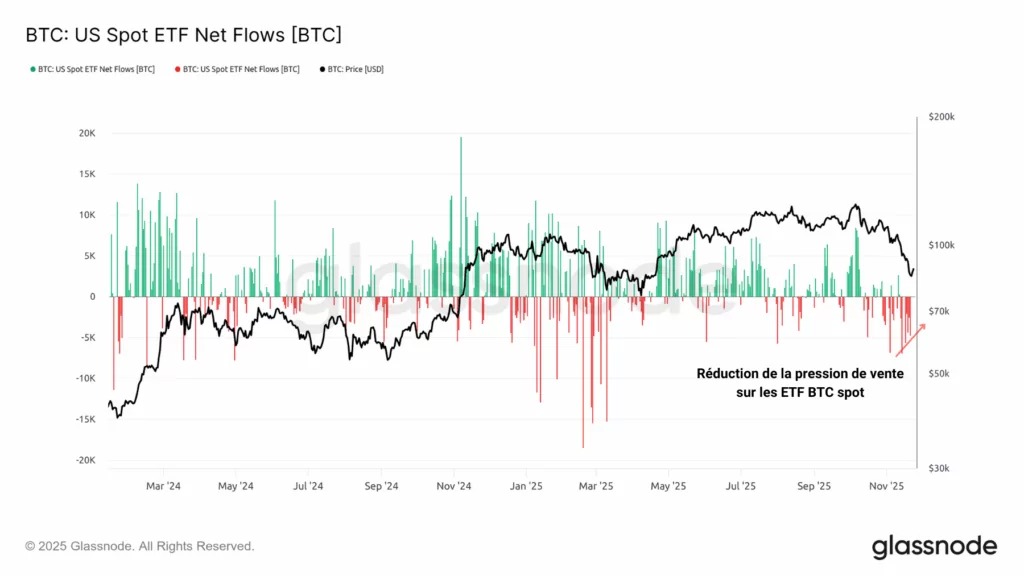
On the spot BTC ETF side, the picture is mixed:
- The intense selling pressure of recent weeks seems to be easing, providing welcome relief.
- The start of the week remains subdued. Inflows are almost zero, suggesting that institutional buyers are still hesitant to re-expose themselves to Bitcoin.
Their behavior will need to be closely monitored in the coming days and weeks to assess whether or not their demand pressure is increasing.
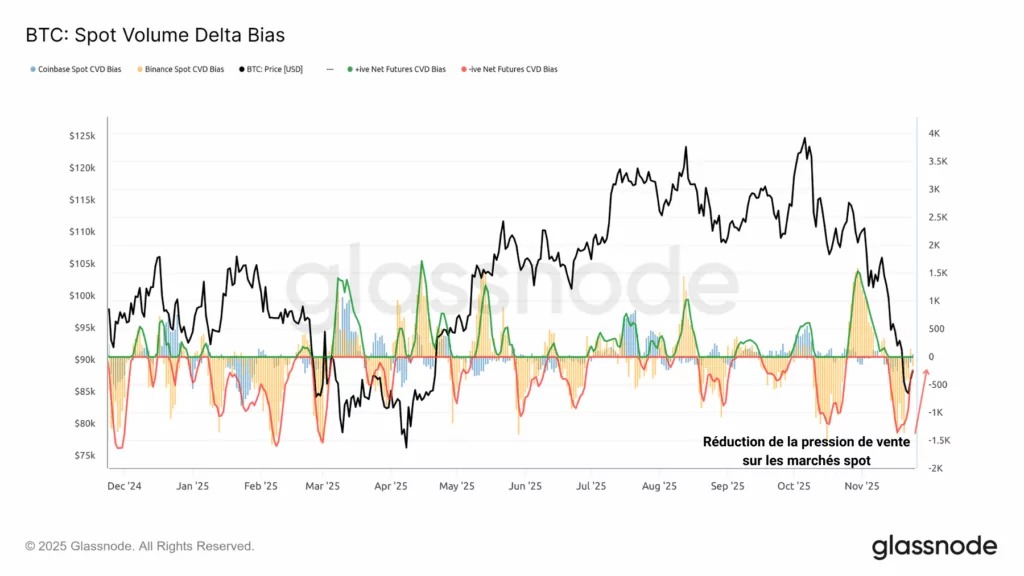
The situation is similar for centralized spot exchanges: net selling pressure is easing, but there is no major demand flow to report at this time.
The entire market seems to be on the lookout, waiting for a new impulse in the BTC price to take a position.
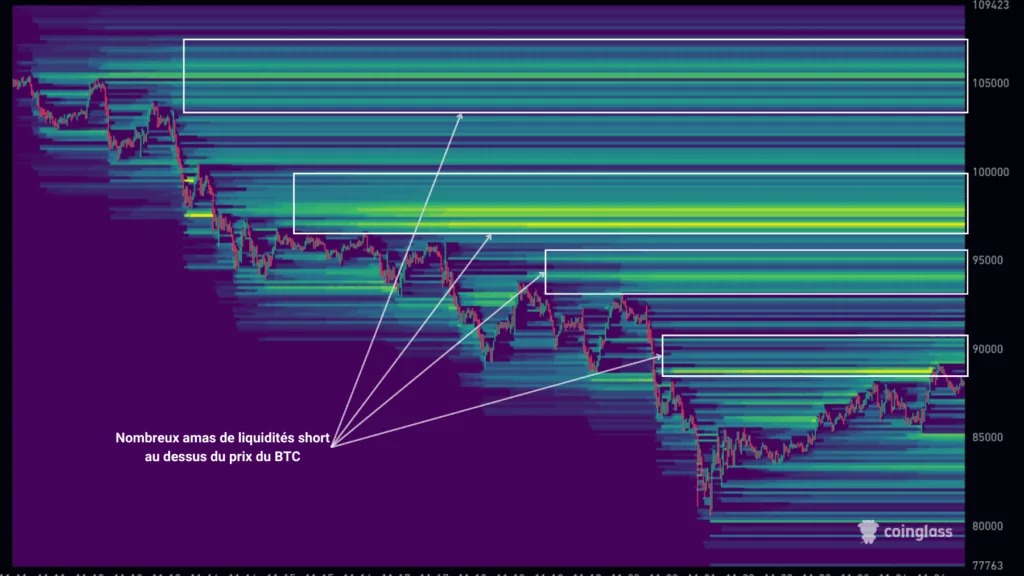
Finally, in the derivatives markets, significant volumes of short liquidations occurred throughout BTC’s decline. There are now several major clusters of liquidity above the current price, fueling hopes for a bullish recovery, potentially catalyzed by a short squeeze.
If the price manages to rise high enough to force the liquidation of shorts positioned up to $100,000, this could reignite the bullish momentum. Perhaps there is still hope for the BTC uptrend!
Summary of this on-chain analysis of Bitcoin (BTC)
In summary, this week’s on-chain data shows a market in a technical rebound position.
As Bitcoin approaches the average price of BTC acquired by BlackRock’s spot ETF, selling pressure on exchanges and spot Bitcoin ETFs appears to be easing, but no major demand flows are yet visible.
Last Saturday, a volume of nearly 440,000 BTC was acquired around the $84,500 level. This massive spot accumulation is a significant sign of interest, while large clusters of short liquidity are fueling hopes for a bullish recovery, potentially catalyzed by a short squeeze.