While holding major support for now, crypto currencies must now rebound to avoid another correction. Will Bitcoin (BTC) and Ether (ETH) be able to rebound soon?
A daily reversal in Bitcoin is coming?
Since the beginning of January, the Bitcoin (BTC) price has been trying to hold above $40,000, an important support to hold in order to finally consider breaking back to new price records in the coming months.

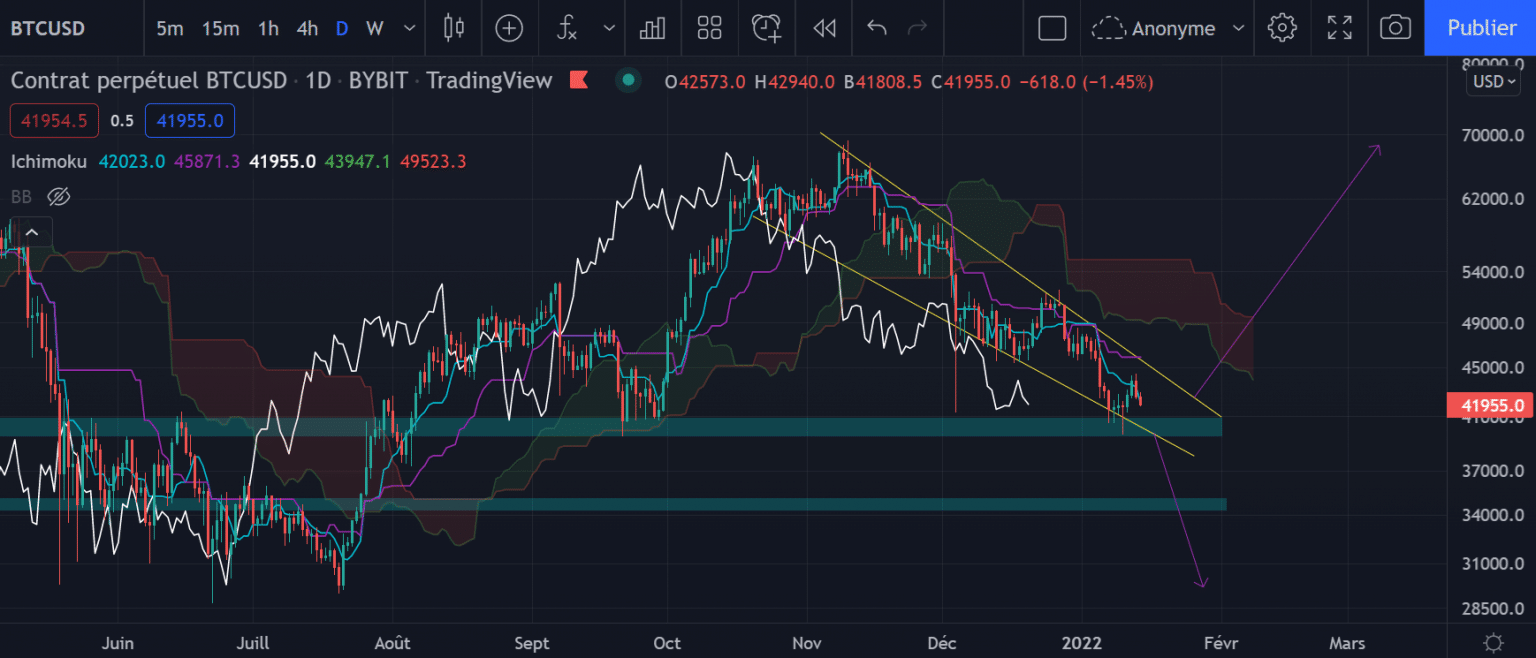
The Bitcoin Daily Chart
On the daily chart, we can see that a bearish range has developed since the ATH (All Time High), with the price moving within a descending wedge. If this type of pattern ends up breaking from above in the vast majority of cases, it will however be necessary to wait for the break of the high trendline as well as the resumption of the Kijun at $45,900 to turn them into supports allowing to pass through the cloud.
If the price manages to regain the cloud as support, the bullish momentum will be relaunched, with a target break of the wedge around $67,600 (the target for breaking a wedge being defined at the level of the highest point of the pattern).
Should the price break its major support at the $40,000 close, there is a good chance that BTC will then move back to its next support at $35,000 and a breakout target of the Shoulder Head Shoulder pattern will also give a bearish target at $30,000.
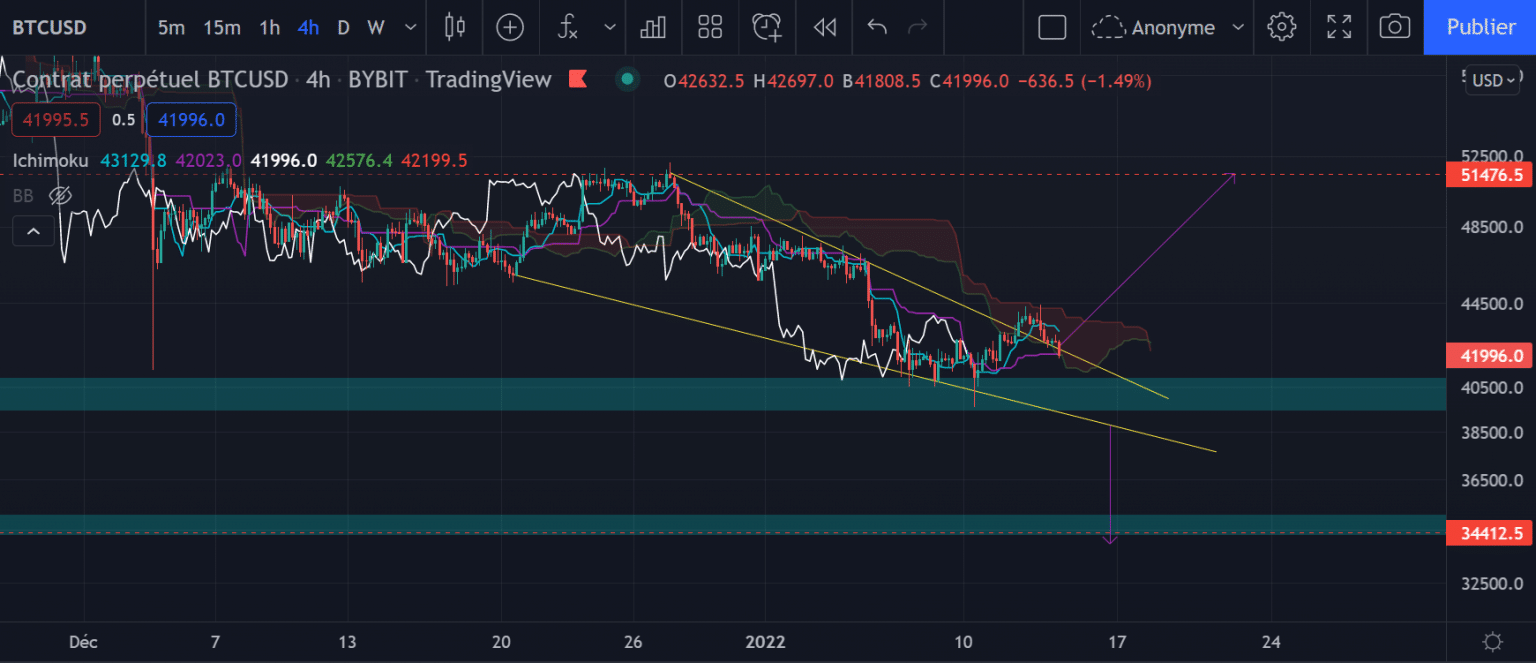
A Downward Bevel Break at h4
In the shorter term, the price is moving within a triangular range. If the breakout has already taken place, we will have to watch in the coming hours the reaction of BTC on its Kijun and Trendline level around $42,000.

The H4 chart of Bitcoin
As long as the price remains above the $40,000 support, the breakout scenario from the top remains highly likely as it is moving in a reversal pattern. In case of a breakout from the top, the price should therefore move back towards $51,400 (the highest point of the pattern). If on the other hand the support gives way, the short-term bearish target will be $34,400.
Ether is in a bearish channel
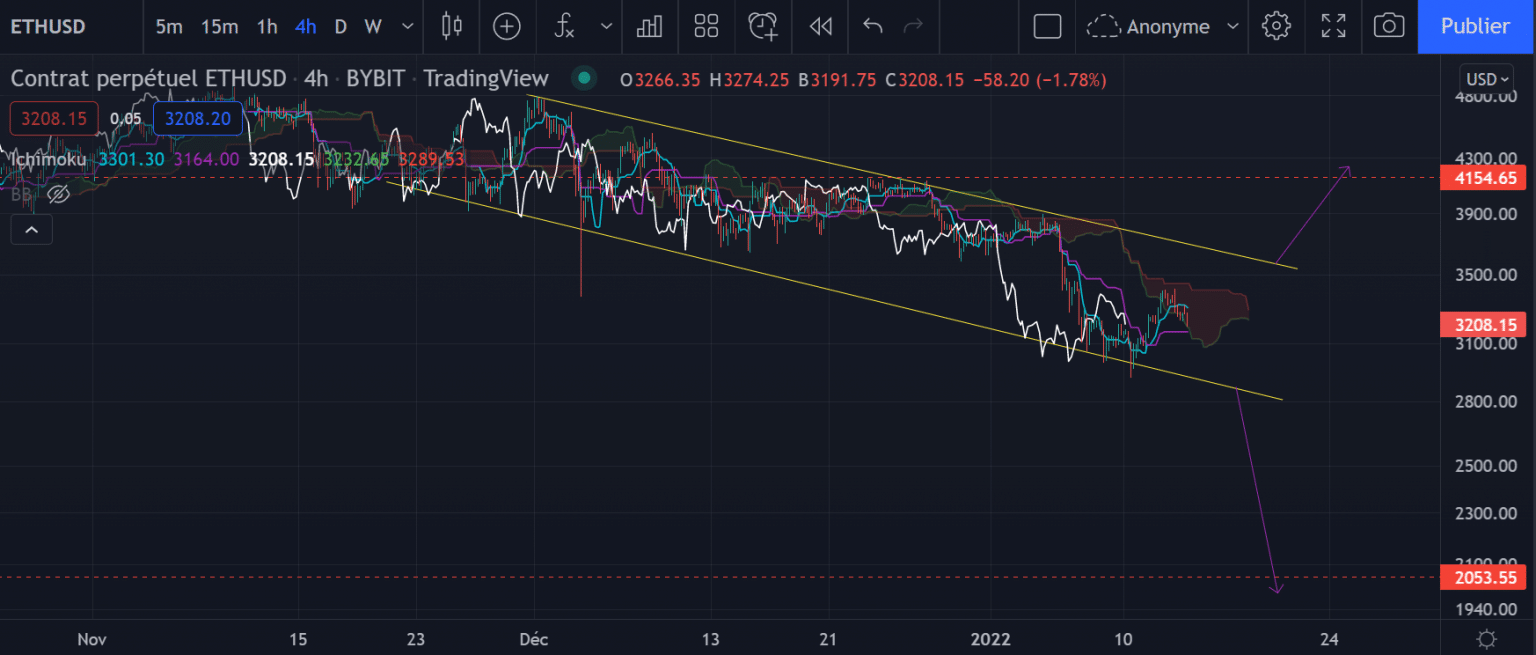
Since the beginning of December, ETH clearly remains in a bearish channel and has not yet been able to take a direction.

Ether (ETH) chart in H4
However, with the price having regained the Kijun in support, it seems possible to get a break of the cloud in the next few days, which would allow the price to gain further support and break its trendline.
A breakout from the top would give a target at $4,100 (height of the pattern carried over to the breakout point) and a breakout from the bottom of the channel would take price to a target at $2,000.
