
The summer season is beginning in an interesting market context, marked by performances that raise questions about the long-awaited arrival of the altcoin season, which has been hoped for since the beginning of 2023. Is the time finally here to believe in it?
Is the summer context really unfavorable?
A bullish season for altcoins cannot happen without a globally bullish market. However, when trading on the markets, most investors refer to strict rules that guide their decisions.
One of the first, and probably one of the easiest to apply, is based on the analysis of annual cycles, particularly periods when statistical data suggests that it is more prudent to invest or withdraw from the market.
In the cryptocurrency space, Bitcoin naturally serves as a benchmark and presents the following statistics for the second half of the year:
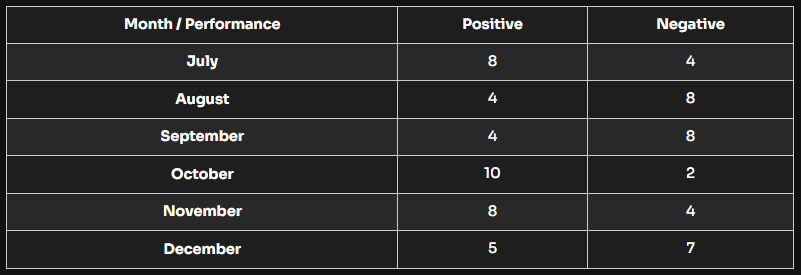
Of course, these statistics do not predict price movements in 2025, but they do offer a retrospective view that shows that the summer period frequently ends with a corrective phase.
What is particularly interesting is that, in 100% of the cases observed, a positive August is systematically followed by a negative September in terms of performance.
Thus, the bullish momentum we are currently seeing could well continue until the end of the summer, with a probability of around 33% (i.e., 1 in 3 cases). However, in this scenario, a correction would be expected in the fall, followed by a bullish recovery in October in 83% of cases.
These factors suggest that there is real room for maneuver in terms of timing for altcoins’ summer performance, while bearing in mind that a sharp correction could occur in August or September, thus laying the foundations for a potentially more favorable end to the year on the upside.
Is Bitcoin ready to let crypto shine?
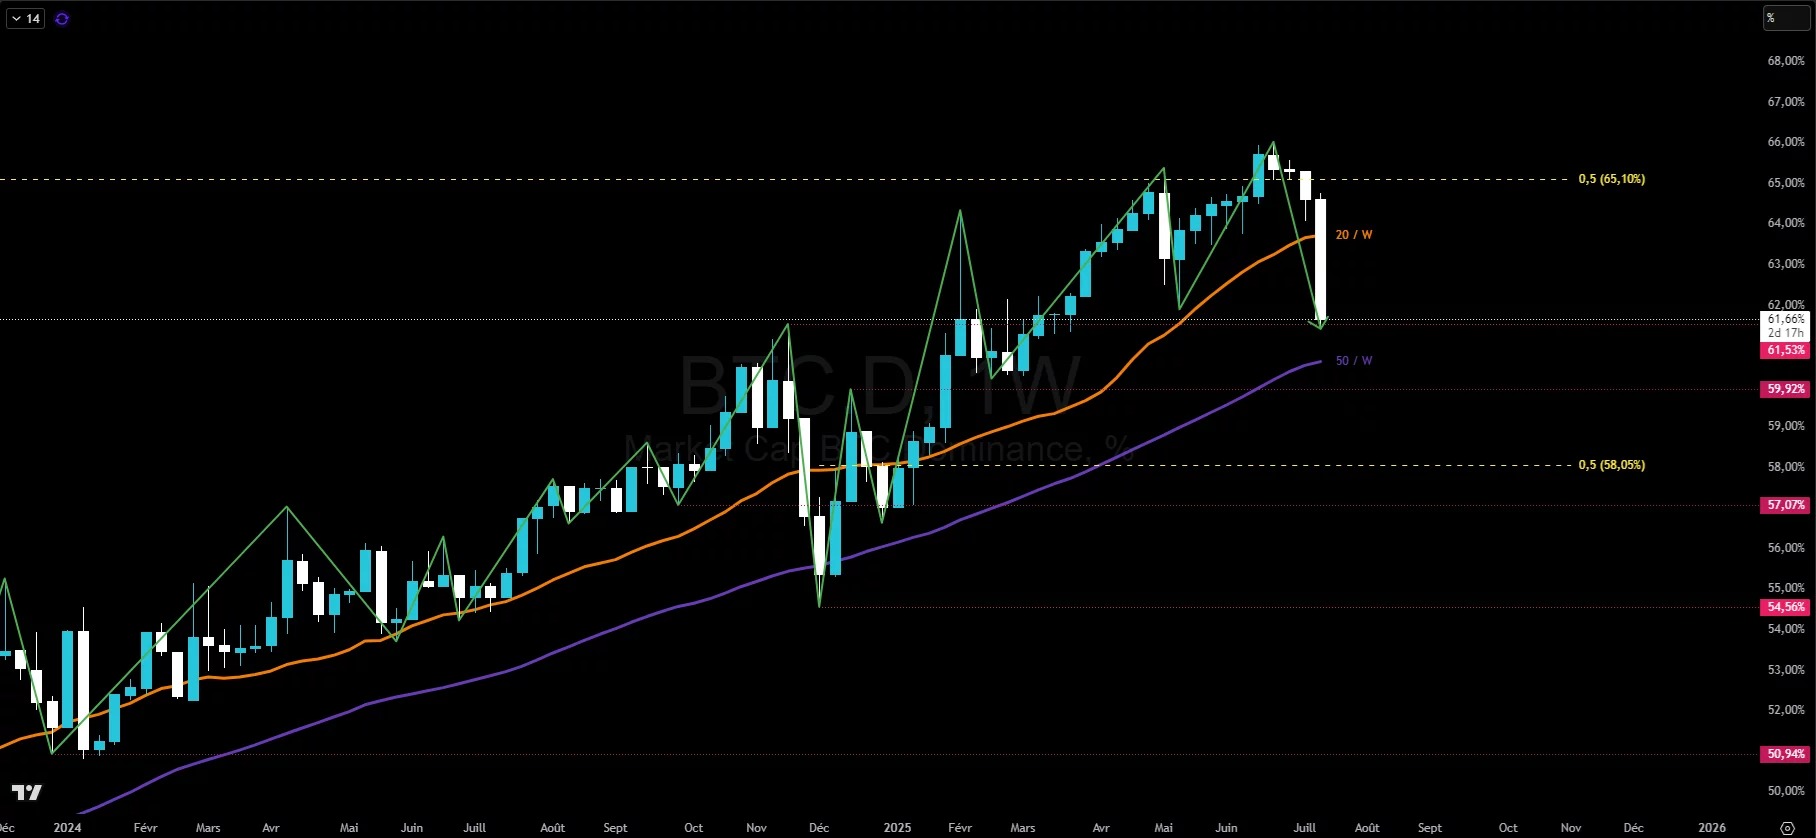
Bitcoin’s dominance remains a relevant analytical tool for understanding the performance of altcoins, although this chart essentially represents the aggregate performance of the major capitalizations against BTC.
The influence of Ether, or any other cryptocurrency in the top 10, is particularly significant here. This configuration also reflects the first stage of a classic bullish cycle in the cryptocurrency market: the strongest assets first take over from Bitcoin, before interest gradually spreads to smaller market caps.
Although dominance is not strictly speaking a technical indicator, it can be used to identify structural trends in capital flows. This week, the bullish momentum appears to be faltering, with the emergence of a local peak around 65% dominance.
The technical zone between the November 2024 peak and the mid-May low is currently being tested. If broken, dominance could seek its 50-week moving average, which has acted as support since January 2023.
A clear technical signal indicating a break in the underlying uptrend would be a double close in 3-day units below this average. Such a scenario could trigger massive arbitrage in favor of the most robust altcoins and initiate a profound structural reversal within the market and an acceleration in favor of alts.
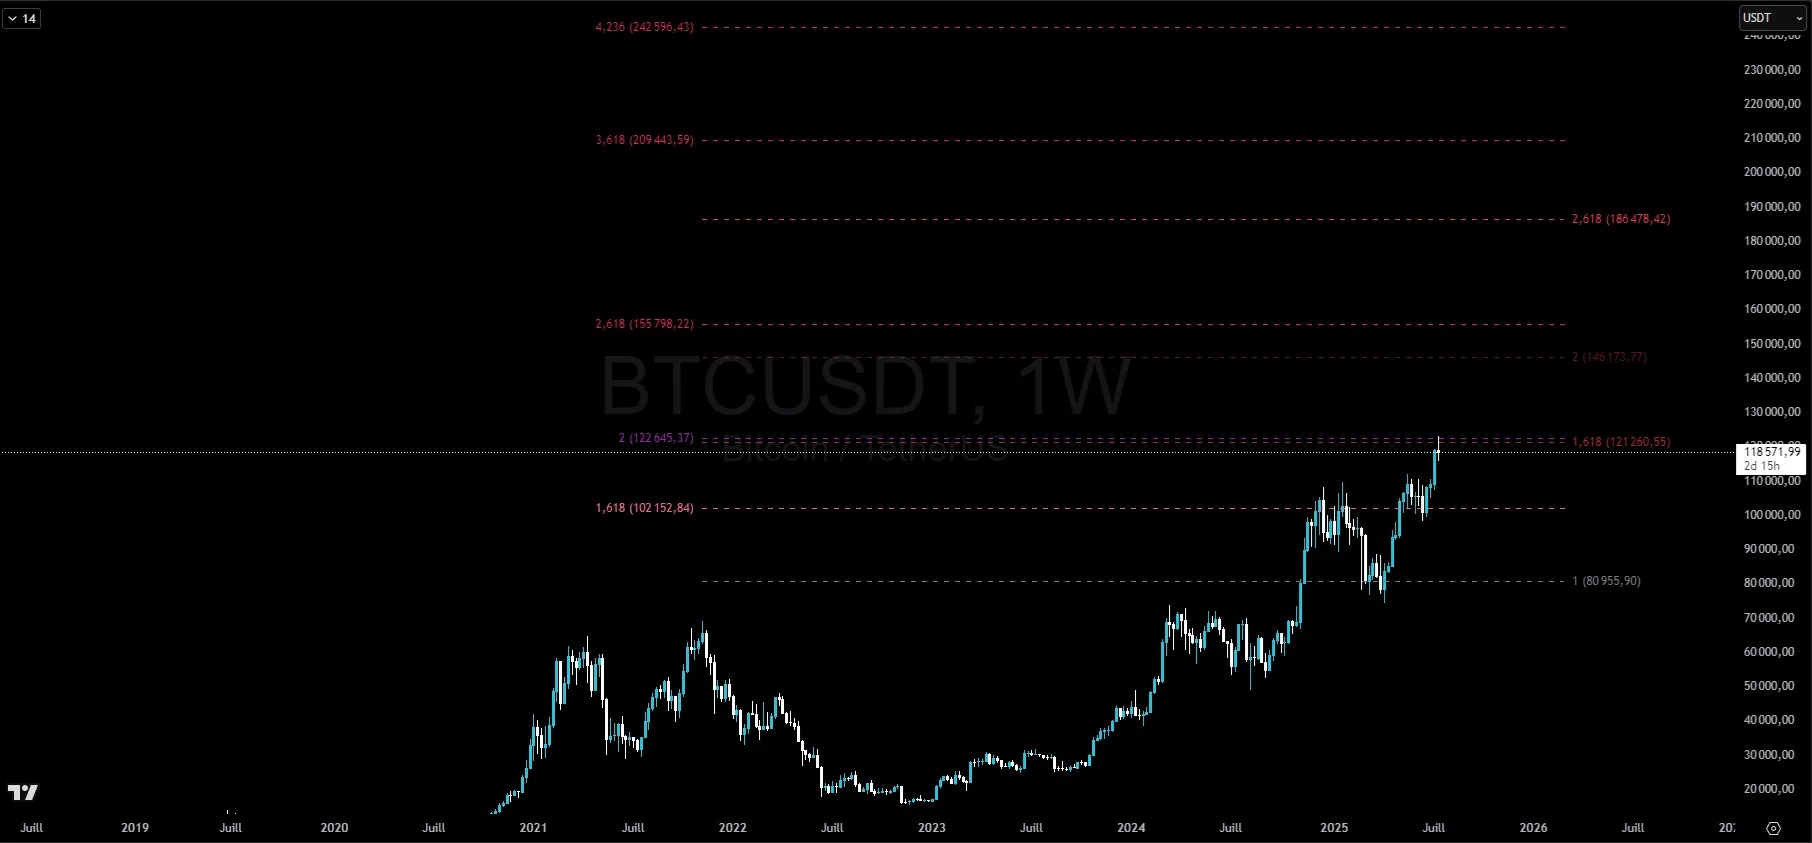
The likelihood of an altcoin season would be reinforced if Bitcoin entered a “topish” configuration, marking the achievement of its cycle targets and initiating a consolidation phase around current levels, pending a clearer directional signal.
The $120,000 threshold is a major technical target, confirmed by two separate analysis methods based on Fibonacci retracements. In this context, it is conceivable that Bitcoin could move sideways in a range between $110,000 and $120,000.
This stabilization phase could provide favorable ground for large caps in the ecosystem, allowing the market to regain some balance before deciding between a bullish continuation or a correction.
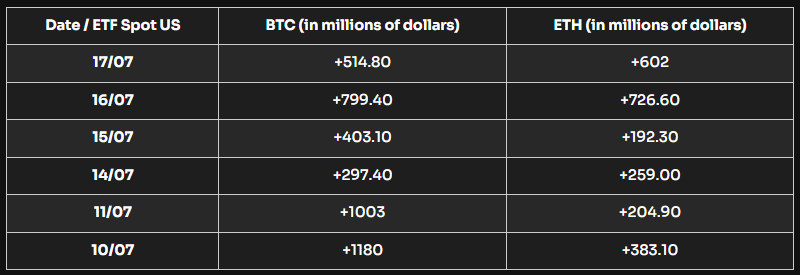
ETF flows reveal institutional investor interest in Ethereum
Capital inflows into US spot ETFs dedicated to Ether are currently reaching unprecedented levels, breaking historical records in recent days. What is particularly noteworthy is that these flows are rivaling those recorded on Bitcoin spot ETFs, which remain strong.
Significantly, yesterday’s inflows into the Ethereum ETF even surpassed those of Bitcoin.
This bodes well for the future of these ETFs and marks a significant turning point at a time when calls to activate returns through staking are becoming increasingly insistent.
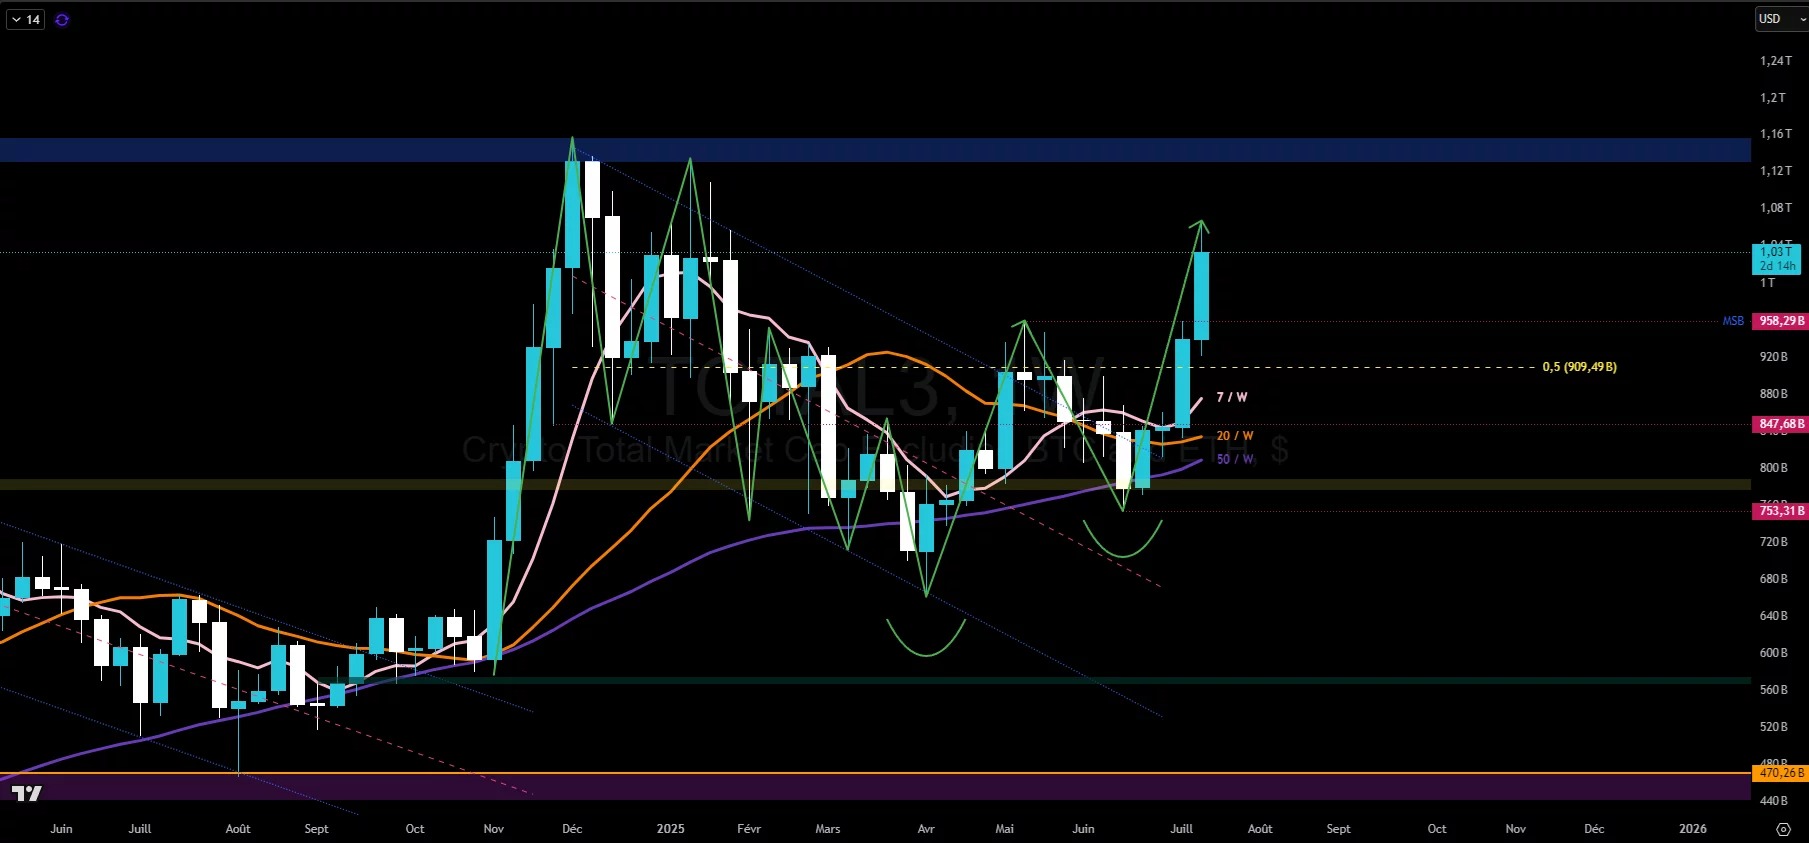
What technical information is available on crypto totals?
The performance of two cryptocurrencies currently weighs heavily on the market: Ether and XRP are developing significant bullish momentum, adding around $200 billion to the chart since the beginning of July.
The performance of the totals is therefore largely a consequence of the performance of these two cryptocurrencies, which have added $130 billion and $76 billion to their market capitalization since the lows of July 2.
While the performance of TOTAL3 must be put into perspective in light of the success of these projects, the chart shows a pattern that can be observed across various cryptocurrencies in the ecosystem:
- A bearish spike in early April marking a major low,
- a new low in mid-June, higher than the previous one,
- a trend reversal this week with the break of the mid-May high,
- an upward realignment of the weekly moving averages,
- a reopening of the Bollinger Bands conducive to volatility.
Thus, the strongest cryptos currently are those that manage to follow this pattern. Some have broken through the mid-May peak, developing a strong bullish phase (PENGU, BONK, CRV) that is part of a weekly trend reversal.
Others seem to be lagging behind but could be next (DOGE, LINK, MORPHO). The weekly trend change is an important signal that could trigger a sustained bullish phase for cryptocurrencies that manage to materialize this movement.
If this pattern becomes widespread and capital flows continue to shift towards low-cap altcoins, the long-awaited altcoin season could finally materialize.
In summary, several indicators suggest that a favorable dynamic for altcoins to outperform Bitcoin is taking shape. However, a few confirming signals are still needed to validate this scenario.
In addition, Bitcoin could still seek to develop a final bullish leg, which could temporarily slow down the momentum of altcoins. Nevertheless, the strong performance of large-cap coins such as Ethereum and XRP could reignite risk appetite and encourage investors to reposition themselves more actively across the altcoin market. So, is it altcoin season or not? Feel free to share your thoughts in the comments.