
While Bitcoin (BTC) and Ether (ETH) are stabilizing on their weekly supports, the market seems to be waiting for this Sunday’s close to take off again. What are the scenarios to watch for on cryptos
BTC consolidates around $30,000
This week, the price of Bitcoin (BTC) continued its range around the weekly support at $30,000. A key level to hold again this Sunday at the weekly candle close
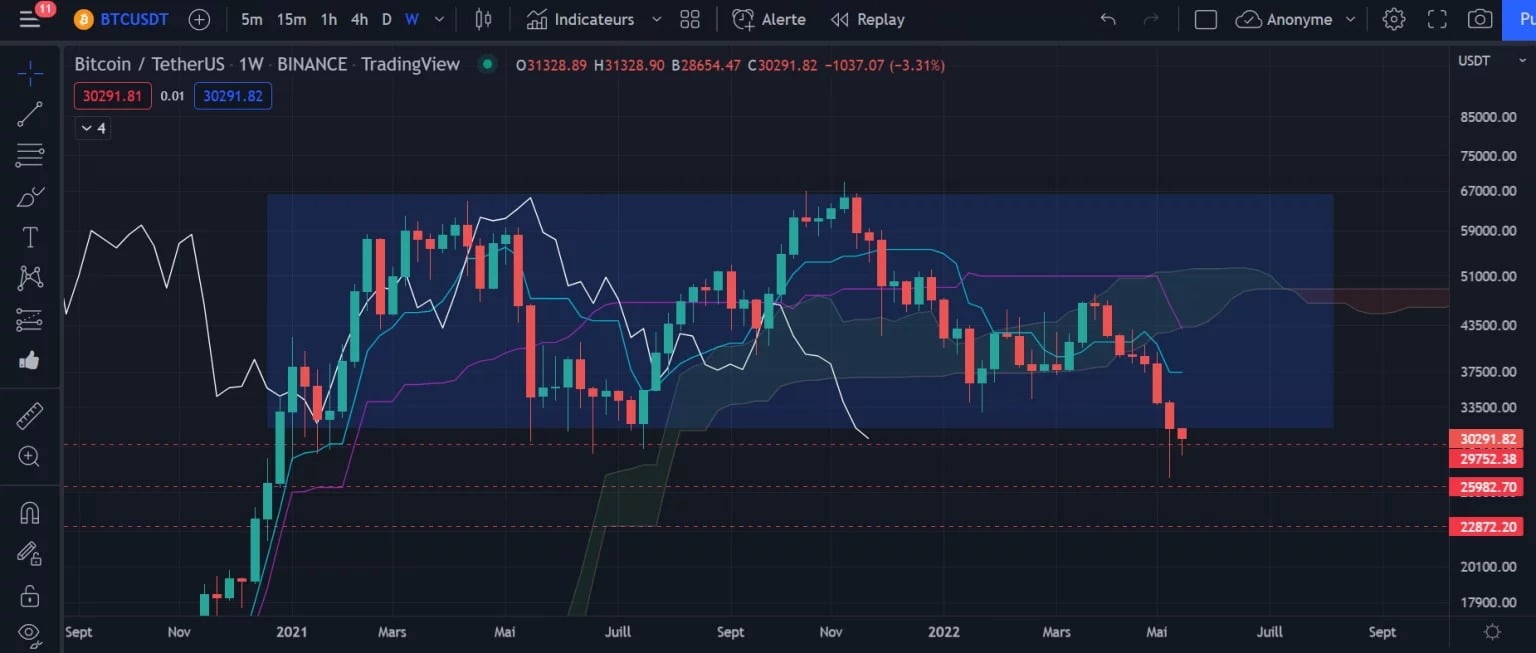
Figure 1: Weekly Bitcoin Price Chart
Already last week in our previous analysis we mentioned the importance of the price closing within the range built up over the last few months on Bitcoin. A level that has never given way on a weekly close and that has always allowed the price to go towards new price records.
The scenario is therefore simple, the price will have to re-enter the range to then aim for a return to the Tenkan around $37,500. Assuming a bullish rebound thanks to the $30,000 support, we then see a cloud twist in July, which could well draw BTC progressively for a retest of this level. This area will of course be one to watch in due course, if the bounce does take place.
Should the price break its support of the last few months, we would then have to rely on the $26,000 level, or even the $22,800 level to help the price recover.
Bitcoin breaks a h1 reversal pattern
In the shorter term, BTC is trading in a range between $27,800 and $32,000 after the break of the yellow widening wedge. We also note that the orange trendline has been broken and then retested in pullback twice, showing the relevance and strength of this support.
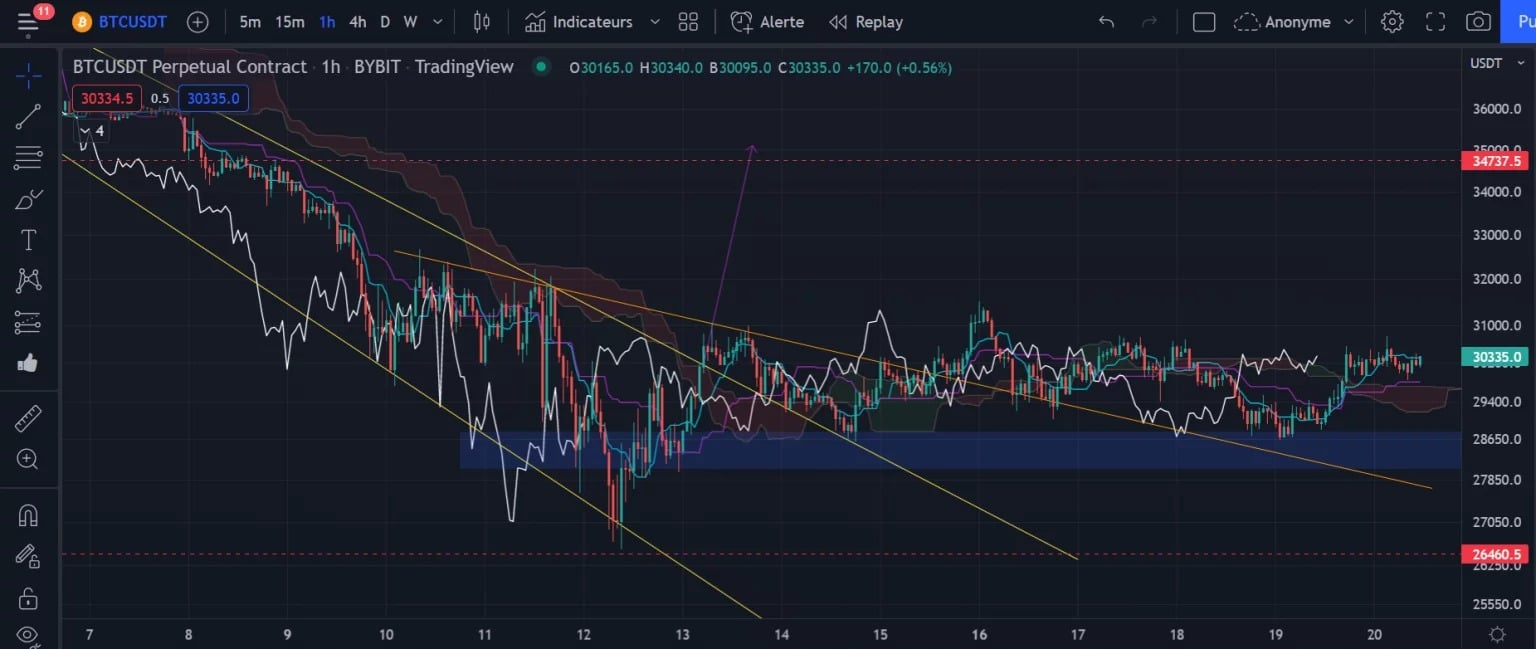
Figure 2: Bitcoin price chart (h1)
As in theory this type of chartist pattern most often breaks from above, we can expect the price to return above $34,000 (height of the bevel at its exit, carried over to the breakout point). A target that would also correspond to a return to the Daily and Weekly Kijun.
A break of $32,000 would be a nice short-term bullish rebound signal and would allow the weekly range to be re-entered with the weekly bullish scenario in mind. However, the bearish break remains to be watched, in an unstable economic context where doubt and uncertainty are making their way. The support at $28,000 in blue, on which we have already had multiple bounces in the past, will therefore have to be held at the close h1 or risk invalidating the target at $34,000.
Ether (ETH) soon back to $2,500 in the short term
Like last week, the price of Ether (ETH) is still showing us a downward widening pattern at h1. As this chart pattern has been broken from above, the target at $2,593 is now activated.
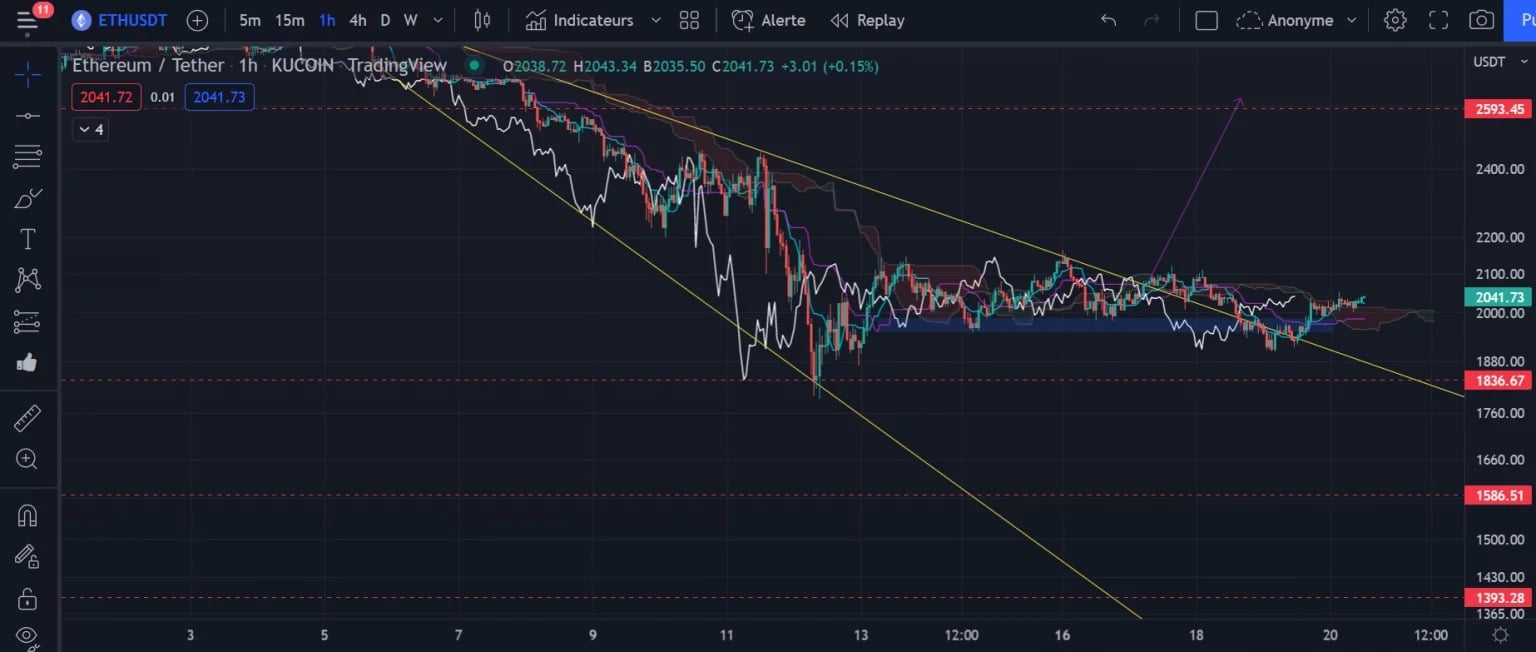
Figure 3: Ether price chart (h1)
To hold this target, however, the $1,900 level will have to continue to provide support, as it has done several times in the past. After a pullback on the upper part of the pattern, the price is back above its cloud, as well as the Tenkan and Kijun. These are supports that are added to the trendline.
If the price of Ether were to fall back below its previous low at $1,836, there would be a risk that the price would move towards the next support levels at $1,580 or even $1,400.
In conclusion
Crypto-currencies look like they will hold their respective support. We’ll have to wait for the weekly close to find out if Bitcoin’s range will be held with a potential bullish comeback, or if the price is headed for more bearish days.