
Since Bitcoin fell by nearly 30% in early October, the key question for investors has been simple: are we witnessing the end of the post-halving bull cycle or just a temporary correction before a new peak? Here is Vincent Ganne’s technical analysis of BTC.
Between cyclical validation and contradictory signals from global liquidity
Since Bitcoin’s price fell by nearly 30% since the beginning of October, the central question for investors has been simple: are we witnessing the end of the post-halving bull cycle or a simple interim correction before a new peak?
However, two major analytical tools offer opposing conclusions: on the one hand, the time cycle correspondence table clearly suggests that the cyclical peak has been reached. On the other hand, the annual growth rate of global liquidity (M2 YoY) has just reached a new high, and historically, Bitcoin has consistently reached a new high within two months of this signal.
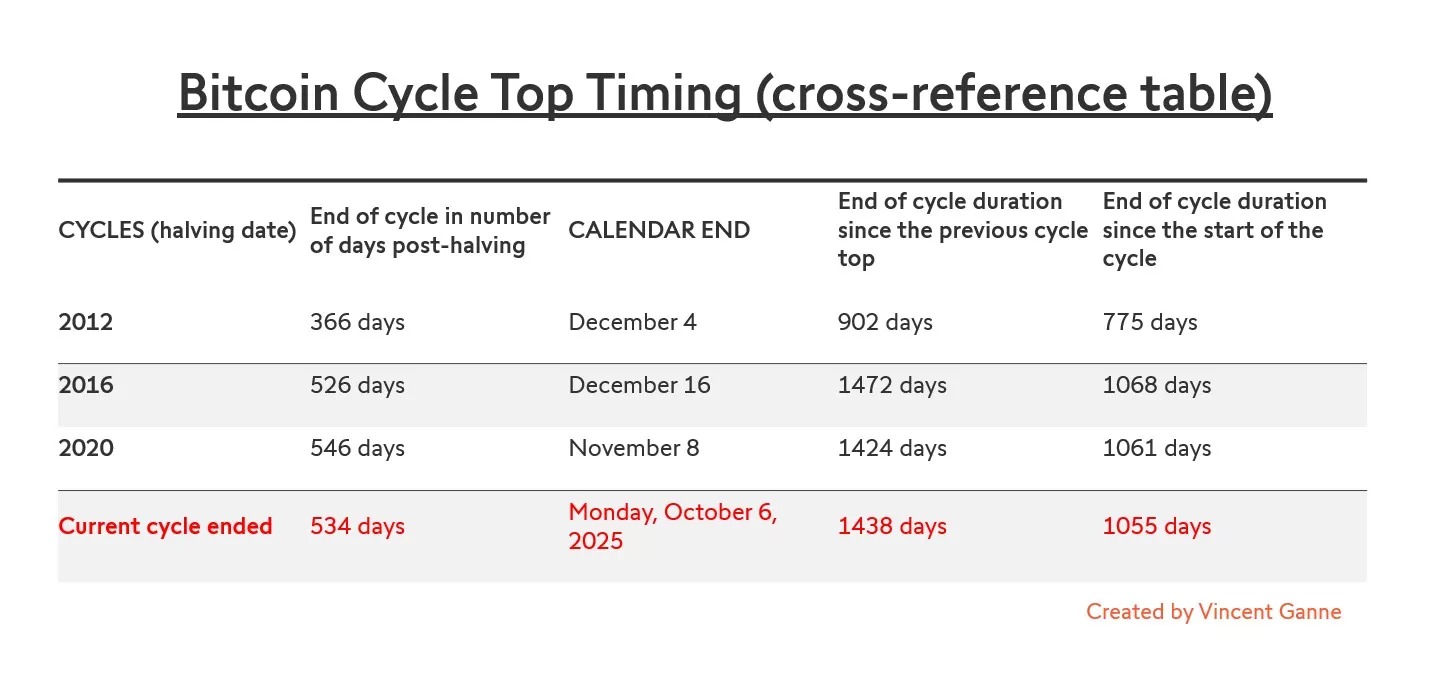
The first chart, a cycle synchronization table based on the three previous halvings, shows that the average time between a halving and the peak of the next cycle ranges from 366 to 546 days.
However, in the current cycle, the estimated end date falls around October 6, 2025, with 534 days post-halving… which corresponds precisely to the area where Bitcoin reached its recent peak before retracing sharply.
The correlation is striking:
- the 2024–2025 cycle aligns almost perfectly with past durations;
- the “since the previous peak” and “since the start of the cycle” measurements are also within historical ranges;
This reading therefore concludes unequivocally that the peak of the cycle would have been reached in early October, and that the current decline is consistent with the logic of entering a structural bear market.
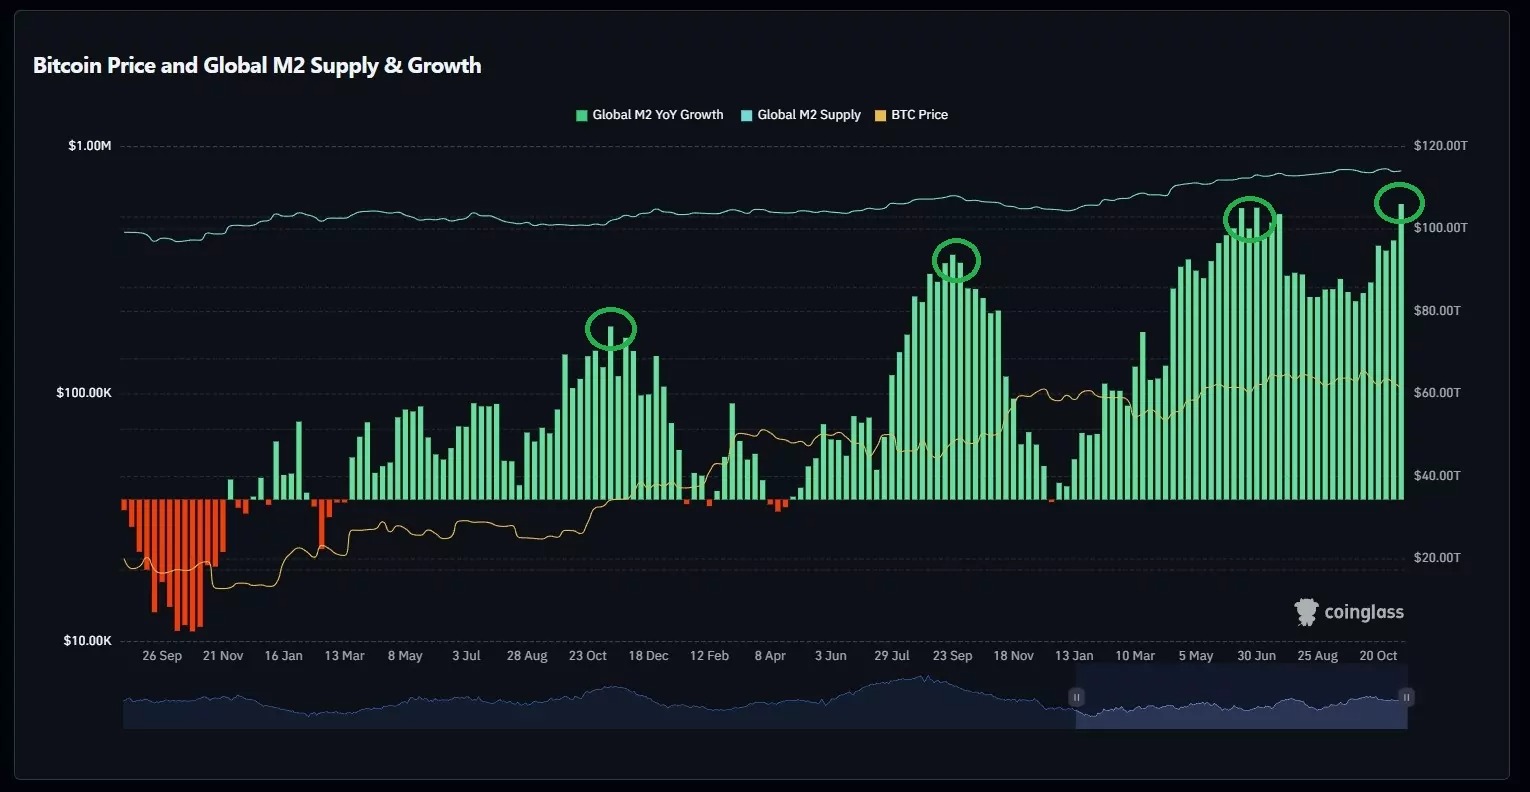
The major counterargument: the momentum of global M2 liquidity
However, a macroeconomic analysis of liquidity contradicts the previous conclusion. The second chart, from Coinglass, shows that the annual growth rate of global M2 has just reached a new peak, surpassing previous peaks since the low point in 2022.
Each time this has happened in the past, the mechanism has been identical:
- a new peak in M2 YoY,
- followed one to two months later by a new peak in Bitcoin.
This correlation has never been invalidated. And above all:
- Bitcoin has not yet reached a new peak since this new M2 record,
- liquidity growth is one of the fundamental drivers of the BTC price
This signal therefore points to a bullish return, even though the market has fallen by 30%, and suggests that the October peak was not the final peak, but possibly an intermediate stage before a bullish recovery at the end of the year.
Conclusion: a peak… perhaps, but not necessarily
The cyclical picture and the structure of the crypto market suggest that a peak has indeed been reached. But the dynamics of global M2 liquidity suggest the opposite.
In other words:
- cyclically: yes, the peak fits perfectly;
- macro-financially: no, a new peak remains likely in the next two months.