
As the US Federal Reserve (FED) confirmed its restrictive anti-inflation monetary policy by raising its key rate to 4%, the Bitcoin (BTC) price is expected to be impacted by the US mid-term elections on Tuesday, November 8, 2022 and finally make its technical choice for an impulsive year-end move.
The FED remains hawkish and the equity market is under pressure
The US Federal Reserve (FED) unveiled a new monetary policy decision on Wednesday, November 2, raising its key interest rate from 3.25% to 4%, confirming its restrictive anti-inflation policy.
Although Jerome Powell mentioned a possible slowdown in the pace of the rate hike, the latter is not close to ending without the first signal of disinflation, a context that remains difficult for risky assets in the stock market.
According to the market consensus, the US central bank should continue to raise its key rate to the 5% level early next year. This is at least the lesson of the price of future contracts traded on the Chicago Stock Exchange on the Fed Funds interest rate.
This restrictive monetary outlook will continue as long as core inflation (excluding energy and food) remains on an upward trend and the US labour market remains under pressure.
The chart below is a reminder of the link between falling equity prices and rising market interest rates, a cross-asset framework that is not favourable for crypto-currencies.
In the immediate term for the start of November, it is the US mid-term elections that will influence stock prices.
On Tuesday 8 November, all seats in the US House of Representatives and part of the Senate (the House of Representatives and the Senate form the US Congress) are up for re-election.
The outcome of these elections will decide the fiscal and budgetary policy space of the Biden administration, with a strong impact on the equity market and a knock-on effect on crypto-currencies.
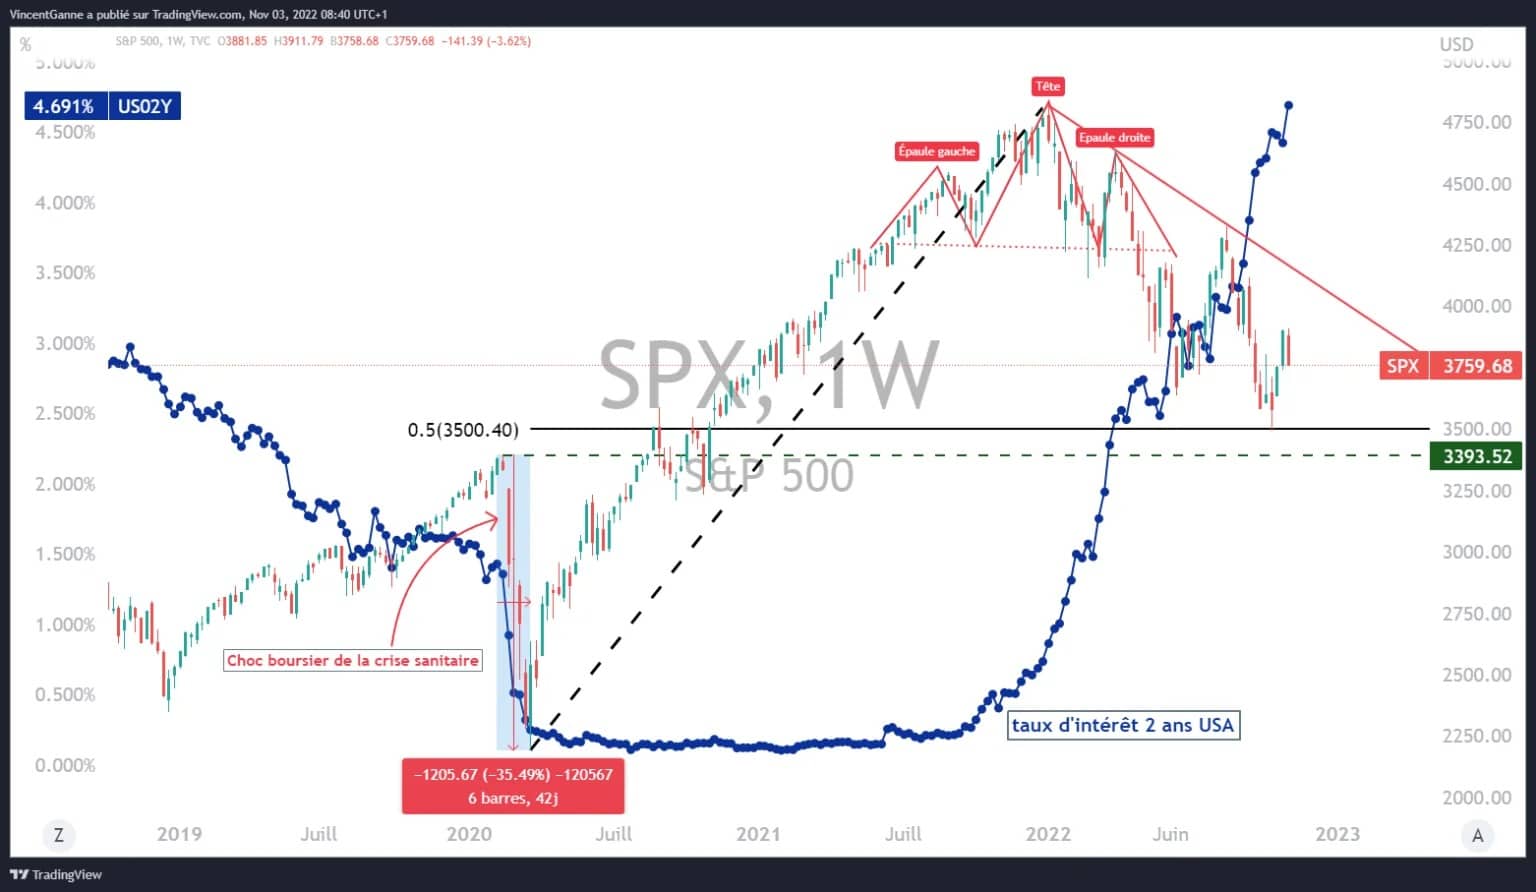
Weekly evolution of the S&P500 index and the US 2-year bond rate (in blue)
Fall 2018 VS Spring 2019: what is the current market technical pattern?
Let’s get back to technical considerations for Bitcoin. The debate of the moment is between the advocates of the Fall 2018 (market stall from $6,000 to $3,000 in November 2018) and those who advocate the Spring 2019 market pattern (chartist bullish reversal setup of March/April 2019); the commonality between these two periods was the volatility crush we are currently targeting on BTC.
In my last video, I detailed the technical arguments of both sides, with my belief still being that the market choice is for later this November. Tuesday 8 November, in addition to being the day of the US mid-term elections, is also the day-to-day anniversary of bitcoin’s all-time record daily closing price, which was close to $70,000 at the time.
October has just ended, so we have another monthly technical close and the MACD line histogram tips the scales in favour of the bullish scenario in the first half of 2019; but that is just one indicator among many.
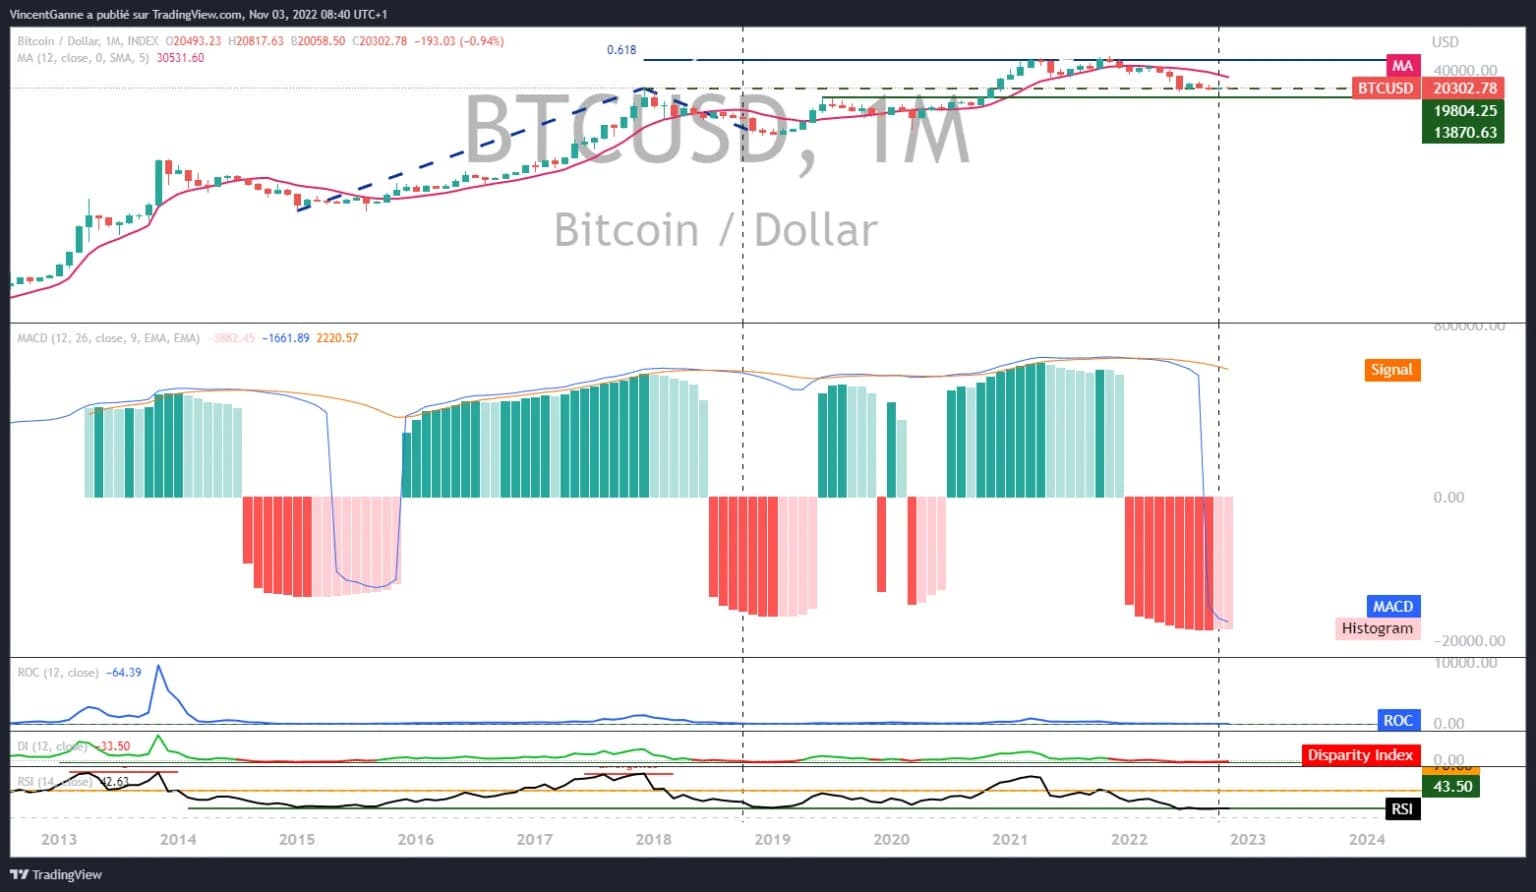
Bitcoin price (monthly) with a zoom on the MACD technical indicator over this same long time horizon