
Bitcoin (BTC) and Ether (ETH) prices have been rejected on their main resistances, and they have corrected their last bullish moves. Will the market continue its decline in a difficult economic environment, or will it bounce back to the upside?
Bitcoin (BTC) Technical Analysis
Last weeks we were talking about a retracement move that would take place after a bullish bounce. I’m talking about the movement of the Bitcoin (BTC) price up in early February to $45,500, and its retracement in late February to $34,000. Since then, the price has returned once again to this resistance point at $45,000 – $46,000 before being rejected once again.
What to expect from now on
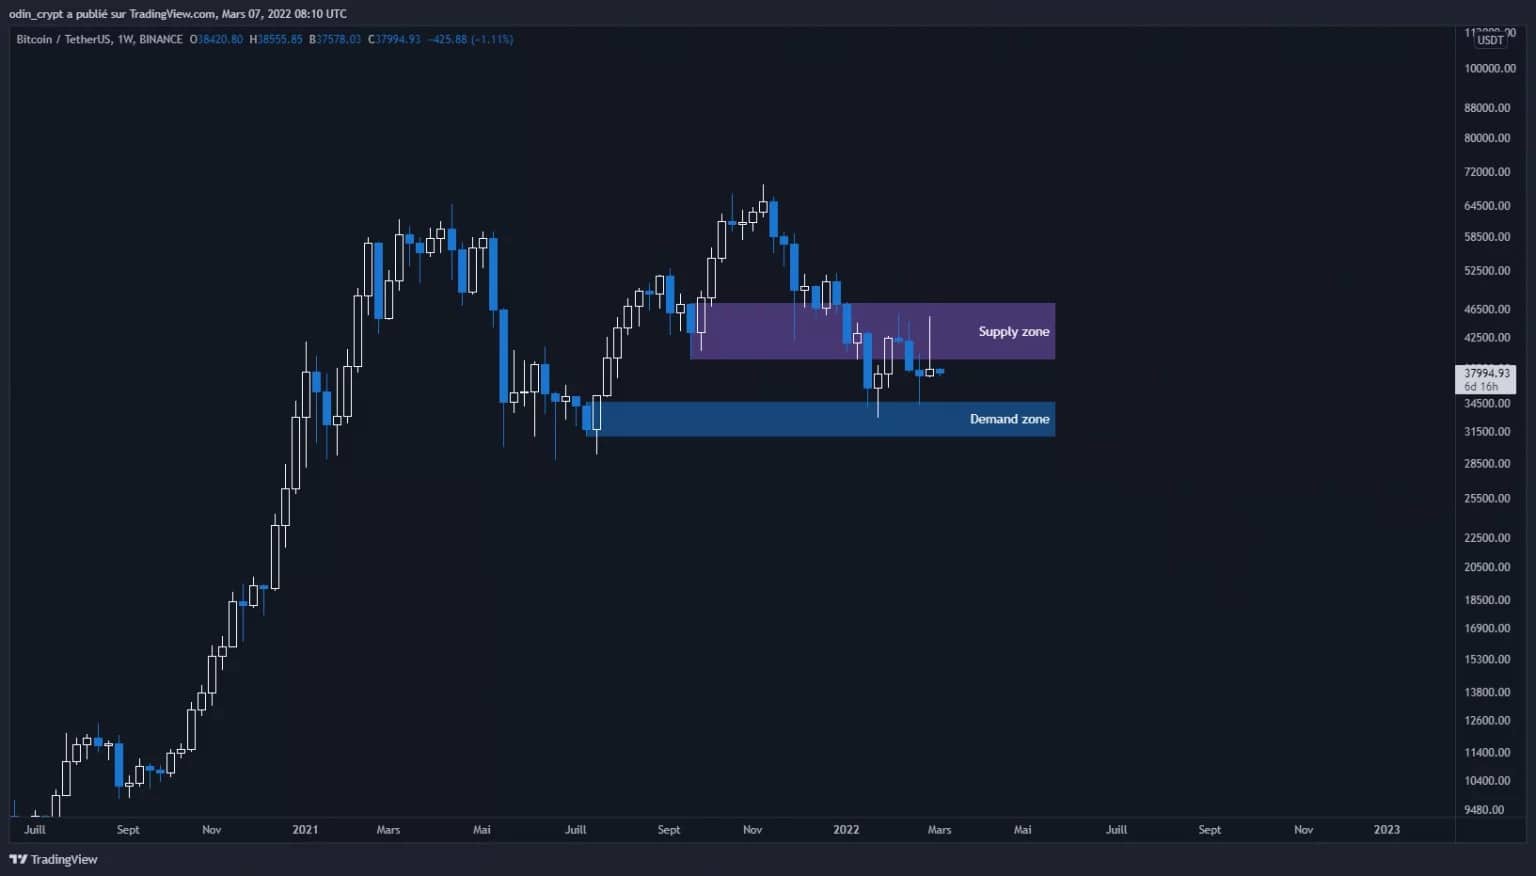
Let’s take the weekly view as always to start our analysis. Bitcoin is currently between 2 important zones:
- The supply zone (resistance/sale) at $39,500 – $47,000;
- The demand zone (support/buy) at $31,000 – $34,500.
Price is in a neutral phase where it seeks to create liquidity. Indeed, the price cannot perpetually go up / down without generating buying or selling. In general, it will be accepted that prices will be manipulated in the opposite direction to the desired movement.
From this observation, we can establish a hypothesis that the price will be pushed down one last time before it actually resumes the upward path.
Bitcoin (BTC) analysis in 1W
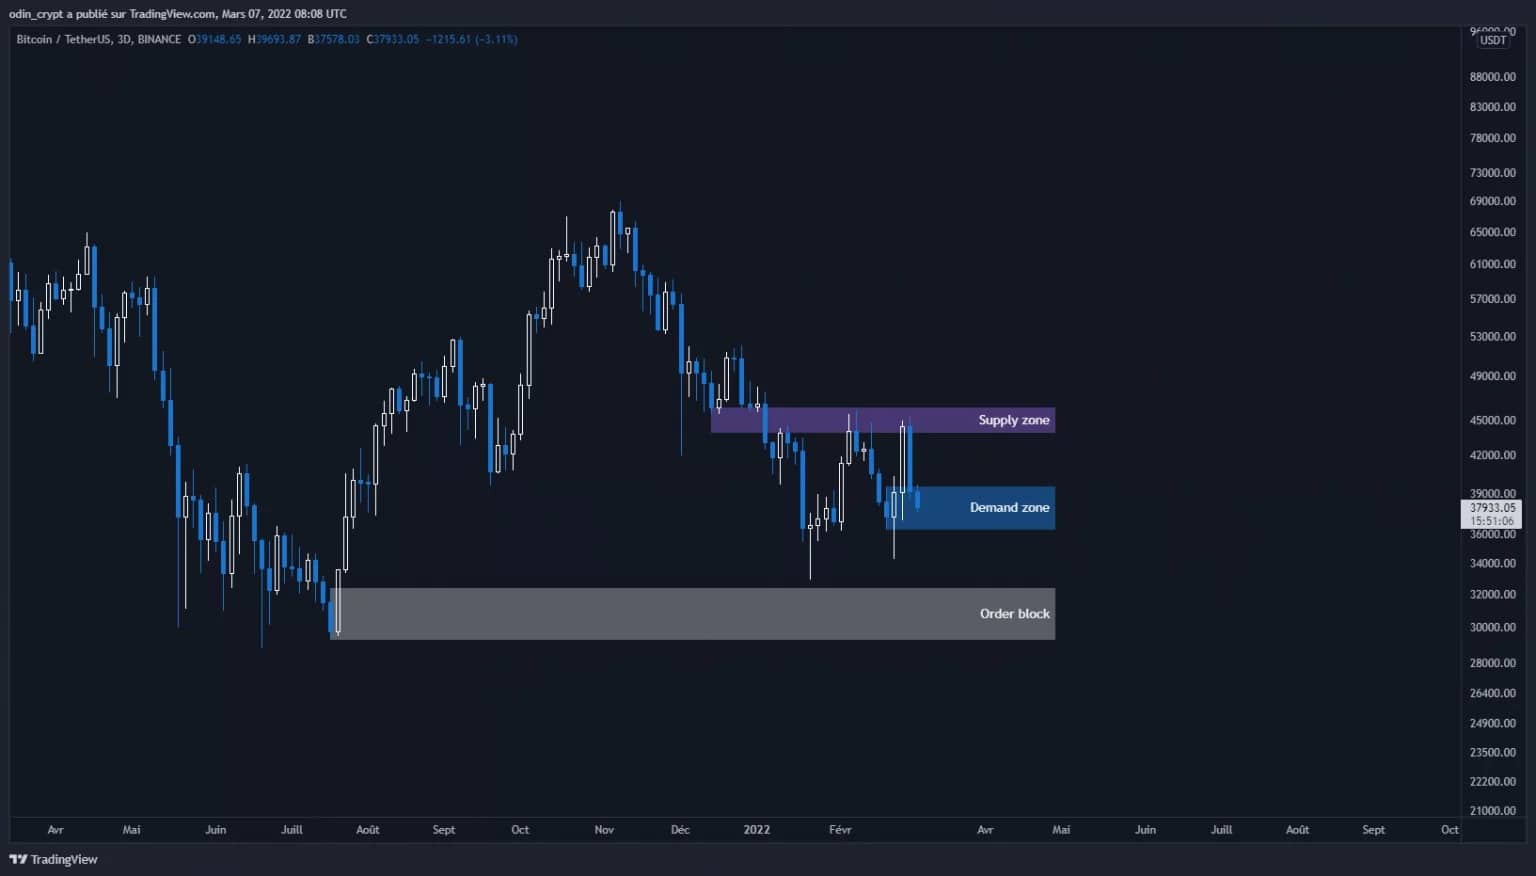
To clarify this hypothesis, let’s look at the daily (3D) view. Here the price gives us more information to refine this analysis. We notice this:
- The $44,000 – $46,000 supply area has been tested several times;
- A demand zone was created at $36,500 – $39,500;
- The order block area remains at $29,300 – $32,500.
As long as the price holds the demand zone, the price will have a strong chance of resuming the upward path. The target for this upward recovery would initially be the $49,000 – $51,000 area.
If this zone is lost, the order block zone will serve as the last bullish point. A loss of the latter will be a sign of a deeper market reversal
Bitcoin (BTC) 3D analysis
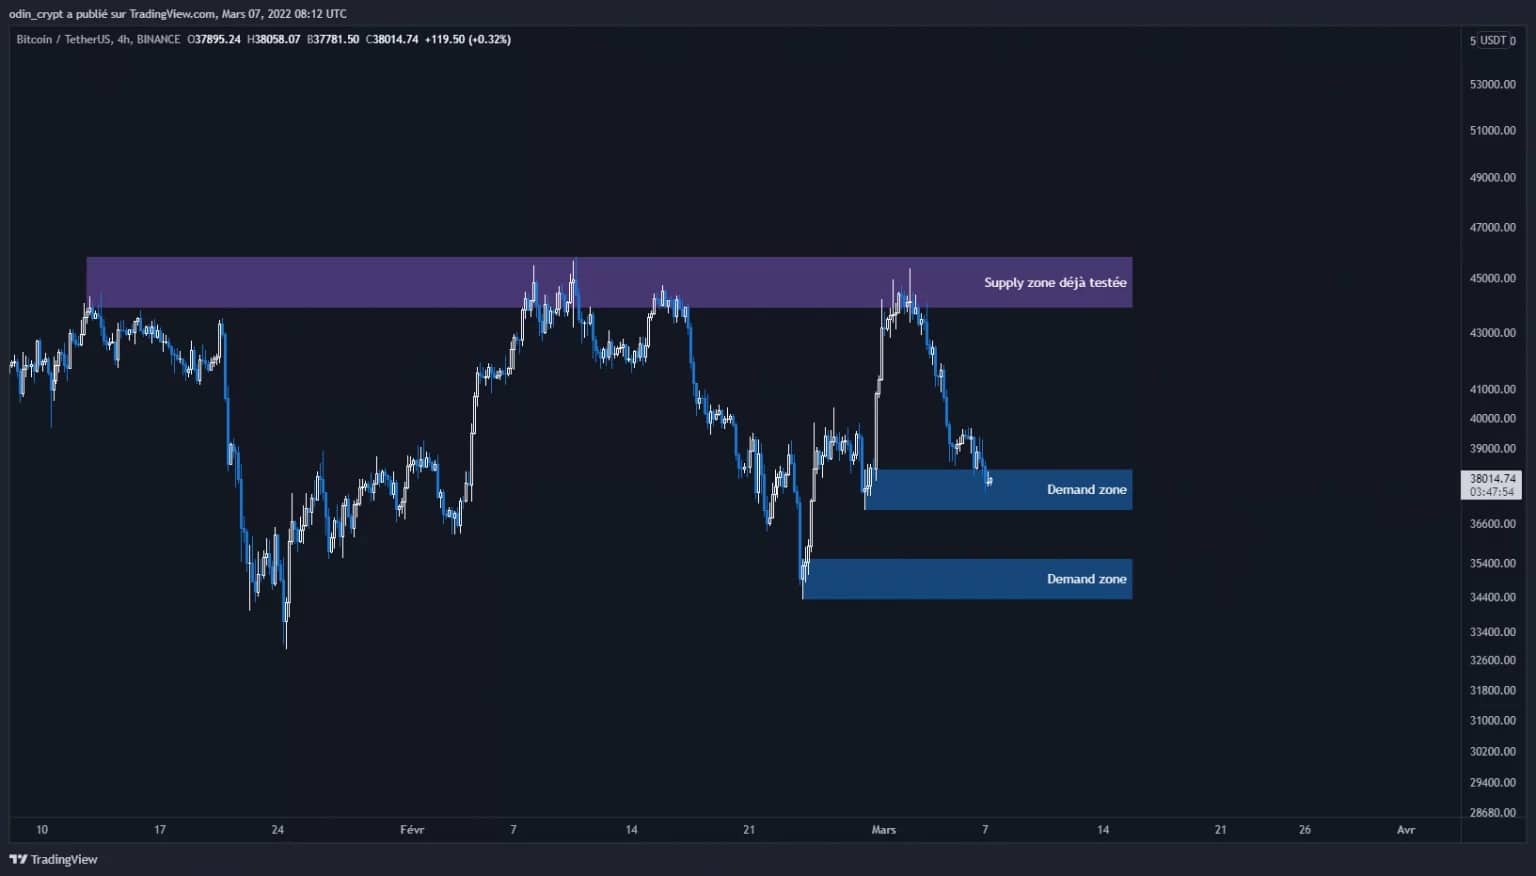
Let’s zoom in on the 4 o’clock view a bit more to clarify. The price has taken on a bullish structure on this time unit. This is a first encouraging sign, despite the large amplitudes of the movements.
I identify several interesting areas to invest in:
- Two areas of demand:
- The $37,000 – $38,000;
- $34,300 – $35,500;
- The $43,000 – $46,000 supply area already mentioned.
I think it’s appropriate to take long positions on the demand zones with a protective exit order below $36,500. This will allow us to play the potential move to $50,000 and protect us in case of a short manipulation.
Bitcoin (BTC) analysis in 4H
Ether (ETH) technical analysis
On the Ether (ETH) price side, the situation is much the same as for Bitcoin (BTC) as volumes are turned towards the latter.
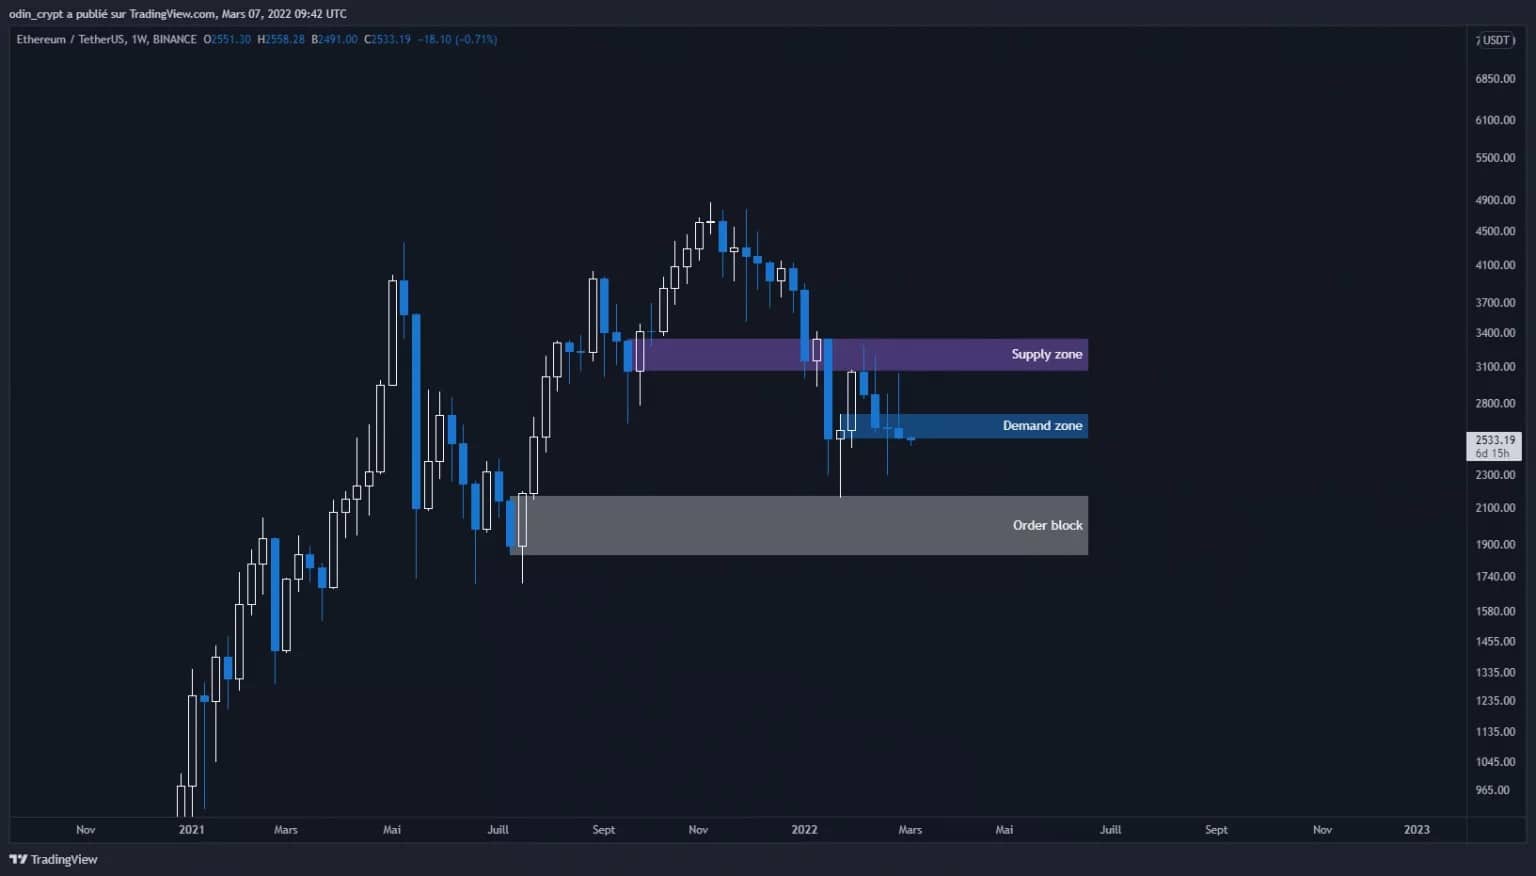
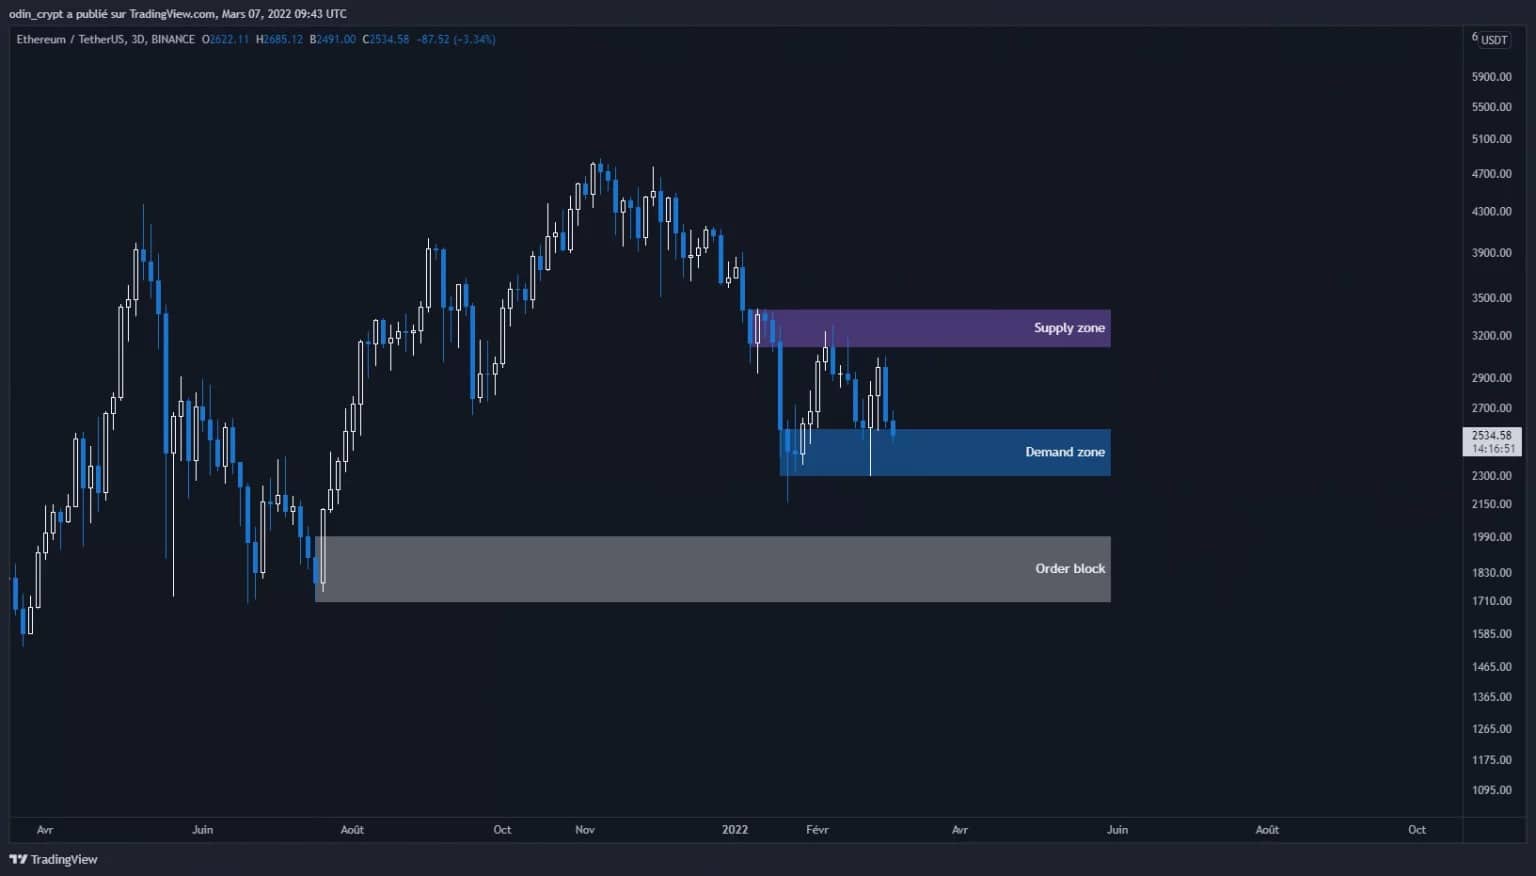
On the weekly view, the price is also stuck between two zones:
- The $3,000 – $3,300 supply zone;
- The demand zone at $2,500 – $2,700.
There is, again, an order block zone at $1,800 – $2,100 which has been tested and could act as a liquidity zone.
Ether (ETH) analysis in 1W
On the daily view, Ether (ETH) confirms this pattern with almost similar areas. The price will need to hold the $2,300 – $2,500 area to avoid continuing its fall towards the previously identified order block area.
Ether (ETH) 3D analysis
On the 4h view, the price remains in a bearish technical setup, and the last buy point before a bearish continuation is at $2,300 – $2,400. A reaction to the contact of this zone is absolutely necessary, otherwise it will continue its fall until the next macro zone. A recovery of $3,000 would be a sign of a bullish recovery to $3,400 in the first instance.
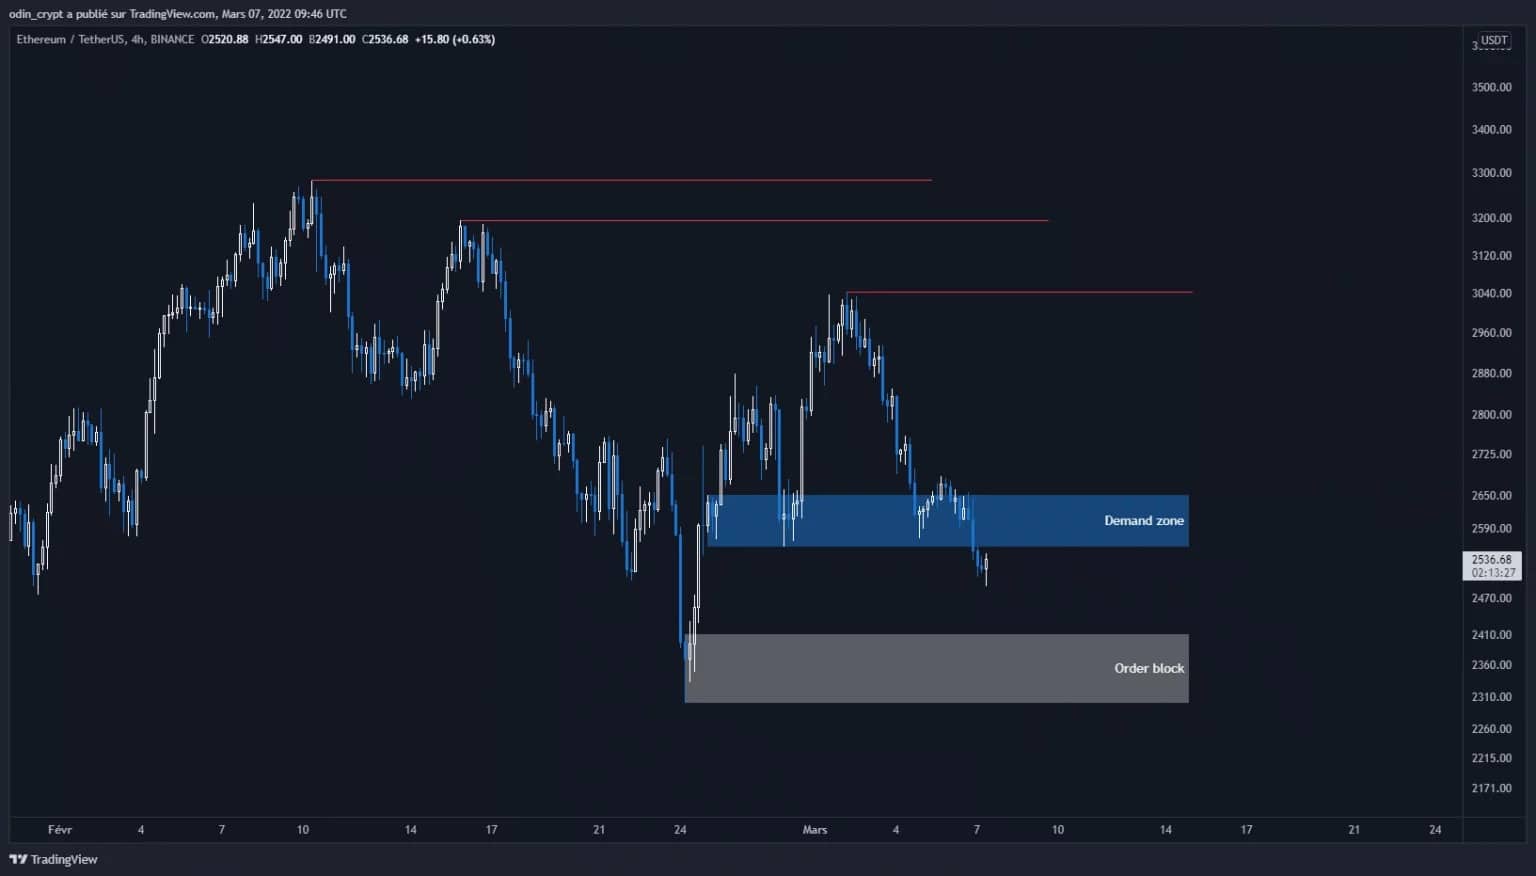
Ether (ETH) analysis in 4H
Technical analysis of Axie Infinity (AXS)
For this week’s analysis, I have chosen to return to Axie Infinity (AXS). I will focus on its analysis in 3 days to give you the keys to invest correctly on this token. From what we can observe at first sight, it is the very bullish structure of the latter.
The AXS price has made many impulsive moves upwards without ever retesting all its points. Since July 2021, the price has slowed down to begin a gradual distribution phase and the price began a slight decline in December. Since then, the price has been slowly slipping back to its demand zone at $35 – $44.
I also see a strong zone of untested interest at $14 – $20 that would allow the price to recover in strength. There are however 2 such areas further down, one at $10 and corresponding to an old ATH, and the other $3 – $5 corresponding to the beginning of the bullish move.
For now, what seems most likely to me is a retracement into the demand zone and in case of a loss it is the scenario of a retracement to $14 – $20.
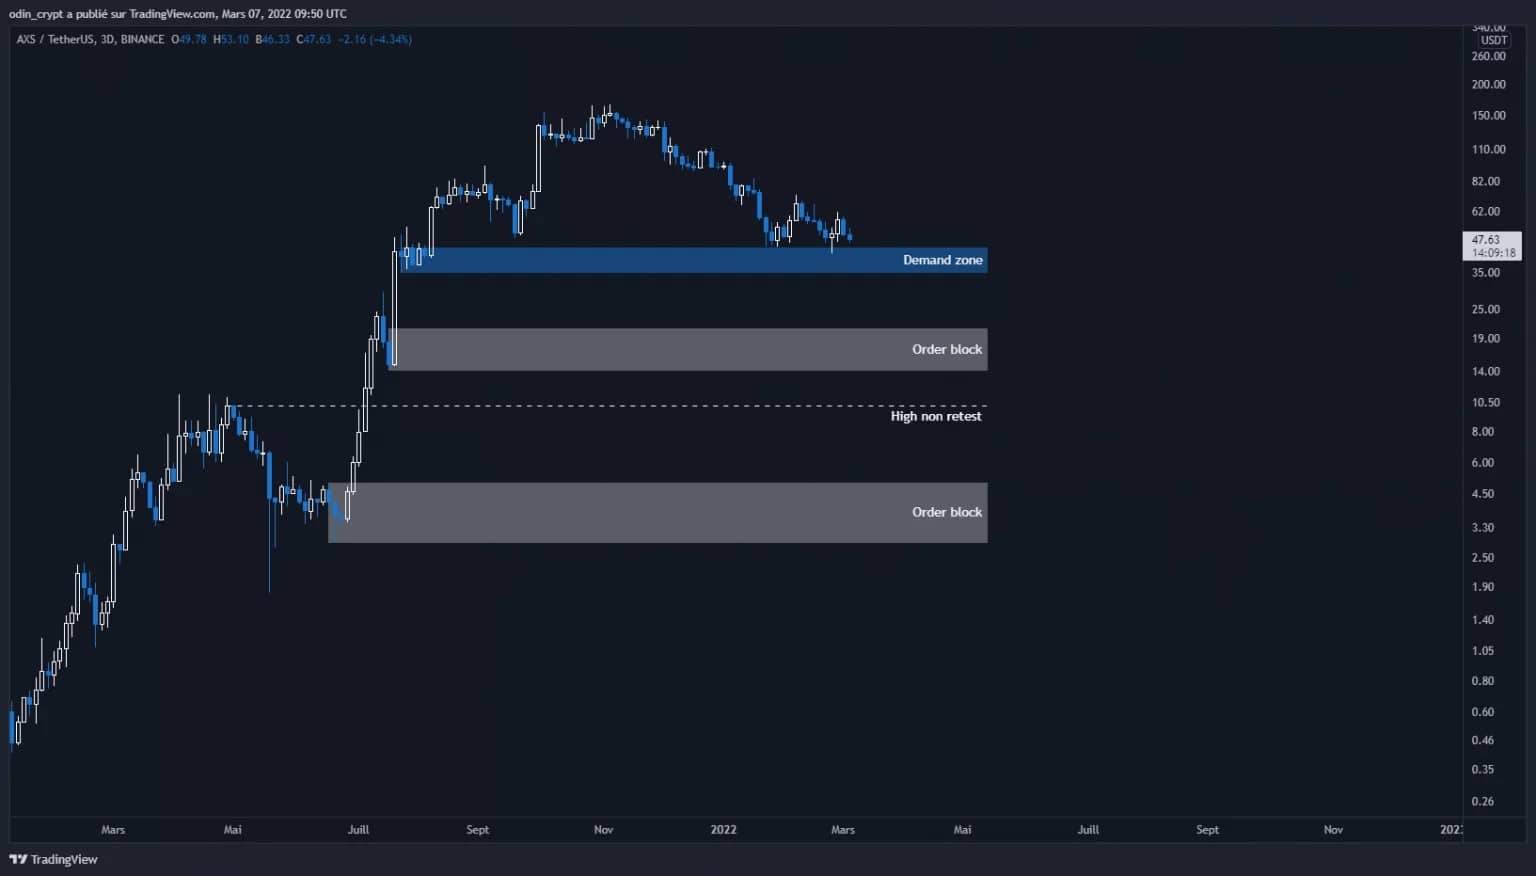
Axie Infinity (AXS) analysis in 3D
Conclusion
Bitcoin is trying to re-start its uptrend despite rejections at its $46,000 resistance, and Ether is struggling. It remains correlated to Bitcoin’s movement with a slight lag. So Bitcoin will need to bounce off one of the local zones and break above $46,000 to have any hope of seeing a move up to $50,000.
The AXS token, on the other hand, looks like it will correct on its zones of interest. This hypothesis will only be valid if the price closes below $35. In the meantime, the AXS token is in a buy zone and a medium-term strategy is possible.
Whatever happens, there is no need to take positions in a hurry, you can build them little by little on the interest zones.
That was cryptOdin to serve you.