
Bitcoin (BTC) and Ether (ETH) prices rebounded this weekend, creating a powerful move. Is the market starting a bullish turnaround, or is this a trap before a bigger drop?
Technical analysis of Bitcoin (BTC)
Last week we talked about the importance of the monthly close. The Bitcoin (BTC) price has since closed above the $35,000 “must not lose” point. For now, the macro trend remains intact and the theory of a range between $30,000 and $60,000 still holds.
What to look for now and how to position yourself in the short term
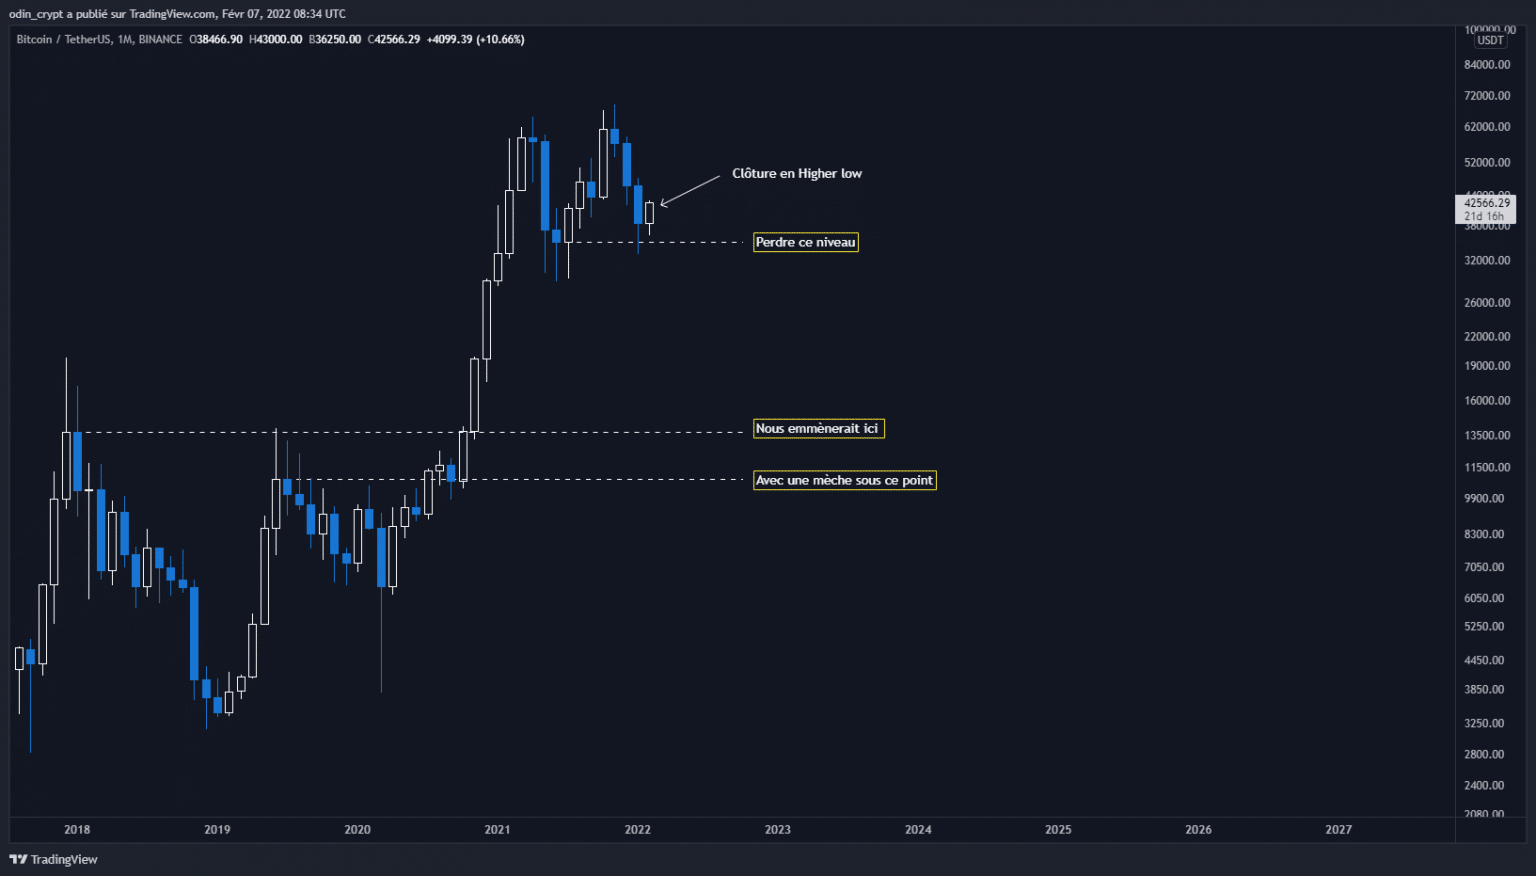
Bitcoin (BTC) analysis in 1M
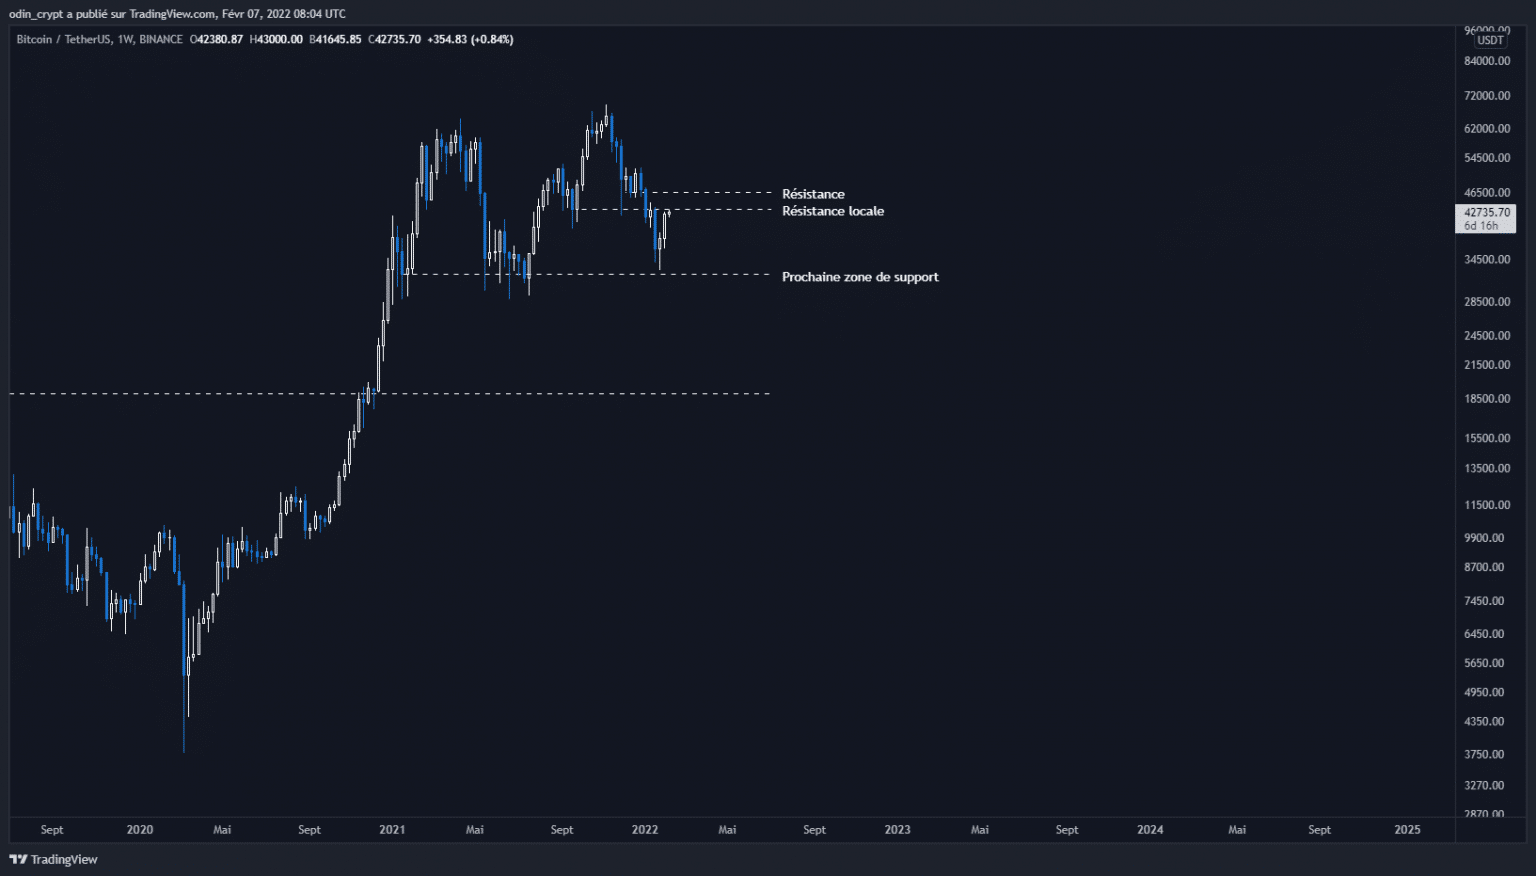
We will focus on the lower time units starting with the weekly view.
Our observations from the past few weeks are still helpful in understanding that Bitcoin (BTC) is still in a downtrend. The expected technical rebound is underway, and the price is sitting on the identified resistances. A rejection on its resistances would mark a continuation of the downtrend to the support point at $32,200.
Aggressive resistance is at $43,000, and the next (most important) resistance is at $46,000.
Bitcoin (BTC) analysis in 1W3
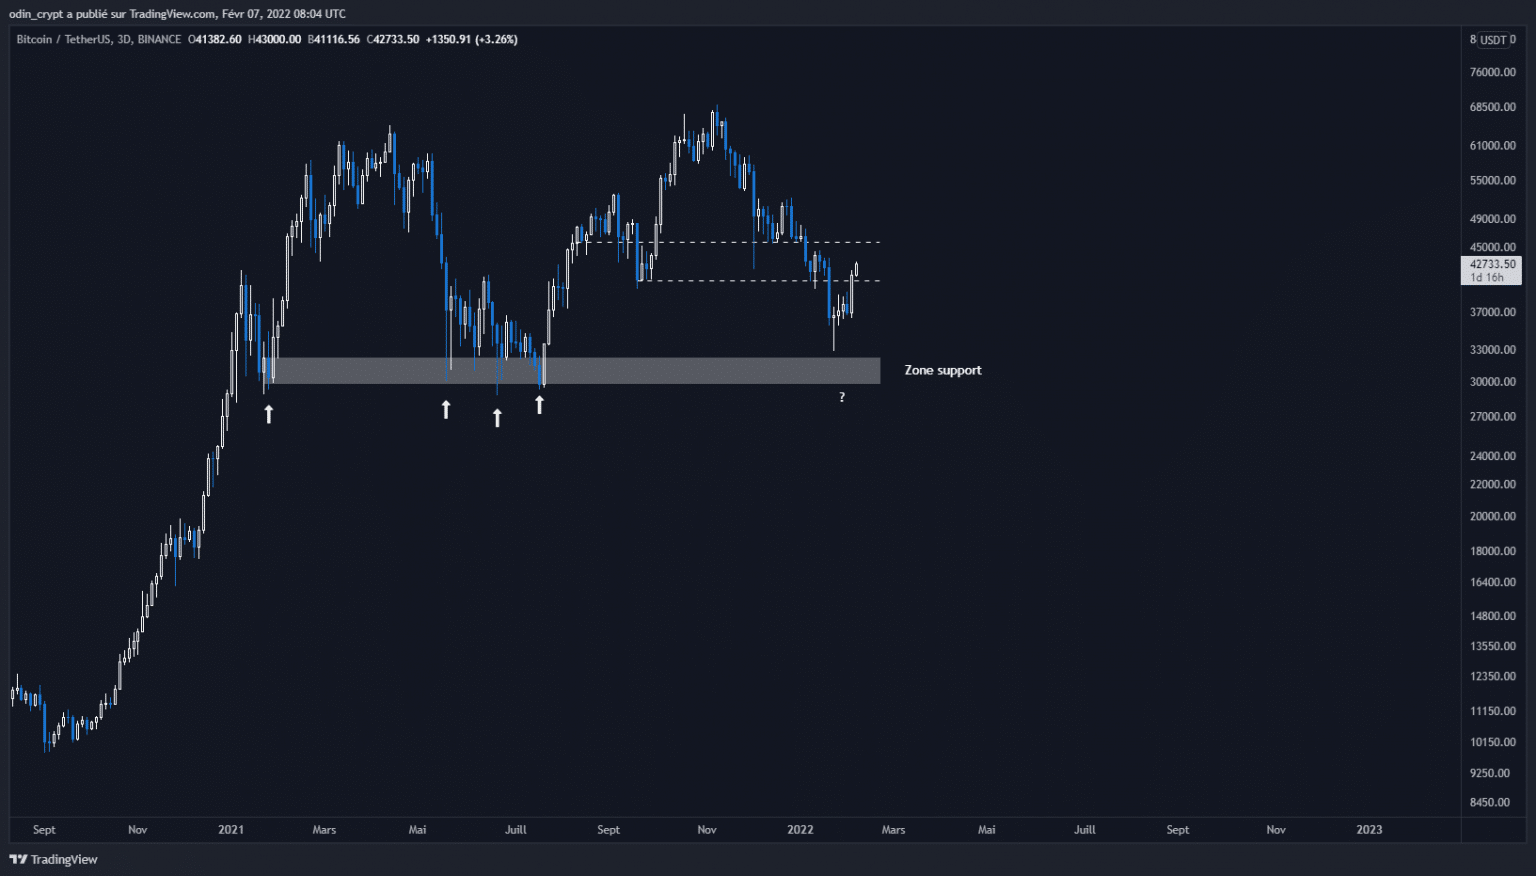
The grouping of daily views into 3 days gives us a clearer picture of this trend. The first resistance at $39,000 – $40,000 has been broken, allowing the price to advance to the next area.
The $46,000 is an area of strong selling interest, as it represents the macro pivot zone that had allowed the price to come in for a new high in October 2021. This zone had also held the price between December and January. Its breach led to an acceleration of the price downwards.
It now appears clearer that the price will have to recover this zone in order to resume the upward path. If this point is broken to the upside and retested, we will see a new bullish move to test the former ATH.
Bitcoin (BTC) 3D analysis
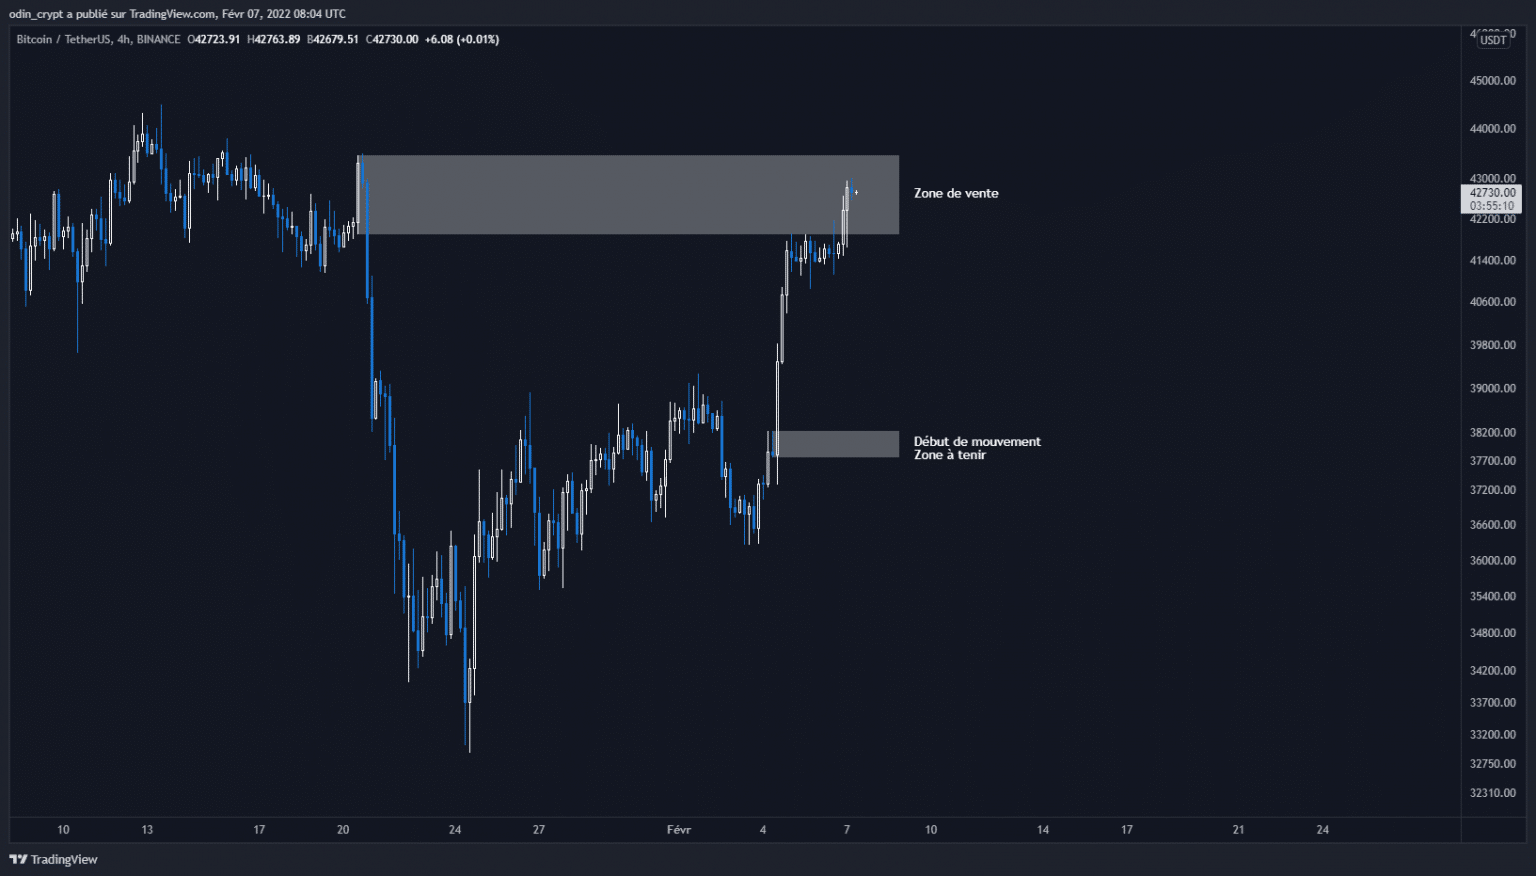
In the very short term, the 4 hour view gives us good indications. The price is back in its bearish order block area. This means that the reaction on this point will be crucial:
- If the price breaks above this point, it will mean that the big portfolios are no longer protecting this area, and the next resistance will be tested;
- If the price is rejected, the next bearish move will be back to the $37,700 – $38,200 area (start of the move).
There are therefore 2 scenarios to play with in the short term, the technique being to wait for one of the 2 scenarios to be validated.
Bitcoin (BTC) analysis in 4H
Ether (ETH) technical analysis
The monthly close was also very important for the price of Ether (ETH). This last one was made as for the Bitcoin (BTC), namely above its zone (the $ 2,200 here). The macro trend is saved for the moment, but there are still many areas of resistance before the uptrend resumes.
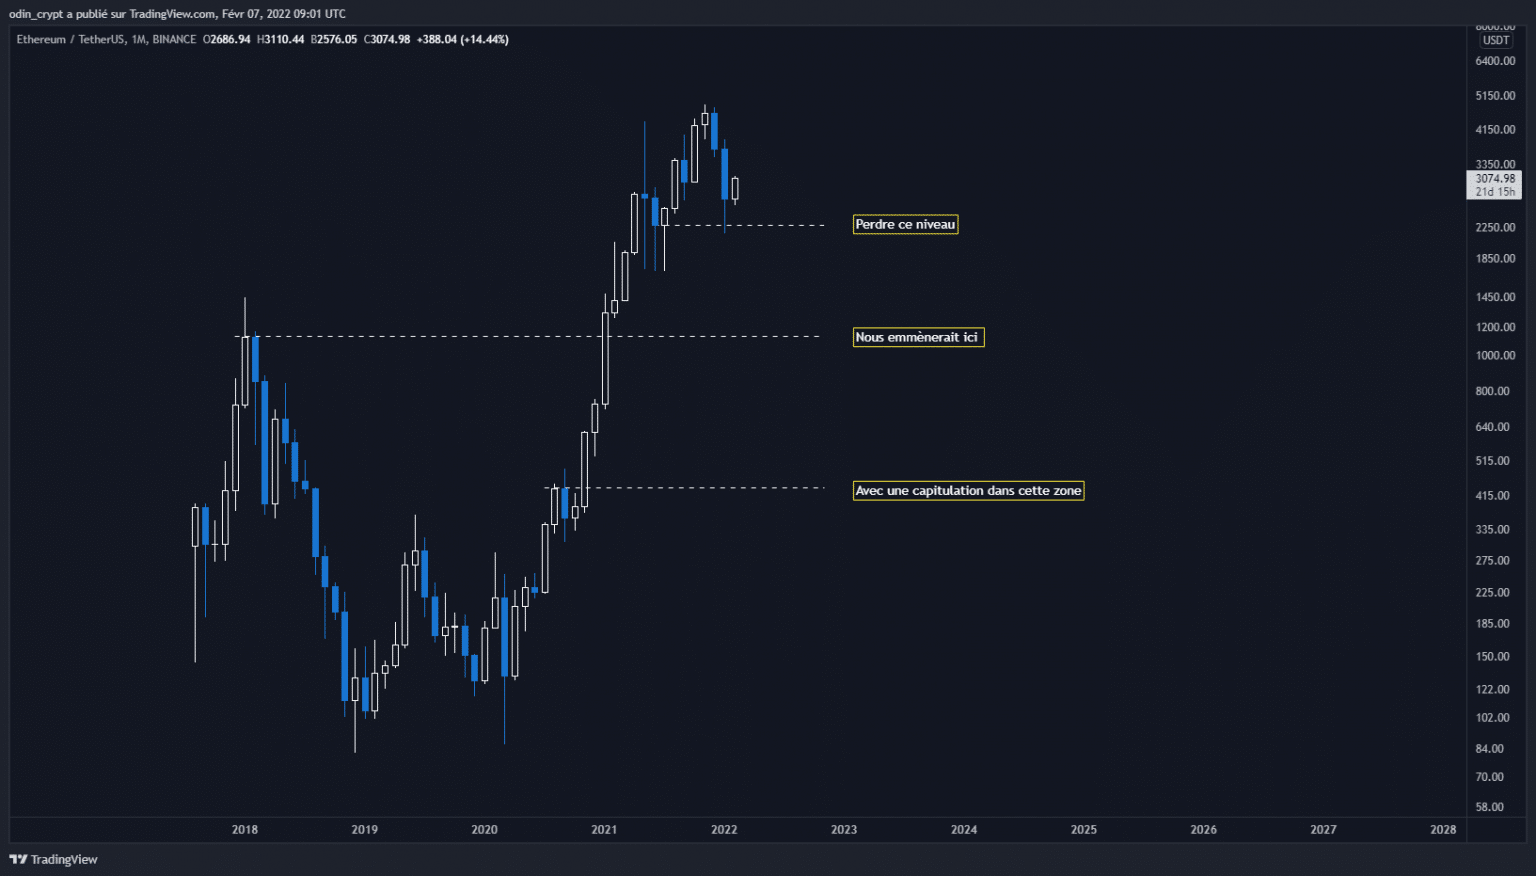
Ether (ETH) analysis in 1M
The weekly view shows us these areas well. The price remains well within the downtrend, and the price has bounced like its counterpart towards its major resistance point. Indeed, we see that the $3,000 had served as support several times before being broken to the downside. Now, this area should be retaken in order to re-start a deeper uptrend.
The $2,000 support level remains valid and could allow for a reversal if revisited.
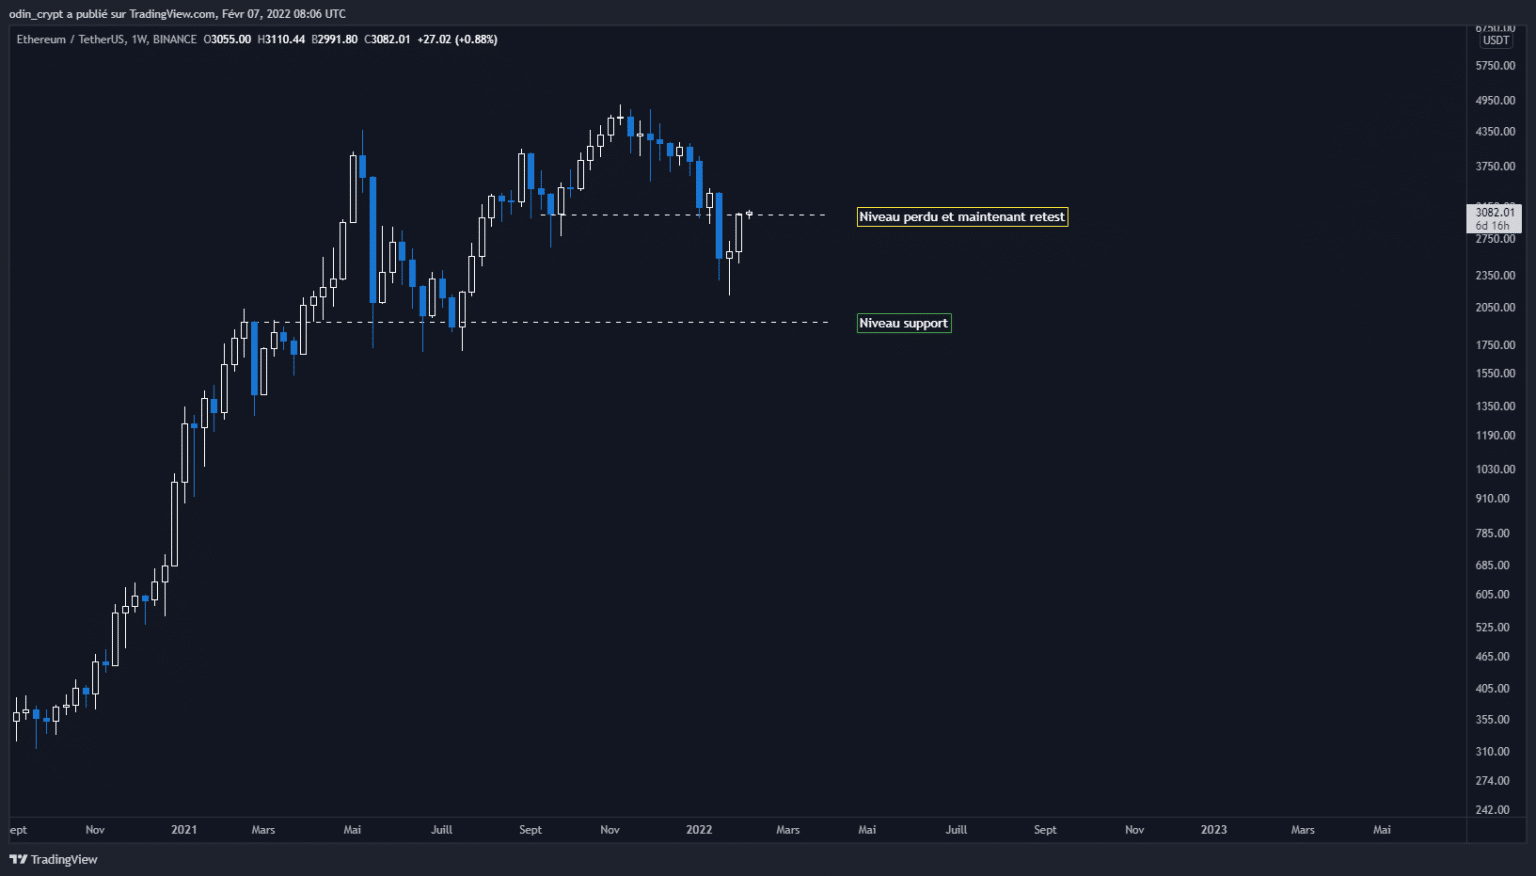
Ether (ETH) analysis in 1W
The daily view clarifies this situation. Indeed, the price is currently on the aggressive short zone corresponding to the last lost low. The next big step is at $3200 – $3300 and will serve as a pivot zone. Regaining it would allow us to resume an uptrend on this time unit to reach $3,800.
If this fails, the area to hold in this local bullish view is at $2500 – $2700. Losing it would make us visit the big support of $2,000.
It will be necessary to remain attentive on the evolution of the price, and not to rush to buy on the selling zones.
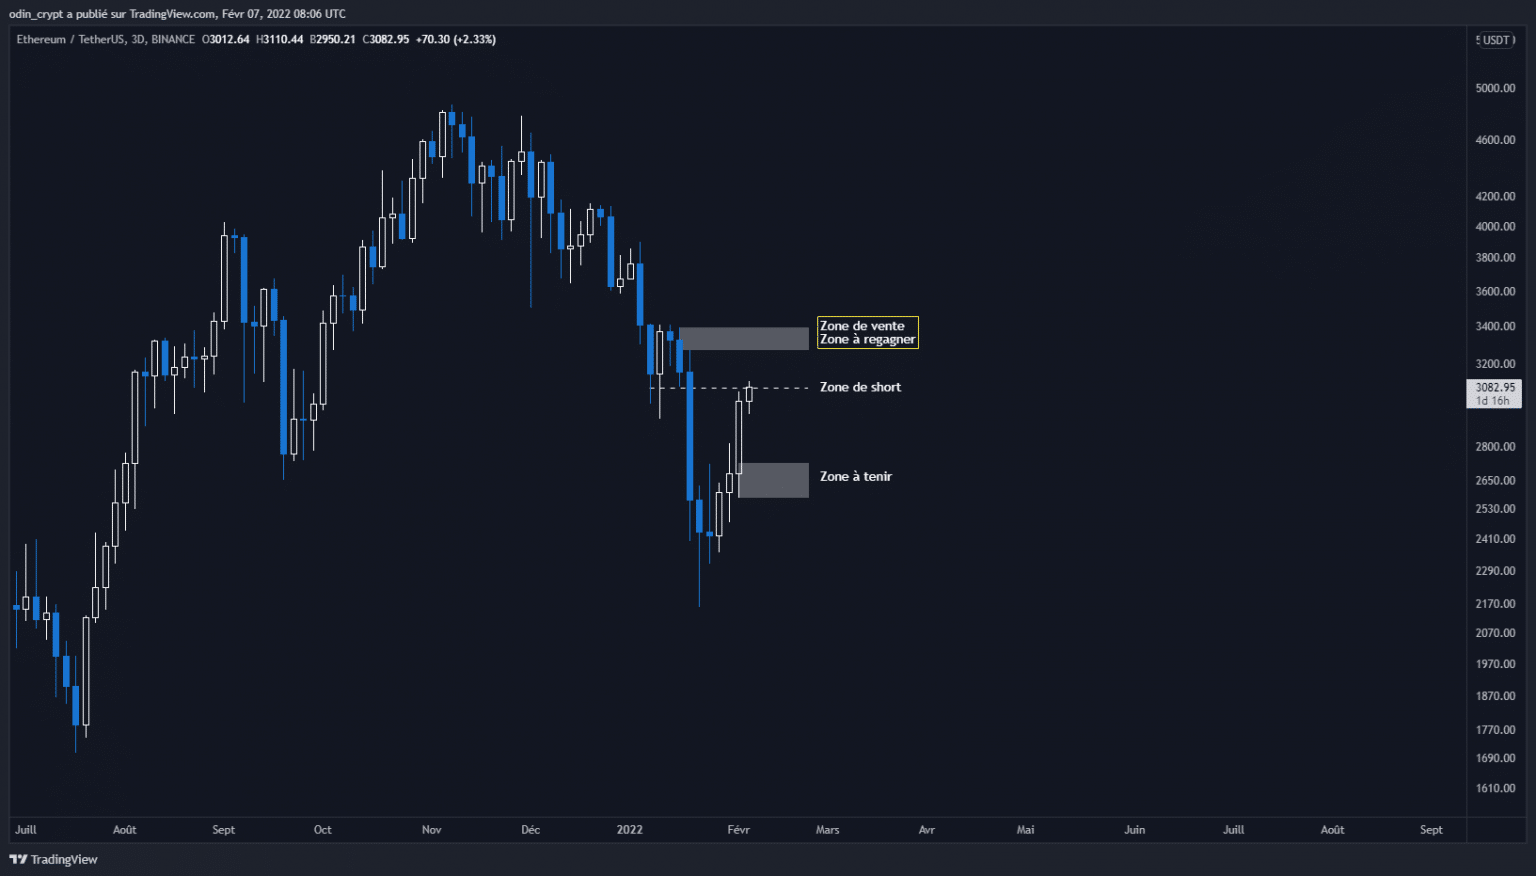
Ether (ETH) analysis in 4H
Solana Technical Analysis (SOL)
We will end this article with a price analysis of the Solana blockchain token SOL. The unit of time here will be the 3 day grouping. I had already made an analysis of the latter last week, so here is its evolution.
We can now see that the $123 area has been crossed on the downside. This validates the bearish scenario up to $55 which should serve as a buying zone. For now, the price is heading towards its last lost zone ($123) and I expect a rejection of the zone.
To re-start a real uptrend, the price will have to close above $152. In the meantime, there is no need to rush into the stock, and buy orders can already be placed on the $55 level.
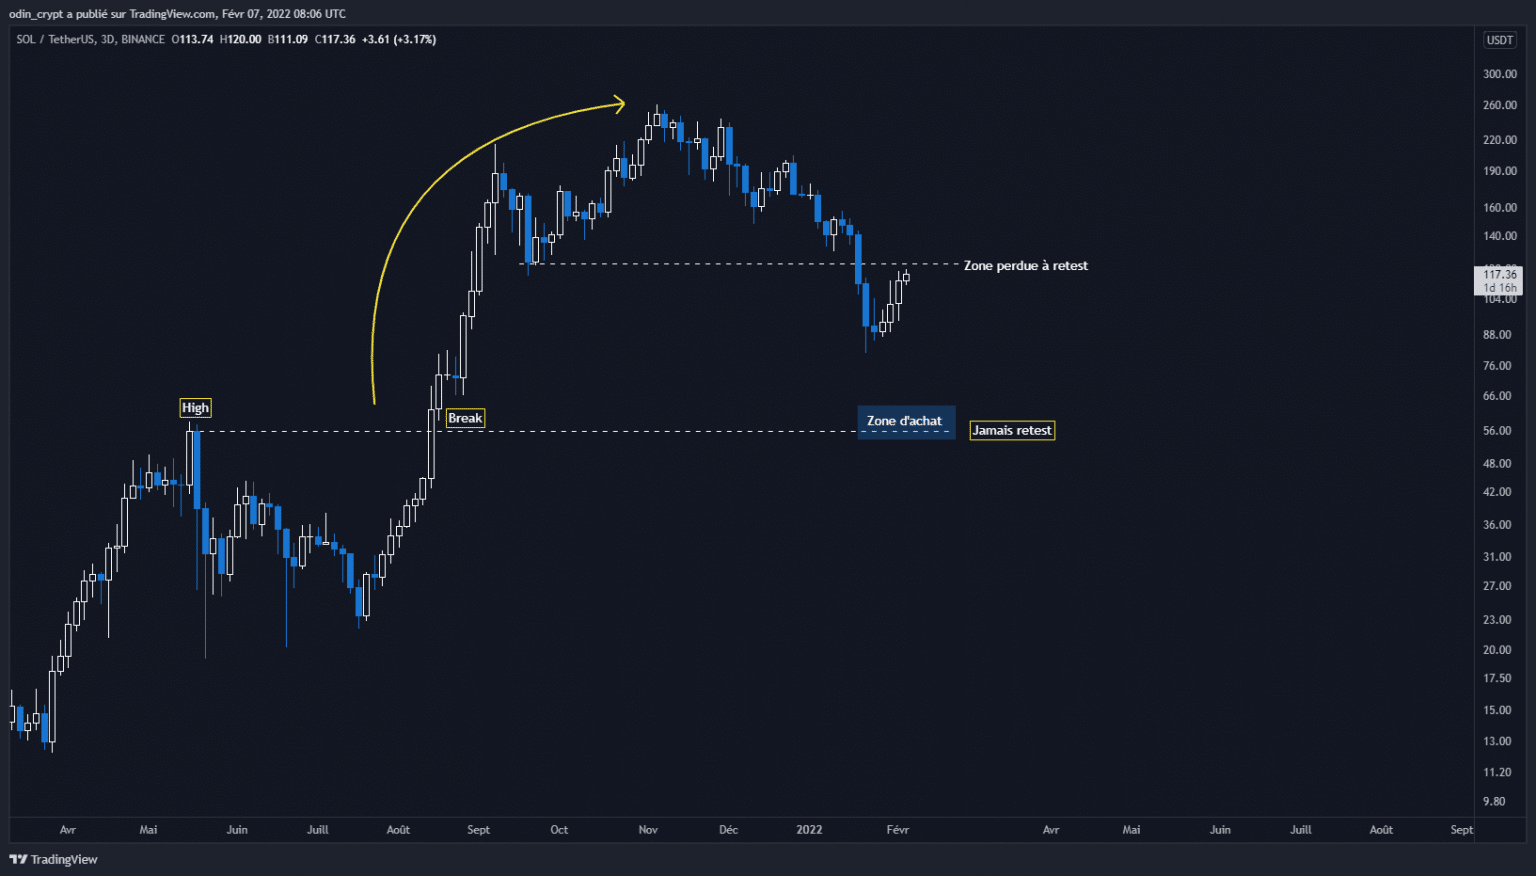
Solana (SOL) analysis in 3D
Conclusion
The monthly close is positive for Bitcoin (BTC) and Ether (ETH), but the price is still in a downtrend. Lost areas will need to be regained and held in order to break this medium-term downtrend.
For the time being, Bitcoin and Ether are on initial sell-offs and watching the future reaction remains our priority. We will still need to be patient to take a long term position and respect the trend. Interesting short term entry points are possible, but you will have to manage your risk well (1-2%).
On the Solana (SOL) side, the macro structure is perfectly bearish and will remain so as long as the $152 level is not recovered. A position against the market (short) is possible to play the movement until $ 55. This point will offer a nice buying position for the rest of the move.
In general, trust only the trend and make sure to limit your bias by strictly managing your risk.
That was cryptOdin to serve you.