
After several failed attempts below psychological resistances, Bitcoin (BTC) and Ether (ETH) are heading back down and triggering new bearish targets. Here are the various levels to watch in the coming days
Bitcoin (BTC) goes into correction
Since our last analysis, the price of bitcoin (BTC) has still not managed to break through its psychological resistance at $30,000. Worse still, after a massive M-shaped rejection on the Kijun Daily, BTC is only going back down, following the correction we mentioned towards $25,000.
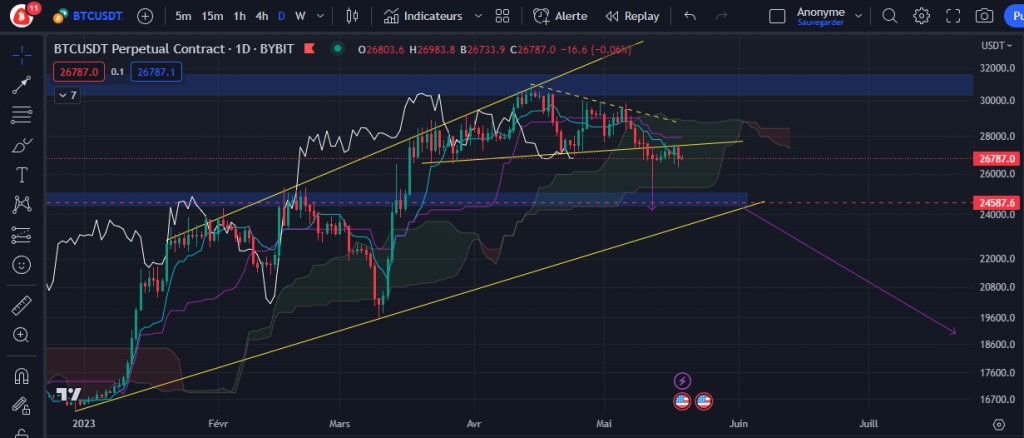
Figure 1 – Bitcoin Daily price chart
It has to be said that the price has only been rising since the start of the year, so it’s quite logical that it should end up correcting before potentially picking up again. After touching the upper end of its upward broadening towards $30,000 for the umpteenth time, Bitcoin seems to be heading for its next support point at $25,000/$24,500. This is a level that has stalled the price several times in the past as resistance, and which should now allow a rebound in the event of a retest.
There is no immediate need to worry about this correction, as long as Bitcoin remains above $24,500. Breaking below this support, however, would mean breaking through the broadening and the cloud at the bottom, and thus a bearish target below $20,000.
The psychological resistance of $30,000 will therefore have to be broken again in the next few days or weeks, and to do that there will be resistance on the way, with the daily Kijun, Tenkan and cloud to be regained as support.
A target of $24,590
We spotted it in our previous analysis, the h4 triangle has finally been broken at the bottom. Now, we’ll need a big price reaction driven by volumes to avoid going after this target
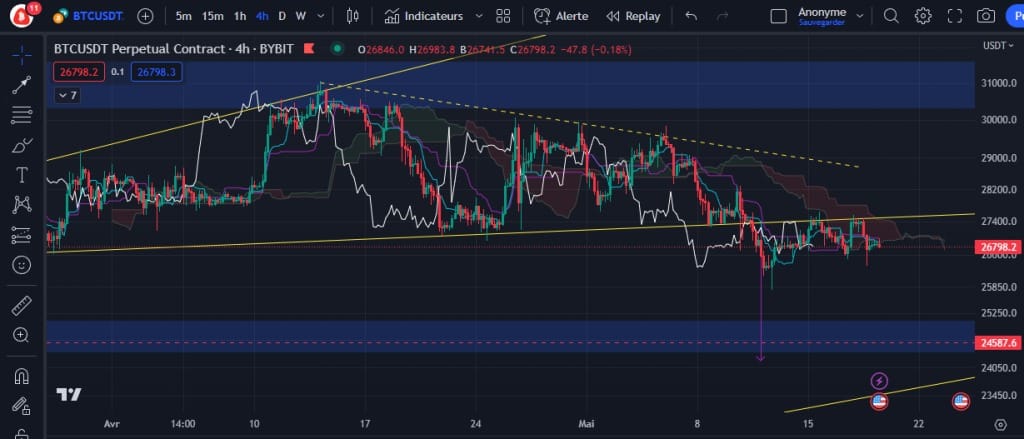
Figure 2 – Bitcoin price chart (h4)
Over the past few days, two pullbacks have been made below the bottom of the triangle and it is surgical, with the Chikou Span (white curve) confirming this major rejection of the price by the $27,500 area.
The target for breaking out of this triangle is $24,590, which confirms our scenario of a daily correction. It remains to be seen whether the market will be able to find the volume to prevent a return to this level, which seems increasingly inevitable.
Ether (ETH) under resistance
As with Bitcoin, the price of Ethereum’s cryptocurrency, Ether (ETH) is under multiple resistances characterised by the Kijun, the cloud and prices blocking the Chikou Span. And of course, the $2,000 area is acting as resistance more than ever.
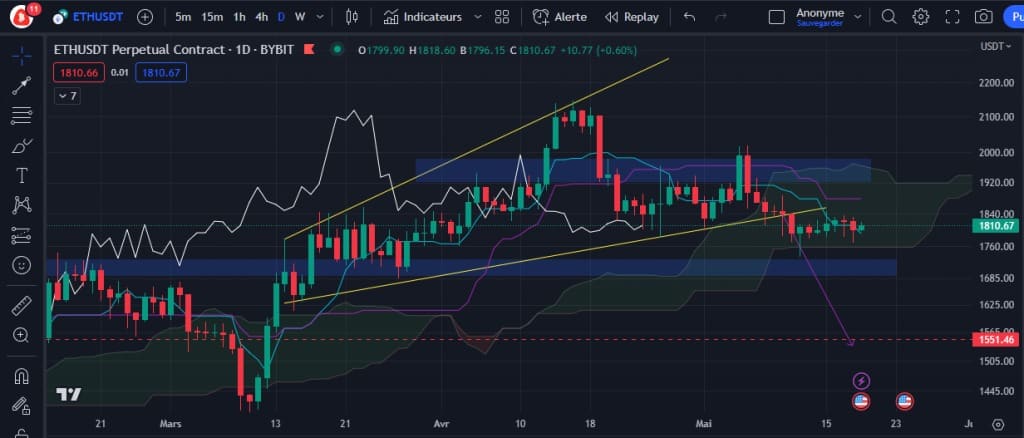
Figure 3 – Ether price chart (Daily)
After several major rejections of the $2,000 level, the price has finally broken through its daily uptrend at the bottom, which means that there is now a strong chance that it will go back for the next support zone at $1,550.
So will the price manage to break through these important levels? It will be essential to regain $2,000 in the next few days to invalidate our bearish target.
Conclusion of this technical analysis
As you can see, cryptocurrencies are in correction and have lost important supports that will have to be regained to invalidate the bearish targets triggered. For the time being, it seems more likely that prices will continue to fall until they reach the targets mentioned.
?
? Access our premium group with Vincent Ganne and our fundamental and on-chain analysis experts. They will provide you with exclusive daily information and analysis on the crypto market to optimise your knowledge.