
After this week’s rise in Bitcoin (BTC) and Ether (ETH), is a big move up finally in sight, or are we headed for another fall? Check out the different scenarios to watch out for.
BTC is still in a compression triangle
While it seemed to finally break out of a bearish continuation triangle last week, the BTC price had finally re-entered it, leaving the slightly larger triangle below. A new chance for buyers to perhaps manage to retest prices around the $30,000 mark?
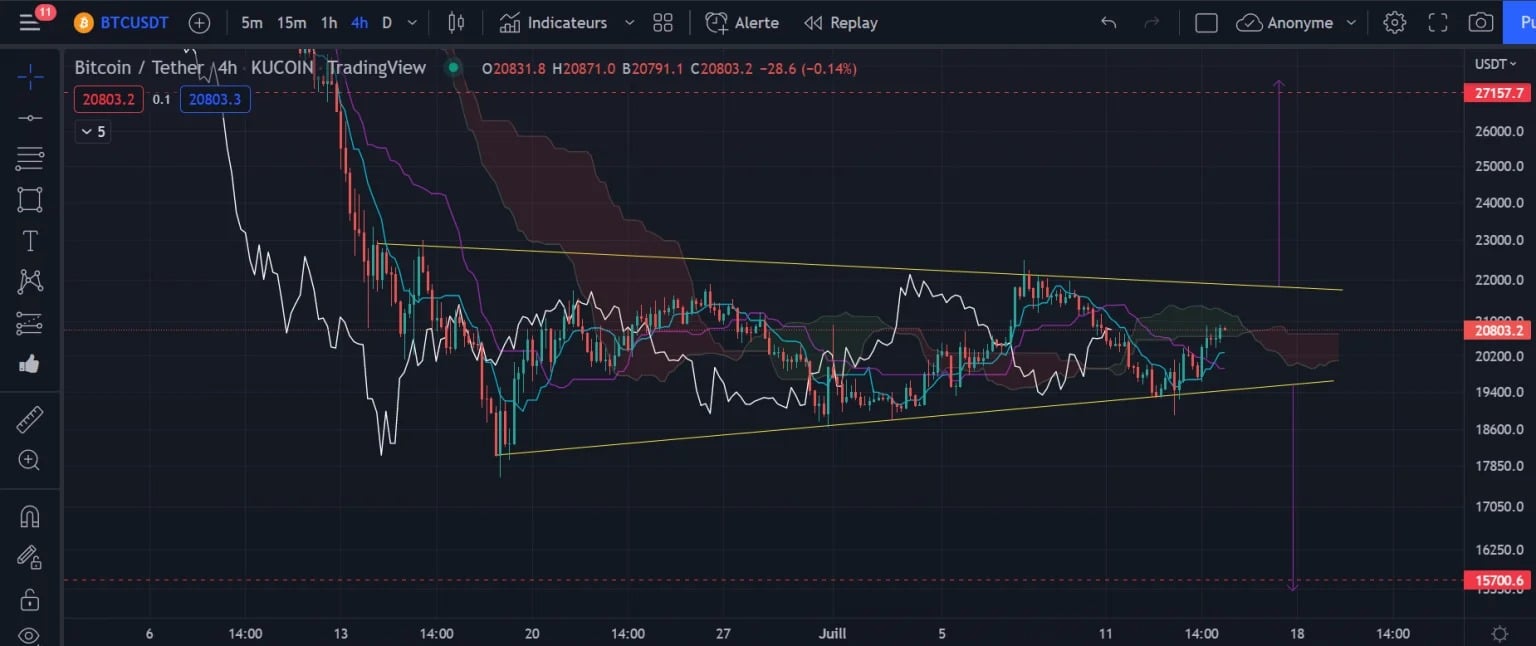
Figure 1: Bitcoin price chart h4
After bouncing off the bottom of the triangle, Bitcoin is back above $20,000 and looking for $21,000, but more importantly a possible return to the top of the triangle for a bullish breakout attempt. Although the momentum has shifted upwards in the last few days with Kijun and Tenkan h4 back on price support, it will still need to get back above the cloud in order to be able to consider a safe breakout. This would also correspond to a return of the price above the Tenkan Daily which is still acting as resistance.
If the price moves back above $21,500, BTC could finally have enough support to break this triangle from the top towards $27,150 or so (the height of the triangle at its entry carried over to its breakout point). However, as long as the price has not broken its high trendline, beware of rejection as we are still in a bearish continuation pattern, following a very strong downtrend. There is still more chance of a break down towards $15,700, especially since the h4 cloud and the Tenkan Daily are still acting as resistance.
Ether (ETH) is showing signs of a reversal
Like Bitcoin, Ethereum (ETH) finally managed to bounce off its $1,000 support, breaking the cloud from above and regaining the Tenkan and Kijun h4 in support. Are we going to break this triangle from the top
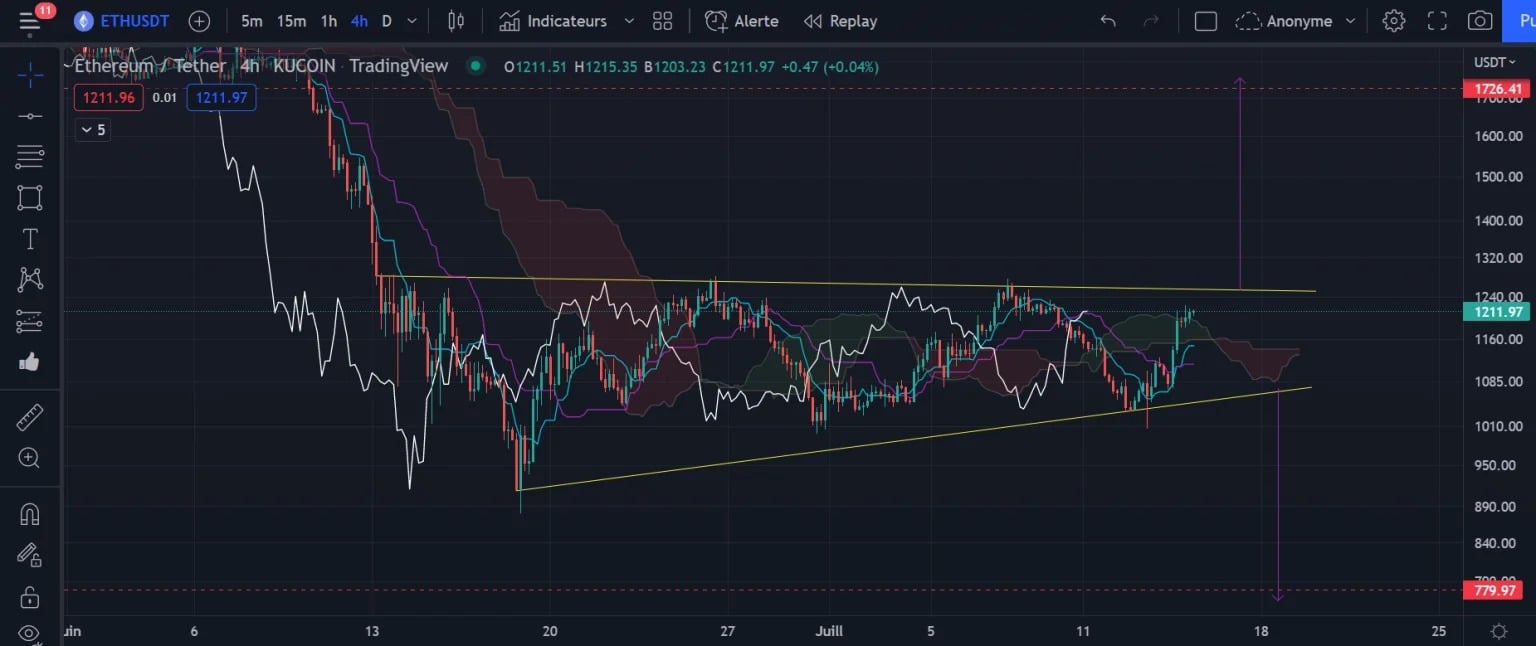
Figure 2: Ether price chart (h4)
With only the top of the triangle and the Chikou Span blocked by prices as h4 resistances, the bullish breakout could happen in the coming days. However, as long as we don’t close above the high trendline we will have to remain vigilant as the price could very well go through the cloud twist again (very weak support crossing which often attracts the price).
We will therefore wait to see if ETH manages to break its triangle upwards towards $1,726 (height of its triangle at its entry), or if the fall will finally continue towards $779. However, we remain in a bearish continuation triangle, so watch out
In conclusion
Bitcoin and Ethereum continue to move within h4 triangles. We will have to wait for their breakout to position ourselves in the direction of the breakout but beware, as this type of pattern is often a precursor to a bearish breakout.