
While Bitcoin was discovering its price just two weeks ago, it is now back at the $110,000 level. A decline that could ob860 million in inflows: Ethereum ETFs outperform Bitcoin ETFs for six consecutive days
In the wake of an ATH for ETH, Ethereum ETFs have outperformed Bitcoin ETFs for six consecutive days. Are such performances significant? We shed light on the competition between these two investment vehicles.
Are Ethereum ETFs gaining an advantage over Bitcoin ETFs?
On Tuesday, net inflows into US spot Ethereum (ETH) ETFs reached $455 million, while spot Bitcoin (BTC) ETFs only managed to achieve $88.2 million. This is the sixth consecutive trading day that ETH ETFs have outperformed (or underperformed less than) BTC ETFs.
Since this streak began on August 18, which was a market opening day, Ethereum ETFs have totaled $857.8 million in positive net inflows, while Bitcoin ETFs have seen $745.14 million in outflows.
However, the fact that Ethereum ETFs outperform their competitors is not anecdotal. Since their launch on July 23, 2024, this has happened 108 times, or more than 39% of the time.
However, there have only been four instances where Ethereum funds outperformed Bitcoin funds for six or more days, with the record currently standing at eight days, between February 18, 2025, and February 27, 2025. If we focus solely on the days when Ethereum ETFs performed better, but only on the condition that they recorded positive net inflows, this happened 55 times, or 20% of the time.
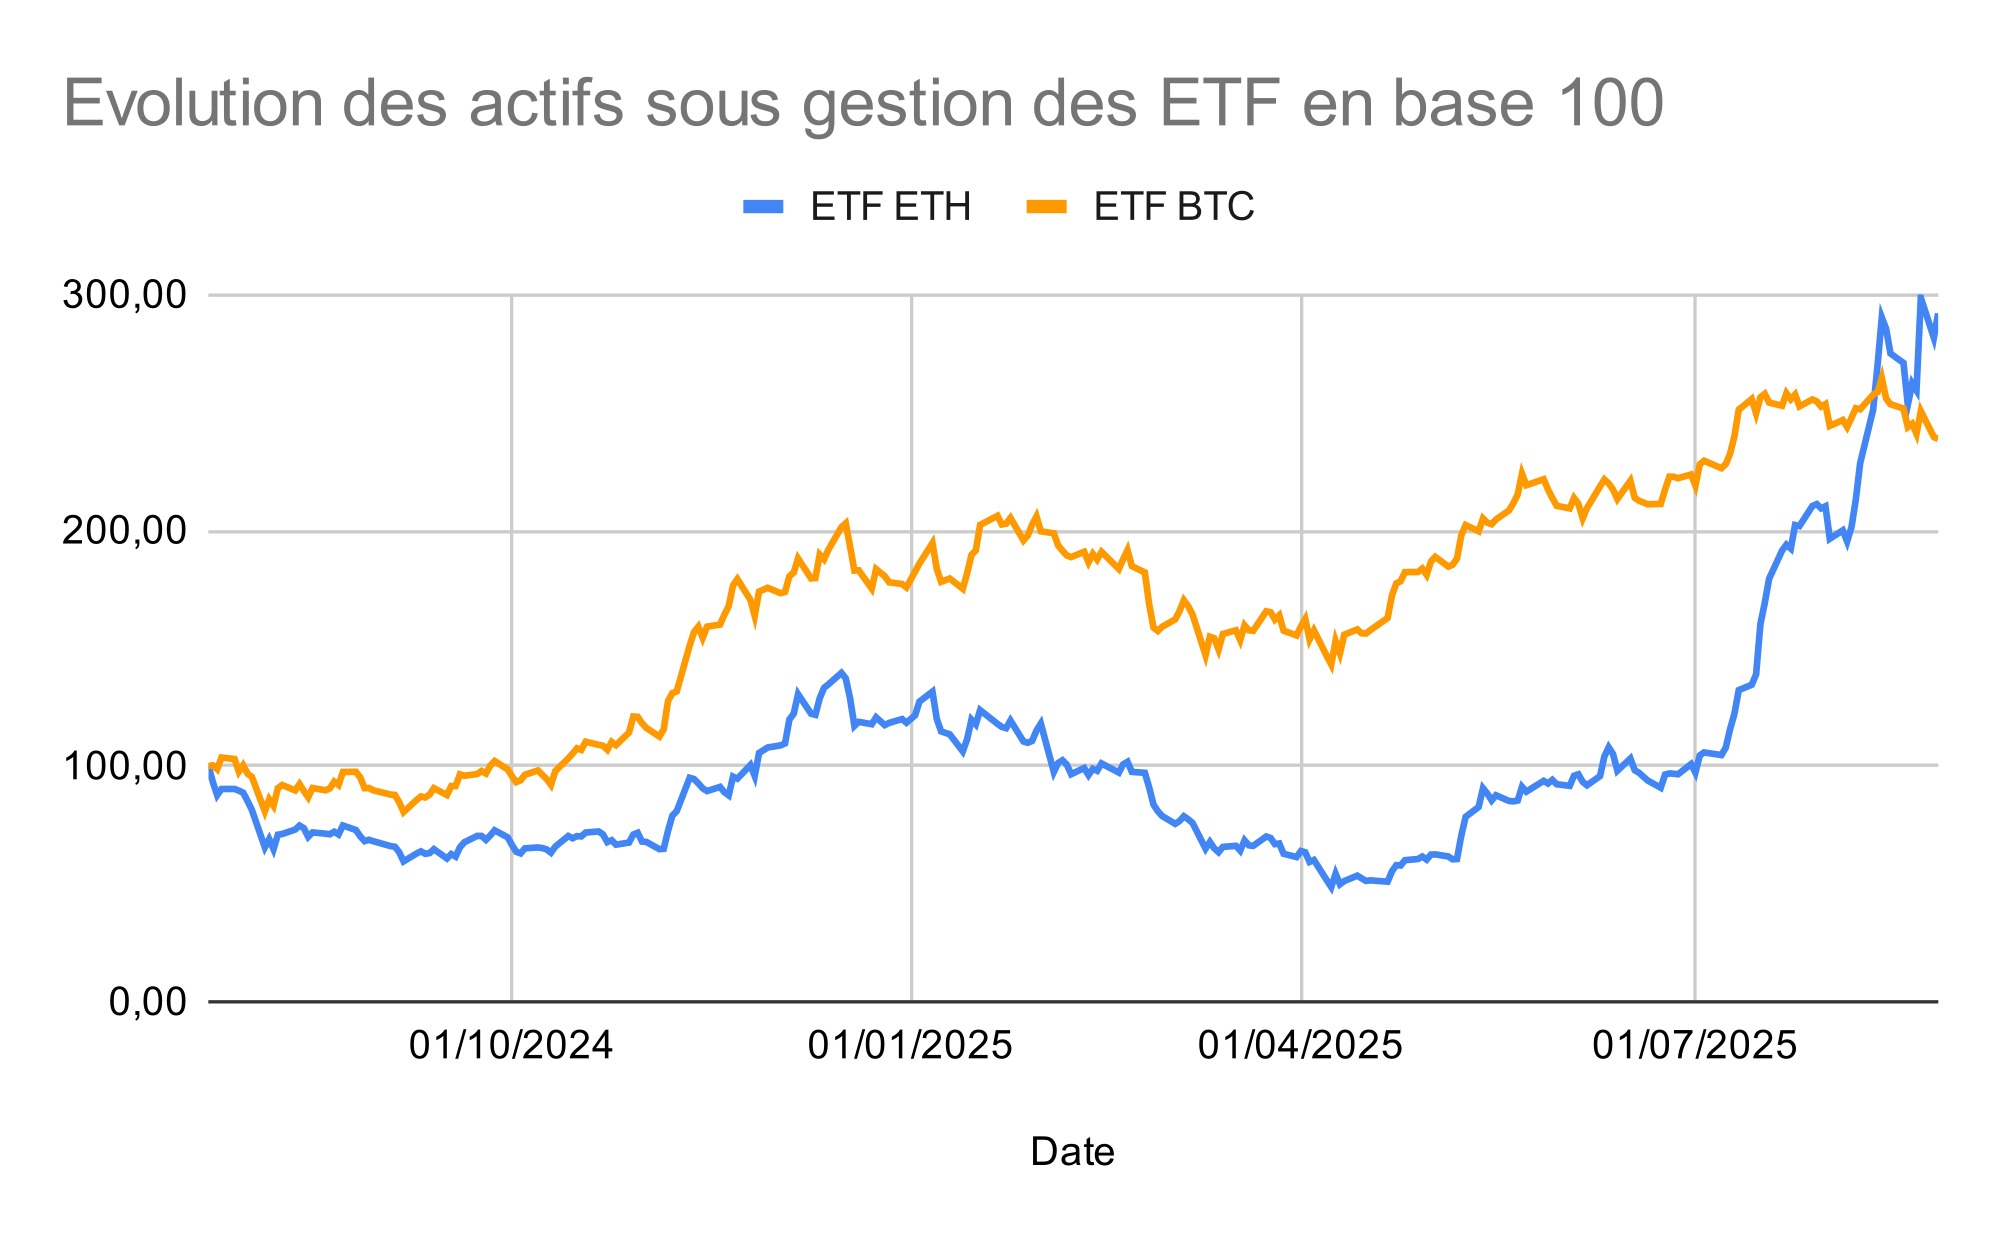
Of course, the scale of these two vehicles is not comparable, since while BTC funds total $143.15 billion in net assets under management, ETH funds stand at $29.89 billion at the time of writing. Nevertheless, a comparison can be made based on the percentage change in these ETFs since the launch of ETH ETFs. Starting from a base of 100, we can see that ETH has outperformed BTC since August 12, with their respective indices now standing at 281.63 and 239.54, respectively:
However, we can qualify our comments by noting that this better performance of Ethereum ETFs is only true if we take as a reference point the value of net assets under management for all funds as of July 23, 2024. If we apply this method to Bitcoin ETFs since their launch, we obtain a score of 498.6, representing a 398.6% increase in the value of net assets under management since January 10, 2024.
Furthermore, considering the same number of days as the lifetime of Ethereum ETFs (i.e., 399), this brings us to a period between January 10, 2024, and February 12, 2025, for Bitcoin ETFs. At that time, the value studied had increased by 296.77%, compared to 181.63% for Ethereum ETFs today.
In any case, Ethereum ETFs currently account for $29.89 billion, or 5.38% of ETH’s market capitalization, with a price of $4,590, up 3.7% over 24 hours.
liger to review BTC’s outlook for the end of the year. Should we give up on $200,000?
Bitcoin: a BTC price of $200,000 “very unlikely” for 2025
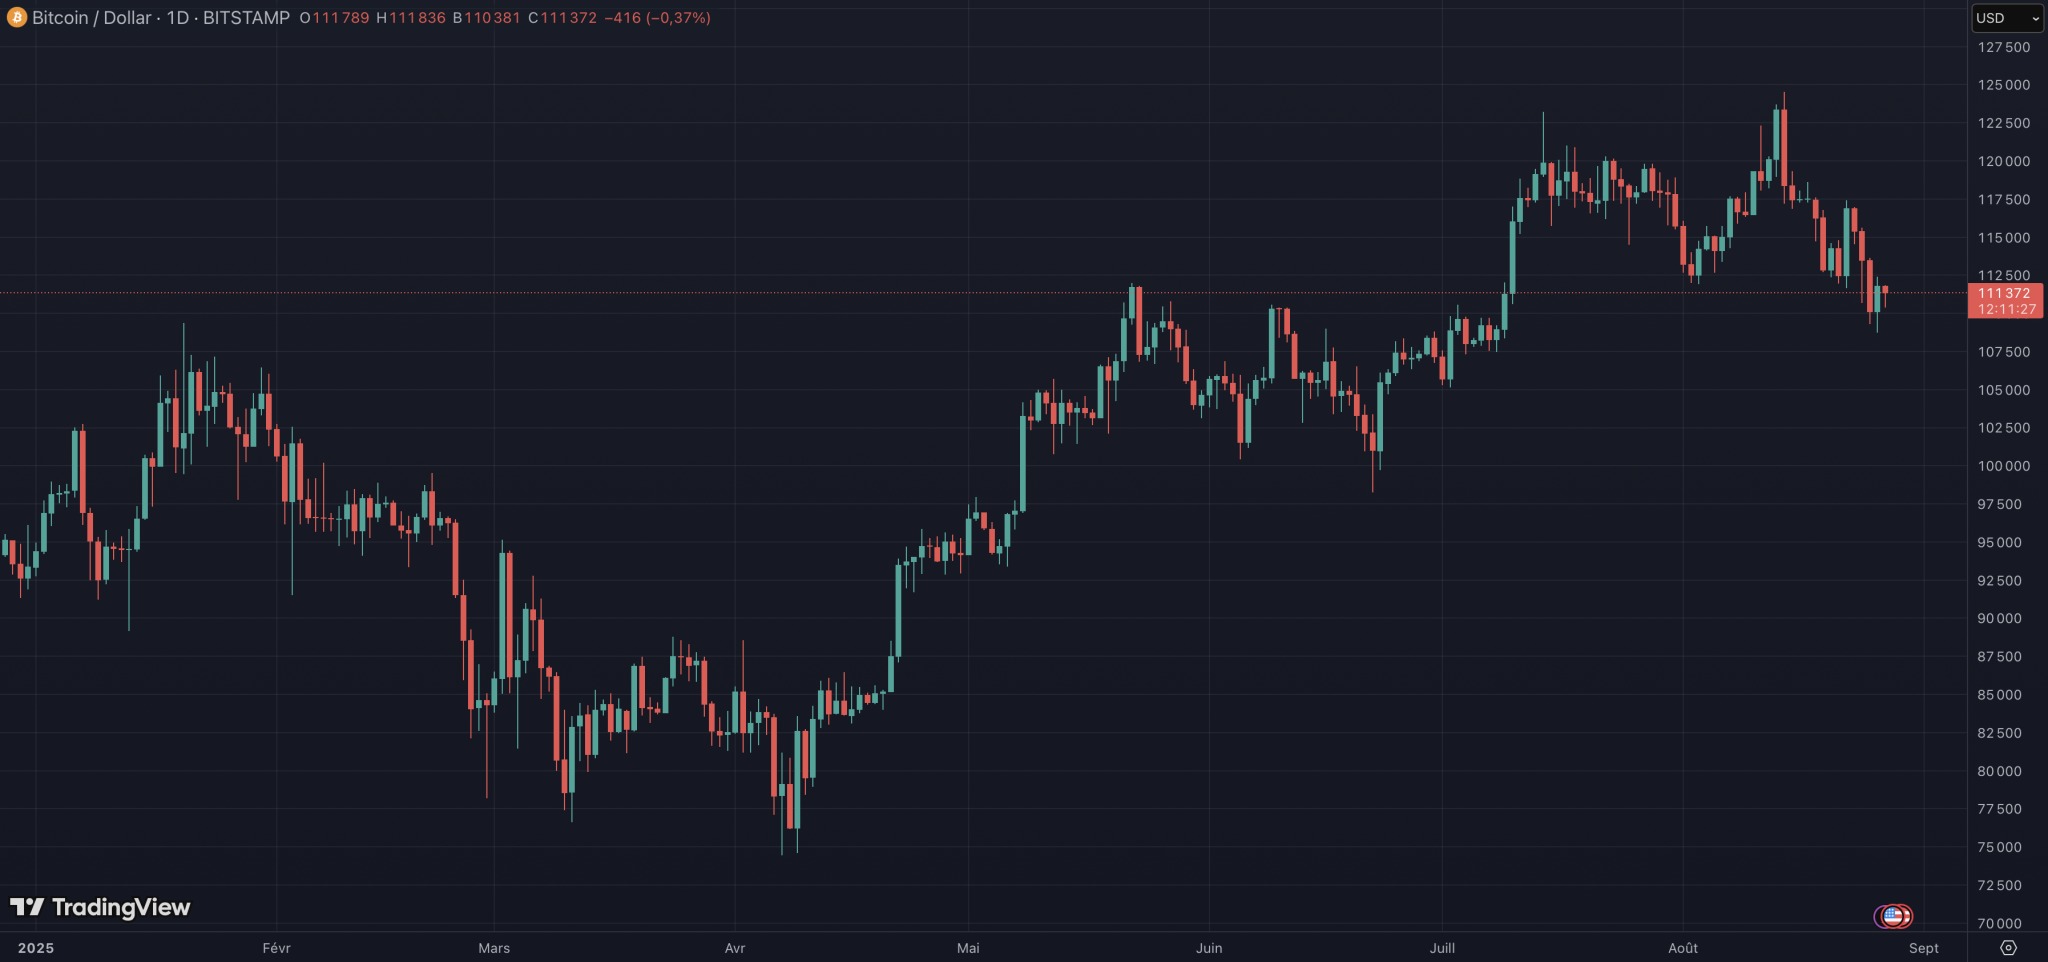
Since crossing the symbolic threshold of $100,000 in December last year, Bitcoin has been trying to continue its upward trend, supported by growing institutional adoption. It had the opportunity to set a new record on August 14, with the price of BTC exceeding $124,000 for the first time.
However, just over ten days later, the trend is very different. BTC has fallen back to the $110,000 level, forcing investors to look down again, towards $105,000 to start with, or even lower.
According to analysts at 10x Research, there are multiple reasons for Bitcoin’s decline, to the point that this third quarter is already shaping up to be the worst of the year in terms of BTC performance. As a result, the often-mentioned target of $200,000 by 2025, cited by Bernstein, Bitwise, Standard Chartered, and Arthur Hayes, seems compromised, to say the least.
Although the average price target of reputable analysts is $192,000, reaching a level close to $200,000 this year seems highly unlikely.
10x Research
At best, $140,000 by the end of the year
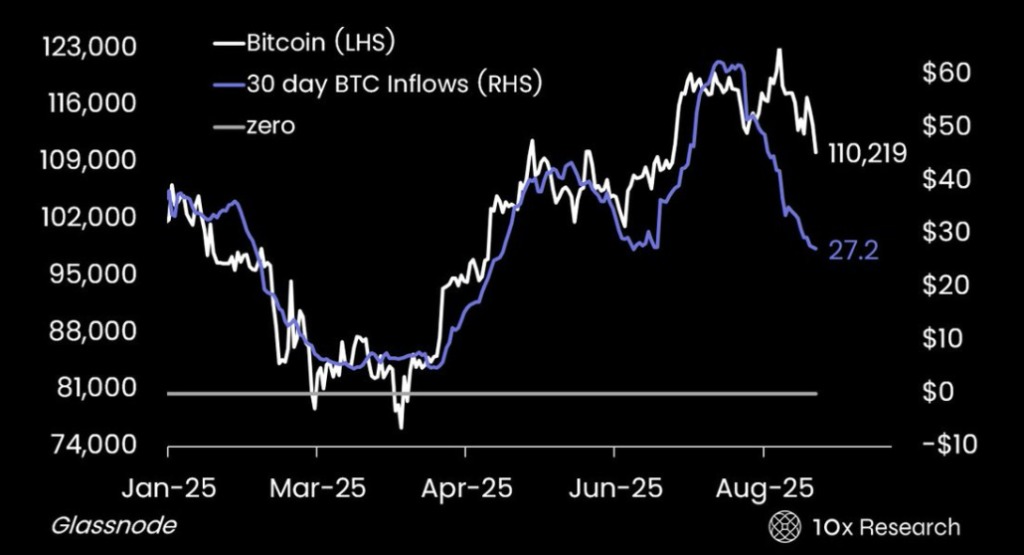
To explain why they are questioning this target, analysts at 10x Research point to a slowdown in inflows into the Bitcoin market, as well as miners under pressure from a rapidly changing market and seasonal patterns resurfacing as traders become overconfident.
The result of this equation seems obvious: in the “not as obvious as it seems” scenario of BTC reaching $140,000 by the end of the year, the probability of achieving this target remains equivalent to a coin toss of around 54%. That’s a 27% increase from the current level of $110,000.
For analysts at 10x Research, the current situation boils down to “the growing gap between market expectations and what the data shows.” That’s why they now show “a bearish trend model for Bitcoin.”
We have taken a more cautious stance on Bitcoin as we enter August. (…) A few overlooked factors are quietly shaping BTC’s trajectory towards the end of the year — and they are not the ones most investors are watching.
Can we still hope for a Bitcoin surge before the end of the year? Or should we expect a significant change in momentum, given that the monthly close for August may struggle to exceed the previous one, set at $116,000? For bettors on the Polymarket platform, the $125,000 level remains the most likely, with a probability currently set at over 70%.