
The second half of June saw a replication of the bullish impulse from the banking crisis in March, but without a breakout from resistance at $31,000. Buoyed by inflows into existing large bitcoin ETFs and the prospect of new ETFs becoming available in the coming months, will the bitcoin price succeed in making a new annual high?
A decisive monthly close
Since the beginning of May, the price of bitcoin has been building a gradual retracement towards the major support between $24,000 and $25,000. This was identified as the graphical border between the bullish and bearish scenarios. This identification was rightly made, as the market proposed a powerful rebound, like a chartist textbook case.
A bounce that is perhaps too perfect to be credible, especially as altcoins are not following suit and permabears are calling for this return to $31,000 to be aggressively shorted.
But in the history of BTC, bull markets have always begun with an outperformance by the number one and a rise in its dominance, before several months later the troops start to follow the BTC general.
It is true that the global macro context remains very complicated, with underlying inflation still far too resilient in Europe and the United States. This is forcing the major Western central banks to maintain very restrictive monetary conditions.
What doesn’t worry me is that major bull markets are always born out of fear, fear of a fundamental context that is still very difficult. The recent bullish impetus from the crypto commander-in-chief has been driven by concrete inflows into the main existing bitcoin ETF funds, as well as massive news about the forthcoming launch of new BTC ETFs from issuers that are leaders in global high finance.
In short, the year-on-year uptrend in the bitcoin price remains technically well-constructed, and is still up more than 80% since the start of the year. With this in mind, I would urge you to keep a very, very close eye on the new monthly close for BTC on Friday 30 June.
If the market manages to hold around $29,000 or $30,000 in the wake of the US inflation data (PCE price index, Friday at 2.30pm), then the monthly chart update will be a good indicator of the medium- and long-term trend.
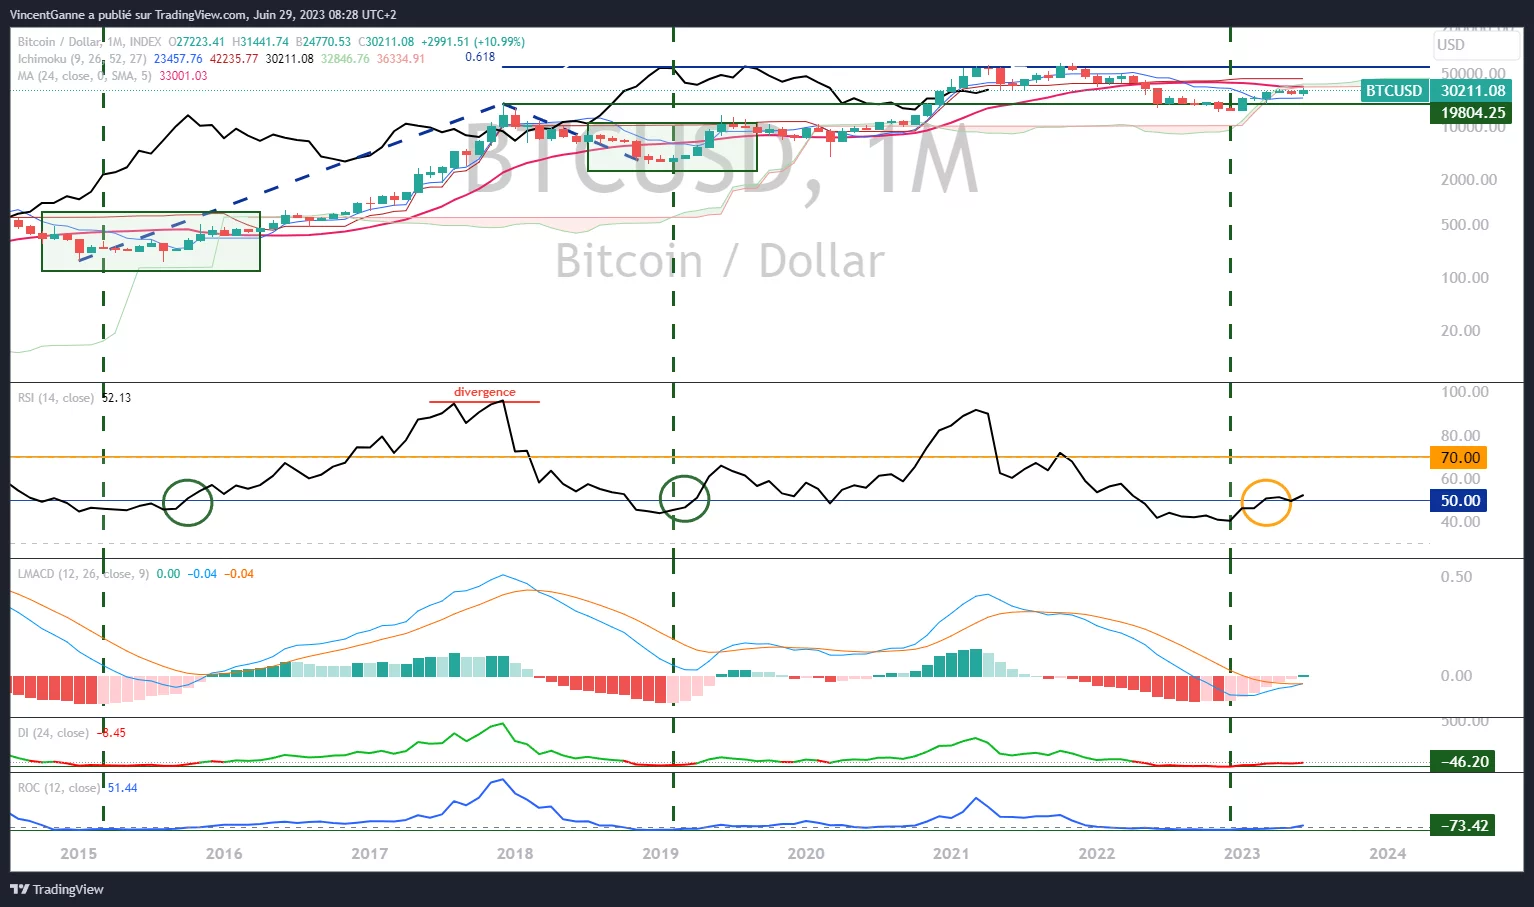
Graph produced with the TradingView site and which exposes the Japanese candlesticks in monthly bitcoin price data with a logarithmic scale
Technical analysis makes two chartist assumptions in the short term
Let’s return now to the short-term technical analysis of the bitcoin price, which has paused below resistance at $31,000, the peak of the banking crisis in March. Two chartist hypotheses seem possible to me:
- A sideways transition sequence around $30,000 before attempting the breakout from resistance at $31,000 and aiming for the next target of $33,000;
- A retracement towards $28,500 before attacking resistance again.
The upside would be invalidated by a break of support at $28,500, raising the risk of a double top and a return to a minimum of $25,000.
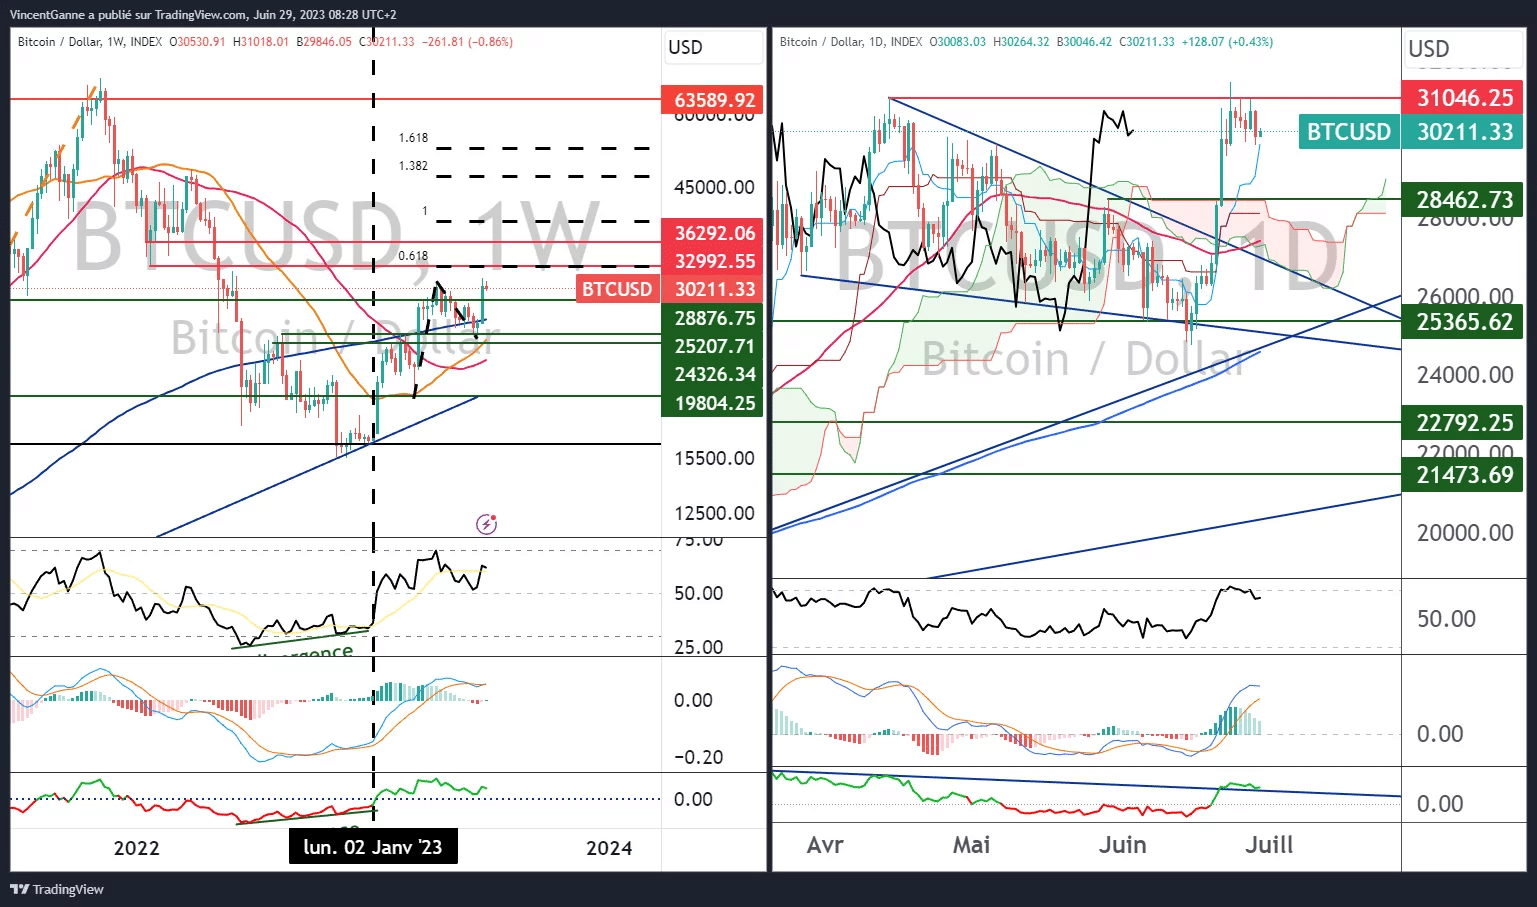
Graph produced with the TradingView website showing the weekly and daily Japanese candlesticks for the bitcoin price