
BTC could form a local bottom between $100,000 and $110,000, but first it must absorb selling pressure from long-term investors. Does the market still have a chance to recover?
The dust settles on the markets
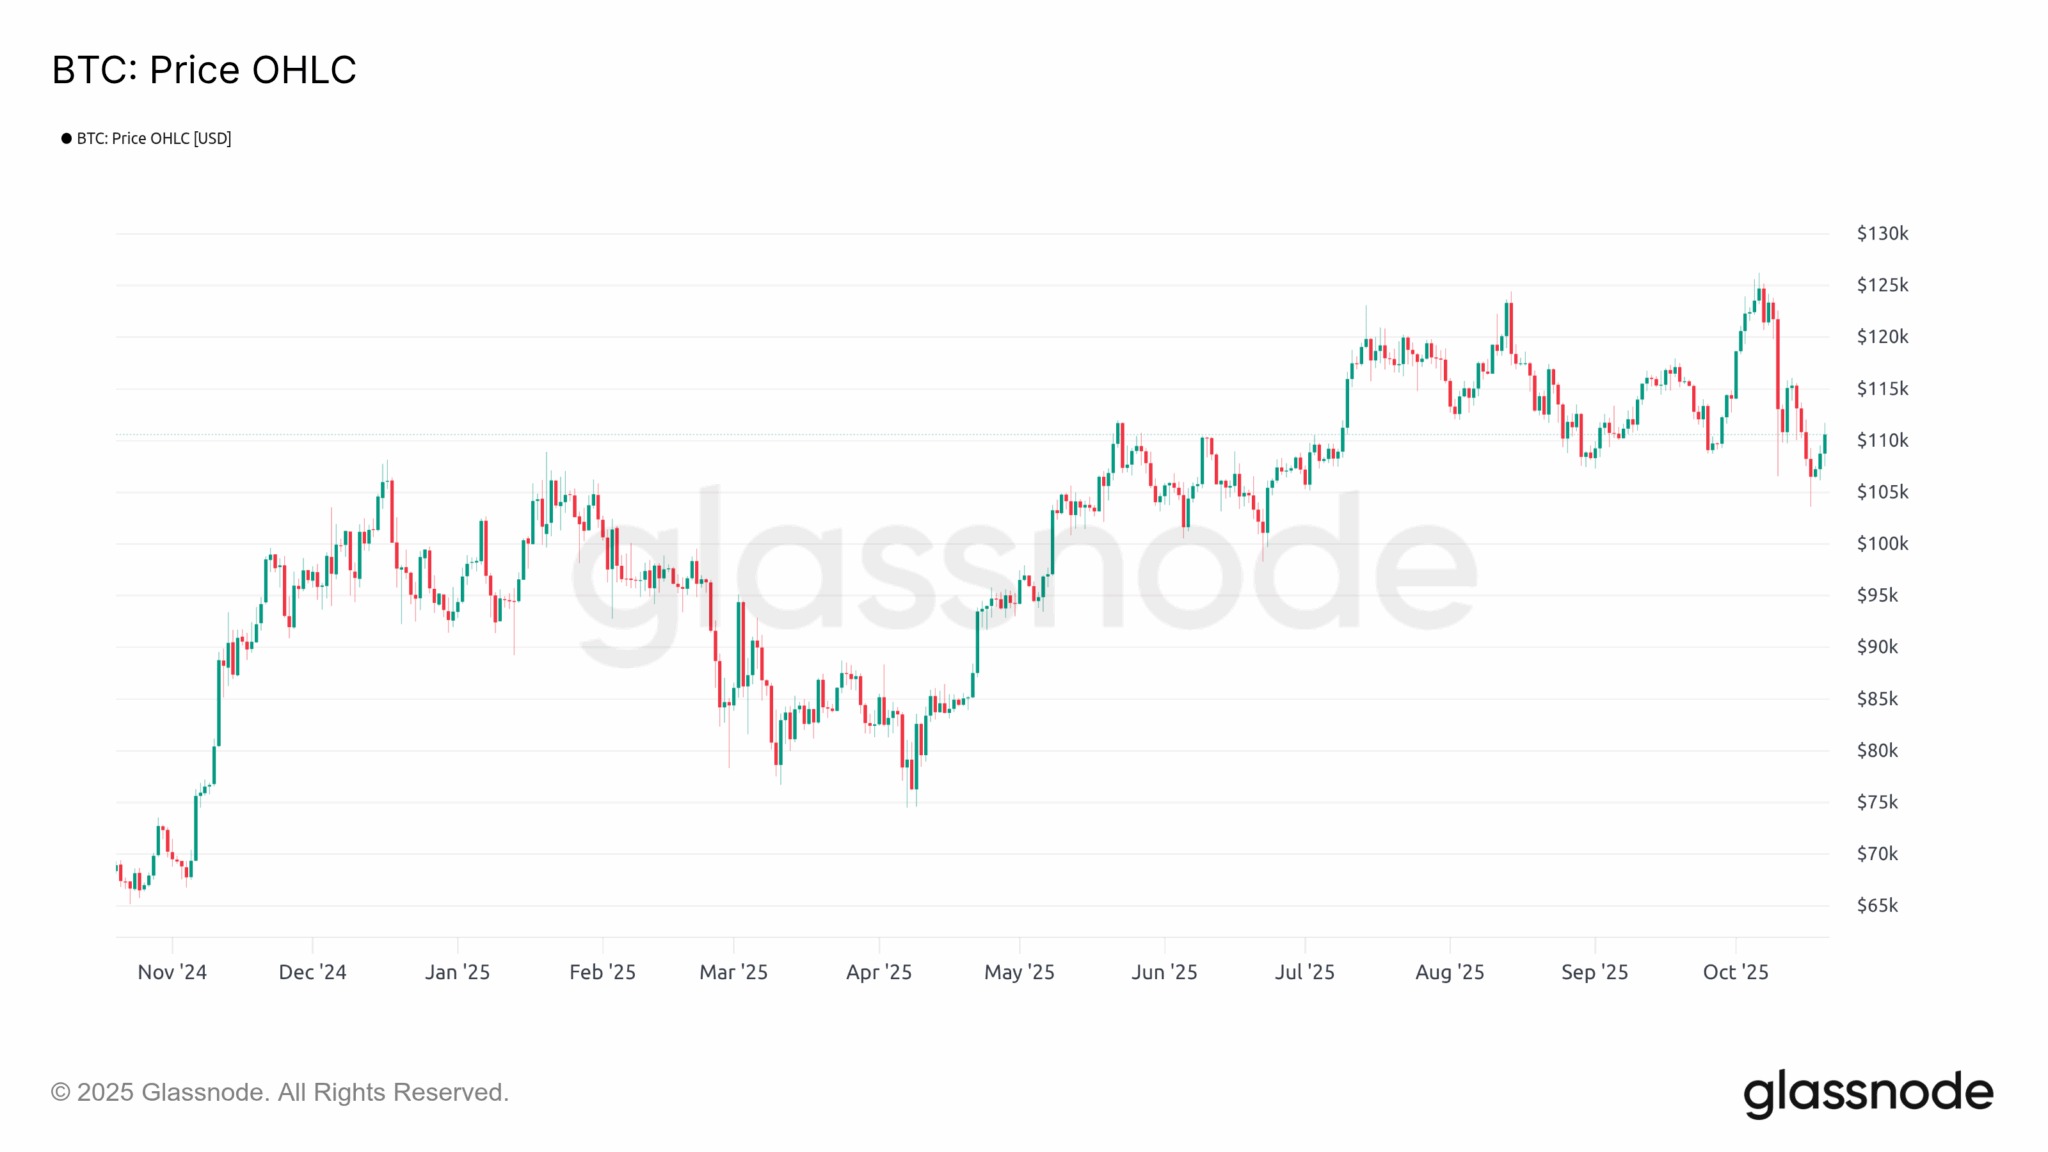
After the significant speculative purge suffered by the crypto market in recent weeks, the price of Bitcoin is attempting to stabilize around $110,000, struggling to maintain the range established since July 2025.
Although the bullish momentum has been severely weakened, the short-term market structure is showing early signs of seller exhaustion. Does BTC still have a chance to recover? Let’s take stock here!
The latest entrants underwater
In our previous analysis, we revealed that spot markets had suffered significantly lower losses than derivatives markets.
Today, we will focus on spot markets to assess BTC’s position within the bull cycle, the situation of short-term investors (STH), and the behavior of long-term investors (LTH).
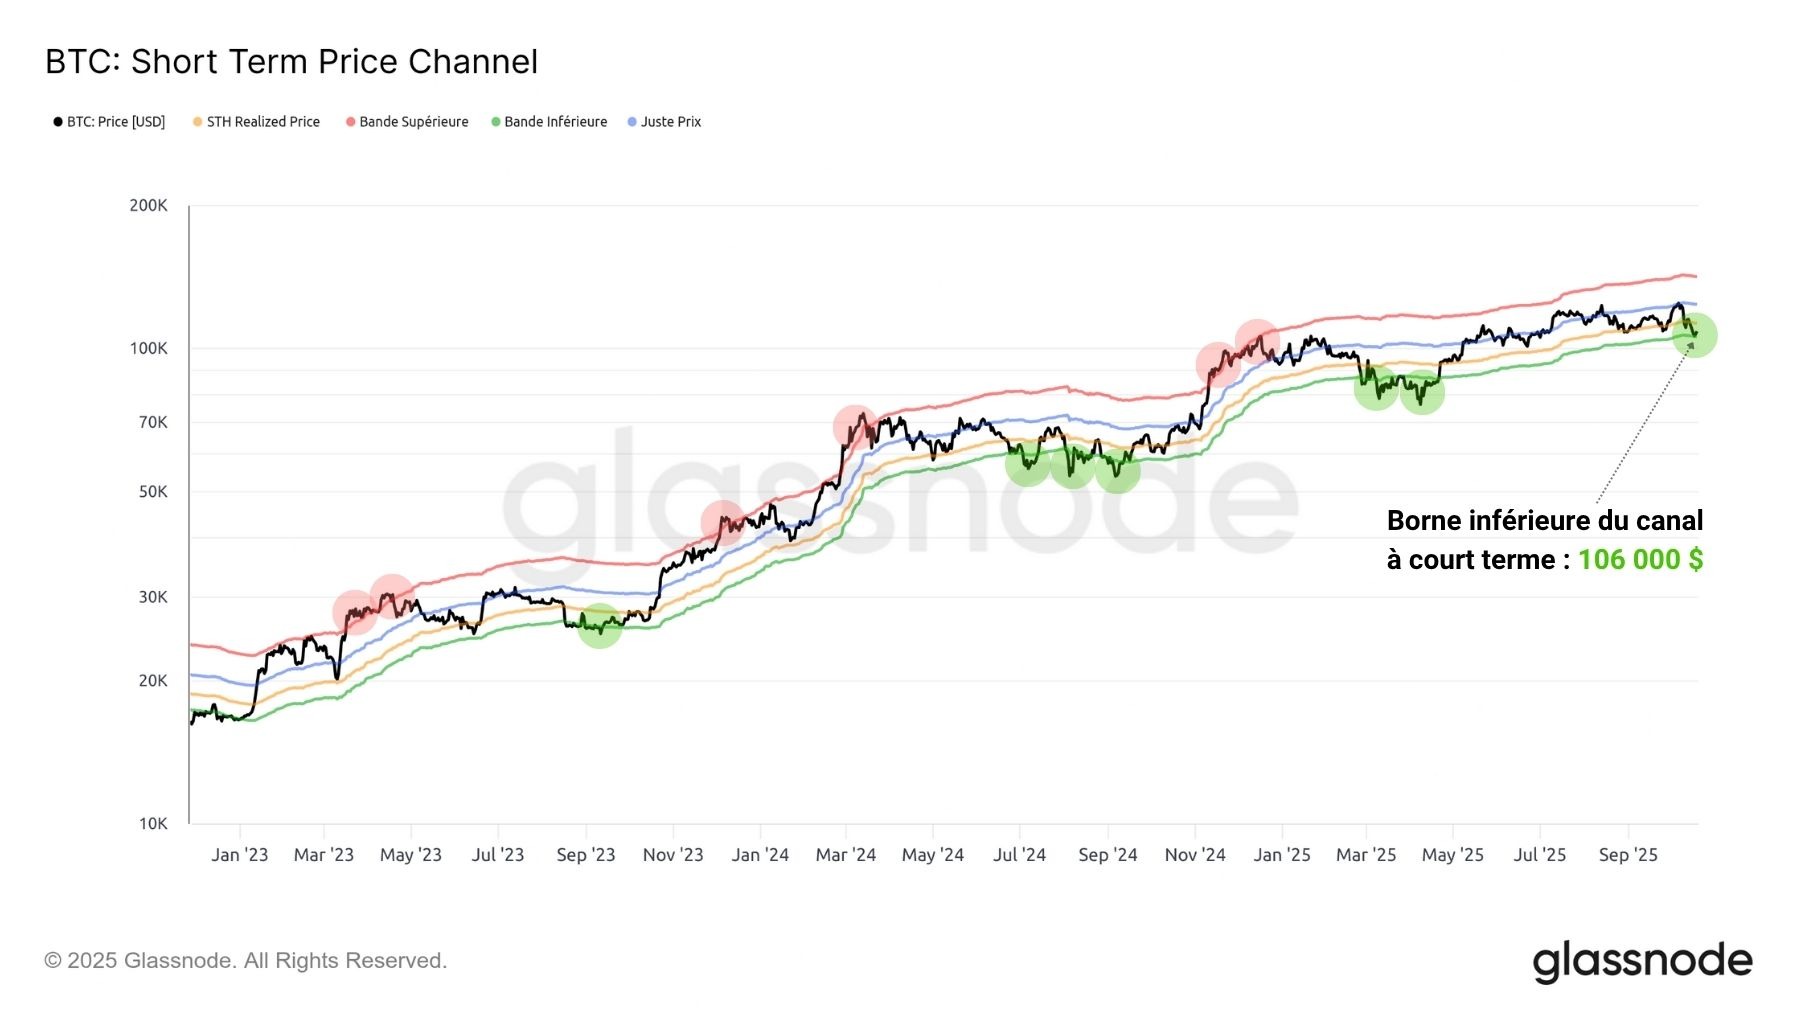
The chart below shows a short-term price channel framing the bullish and bearish waves of BTC since the start of its new bull cycle in early 2023.
It is important to note that the market is currently testing the lower bound of this channel, the area from which all the local lows of the current bull run have formed.
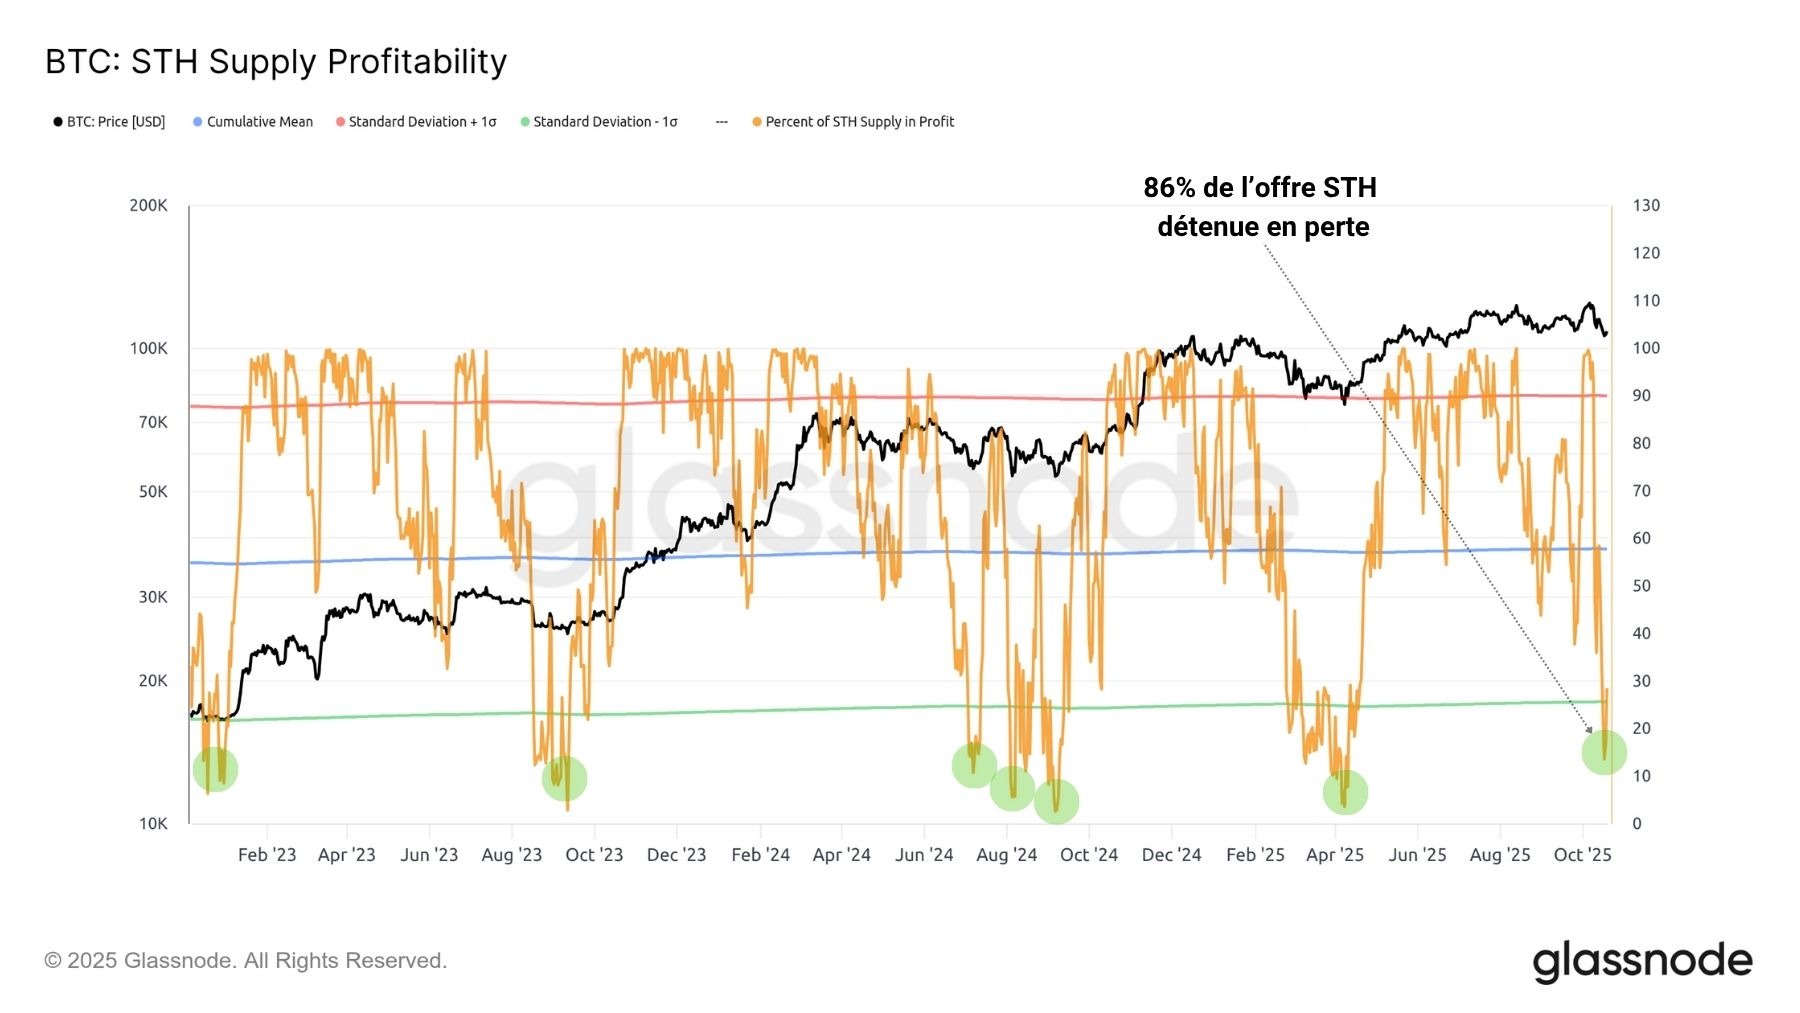
Short-term holders (STHs), defined as participants who acquired their BTC less than 155 days ago, remain the group most impacted by the recent correction.
In fact, nearly 86% of their total holdings are currently held at a loss, highlighting a climate of financial stress and psychological tension that is pushing the least resilient among them to capitulate (sell in panic).
This value is considered statistically low and anchors the current market context in the same profitability conditions as the local lows of September 2023, July 2024, and April 2025.
When the percentage of STH holdings in profit falls below 25%, the market is generally close to short-term seller exhaustion, heralding a potential bullish recovery in the coming weeks.
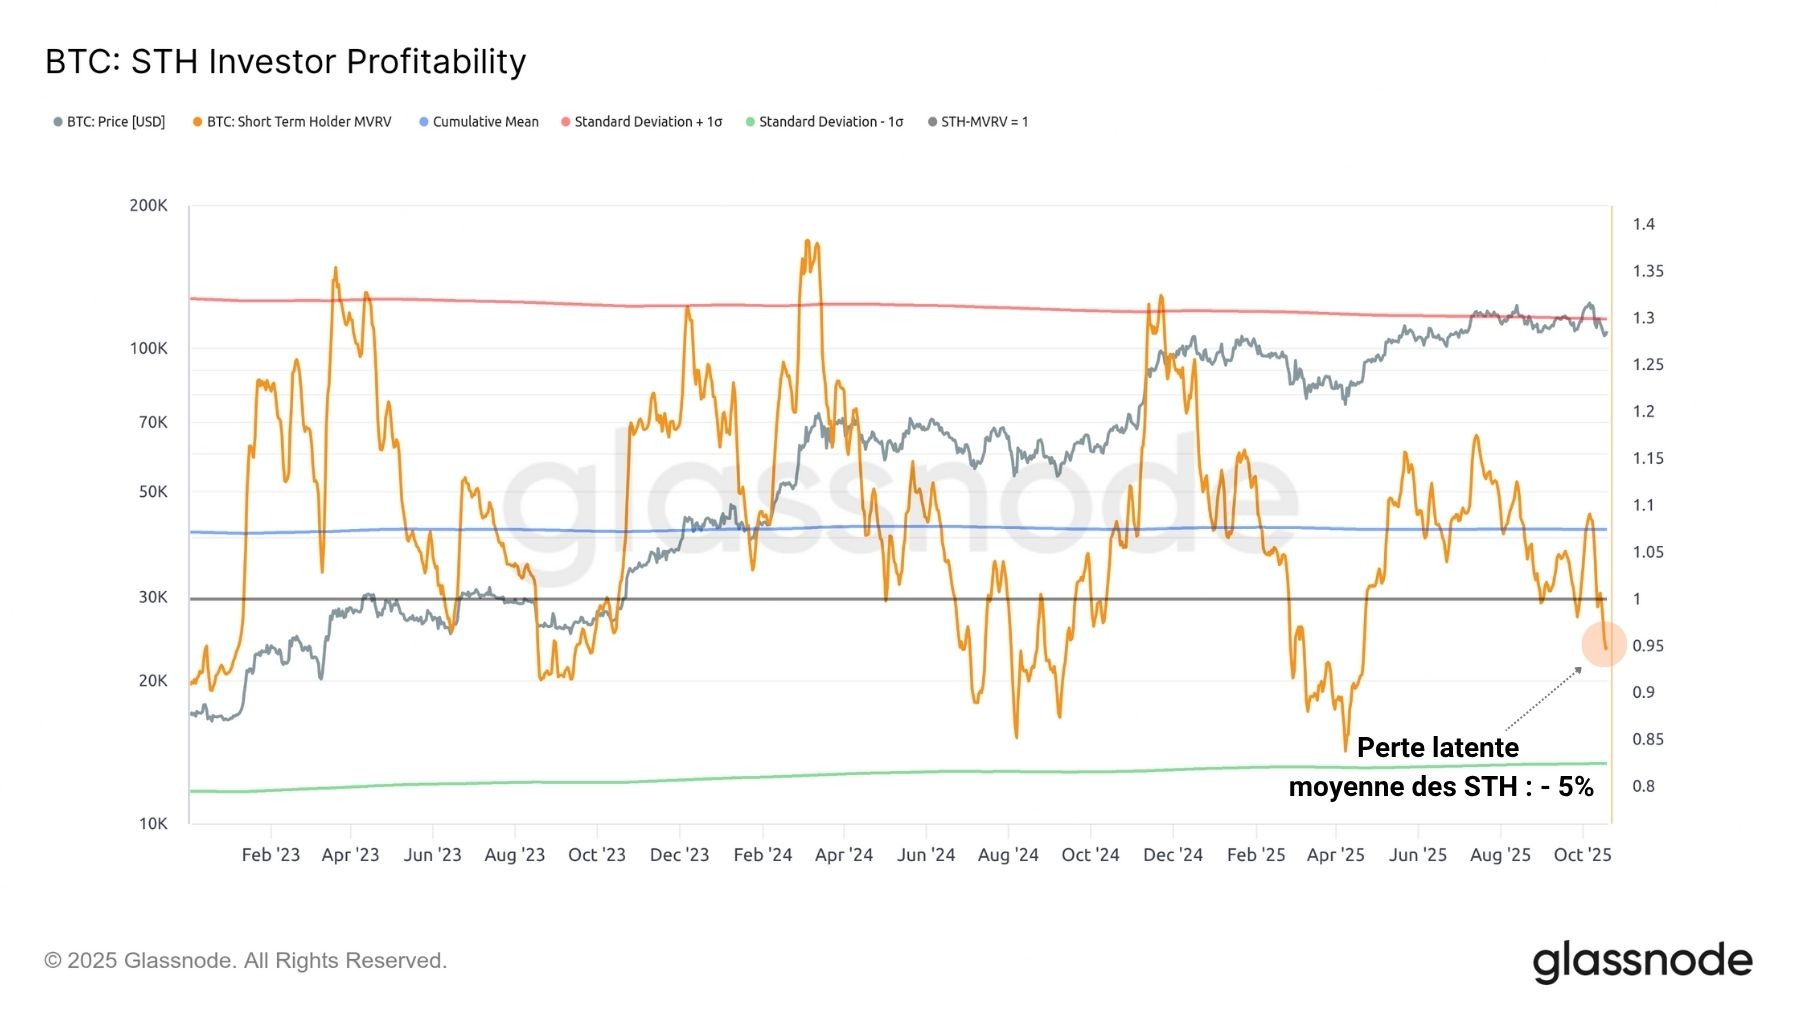
To assess the STH situation in greater depth, we can estimate their unrealized losses using the STH-MVRV. This indicator measures the average profitability of all short-term investors and provides a clear overview of their condition at a given moment in time. After BTC fell below the average purchase price of STHs last week, the average profitability of this group is logically negative, without however signaling as much pain as during previous corrections.
With an average unrealized loss of 5%, short-term investors are facing moderate financial stress that could intensify and lead to a real capitulation if the price revisits the $100,000 zone.
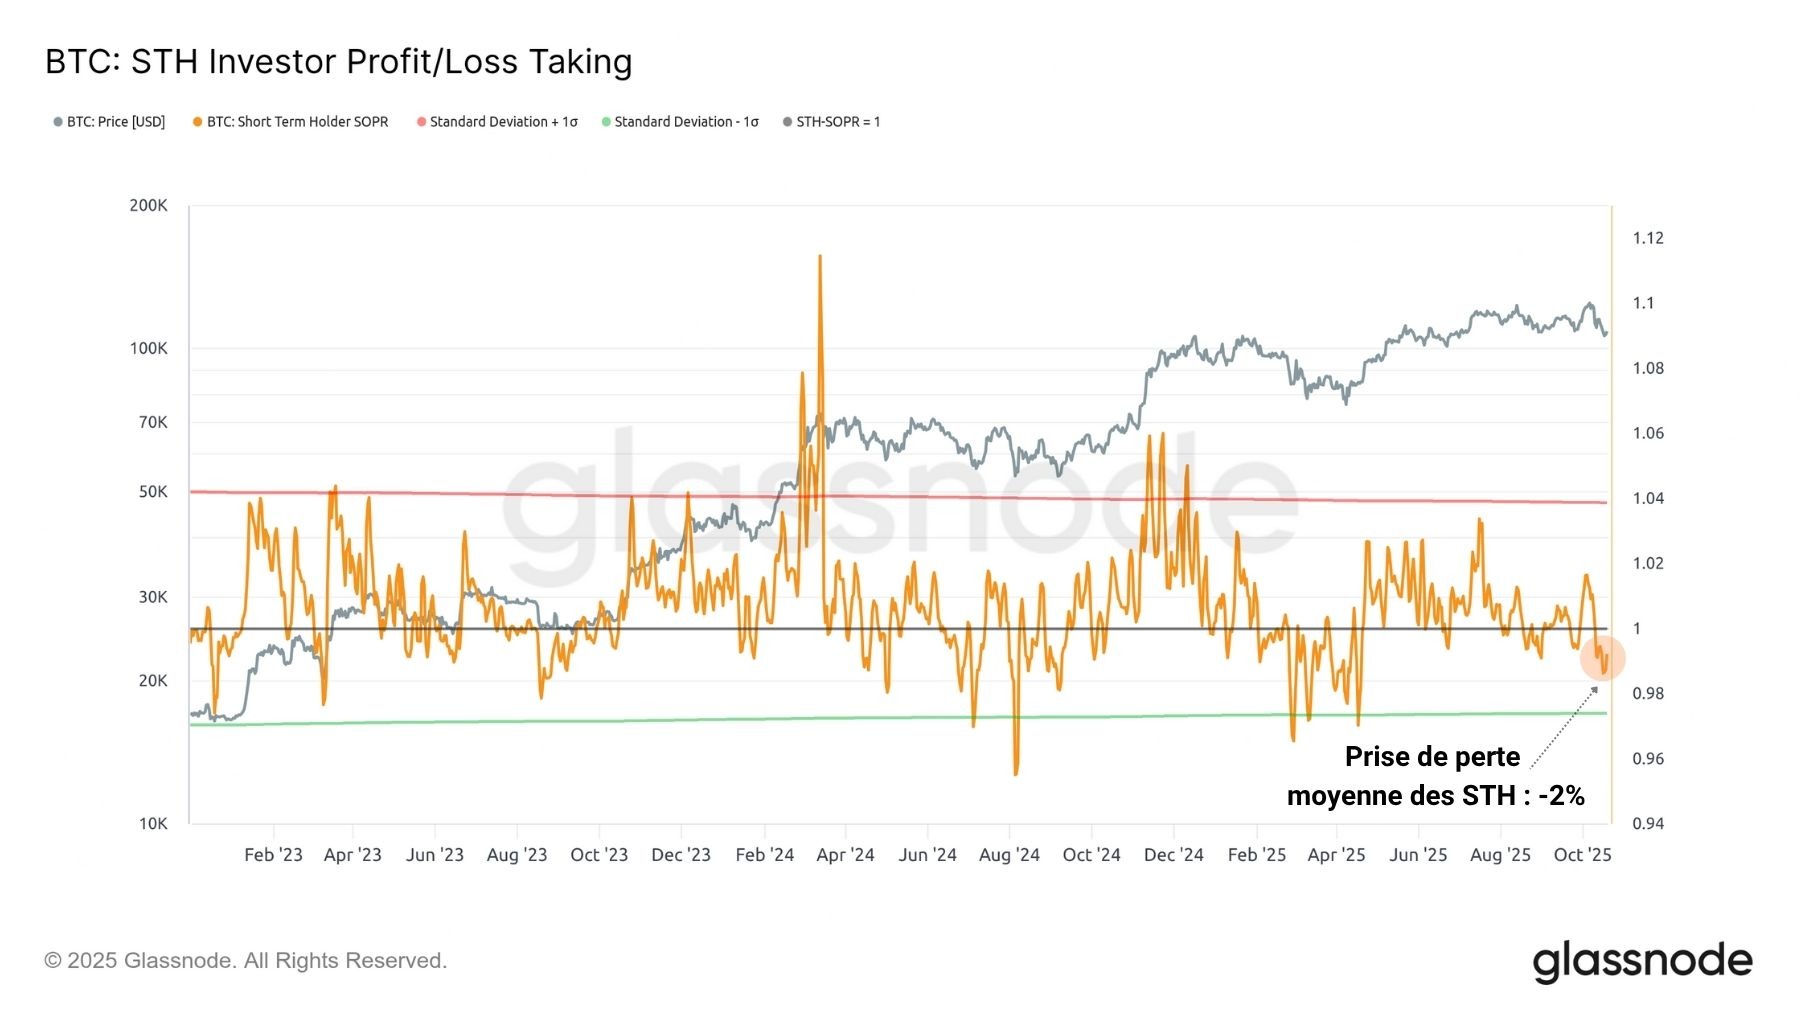
Similarly, STH profit-taking/loss behavior, as measured by the STH-SOPR, remains fairly low, at around -2%.
This shows that, despite the decline, the pressure has not yet reached the level of panic that usually triggers a real capitulation among short-term investors.
In many ways, current market conditions are closer to the correction of September 2023 than those of July 2024 and April 2025.
Overall, STH data points to moderate short-term pain, which could potentially pave the way for local bottoms to form between $100,000 and $110,000.
Distribution of HODLers
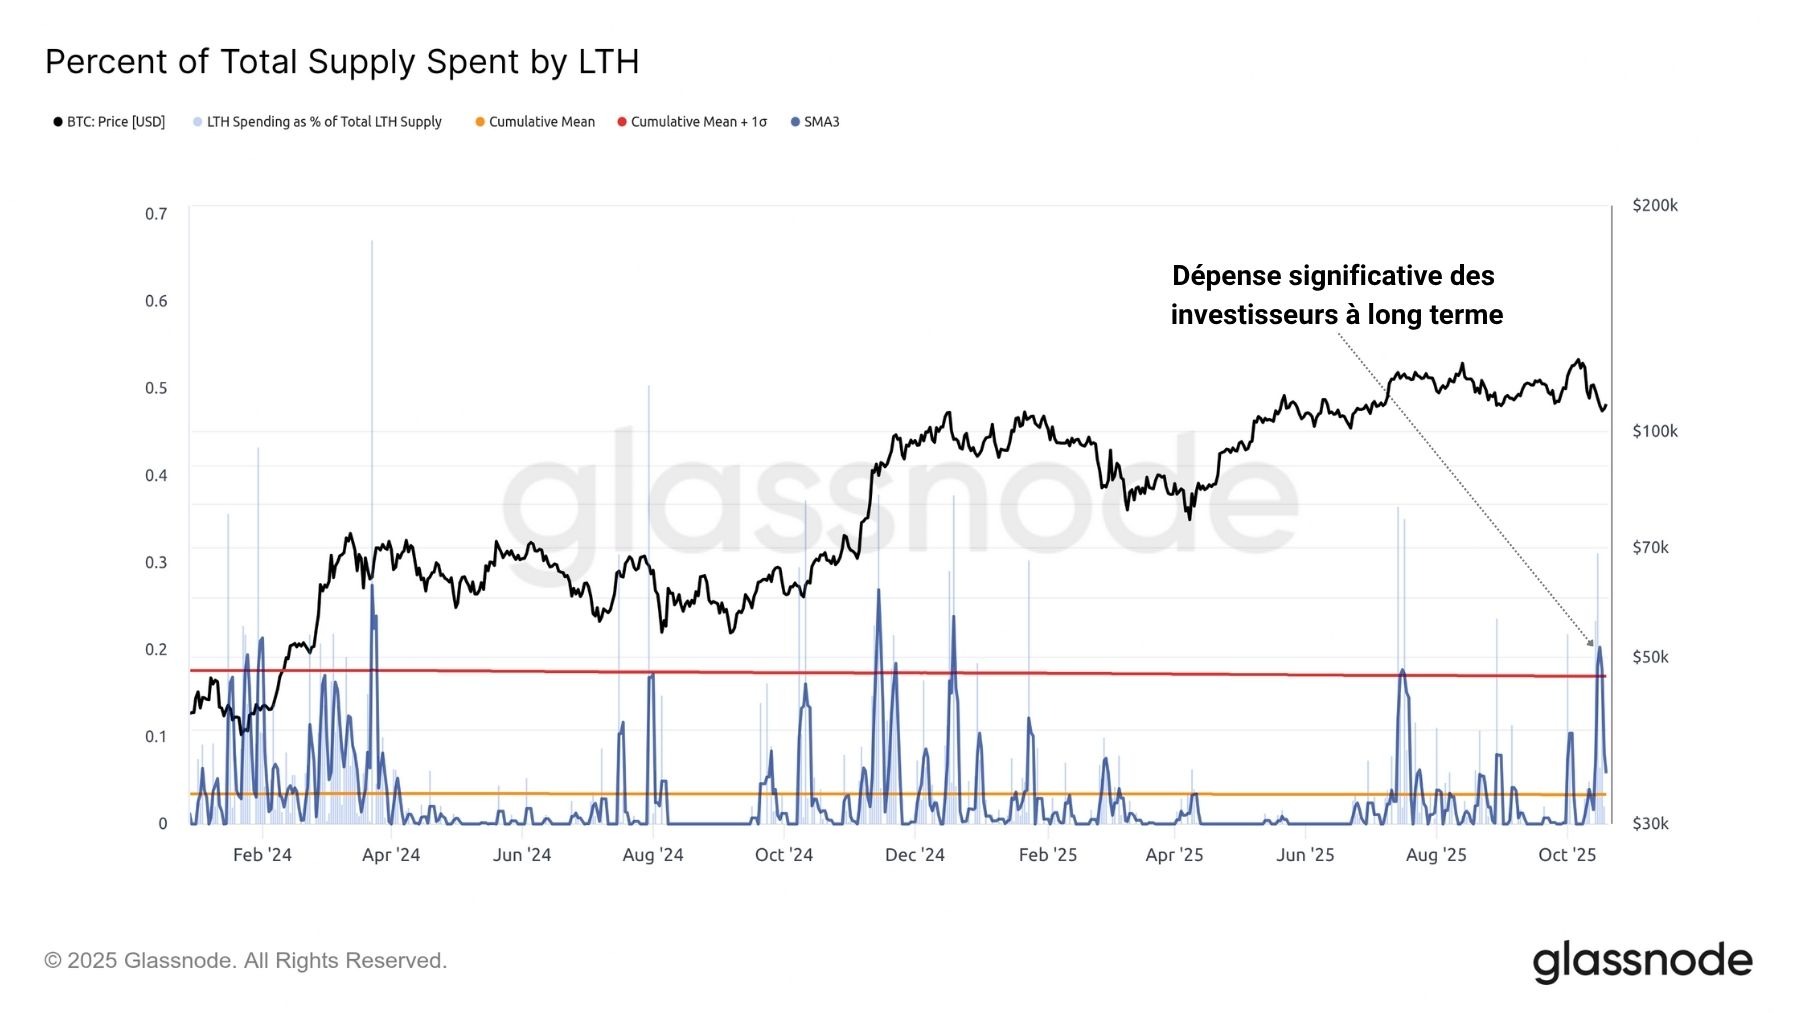
While STHs are underwater but realizing few losses, long-term investors (LTHs or HODLers) have increased their selling pressure during the correction, distributing a significant portion of their holdings at a profit.
While some assume that this profit-taking has no tangible impact on the market, it should be remembered that LTH sales volumes often exceed 10,000 BTC and can have a one-off impact on the price of BTC, particularly on the downside.
The chart below shows that, since August 2025, long-term investors have been putting moderate to strong profit-taking pressure on the market, which partly explains the stagnation of BTC between $108,000 and $117,000.
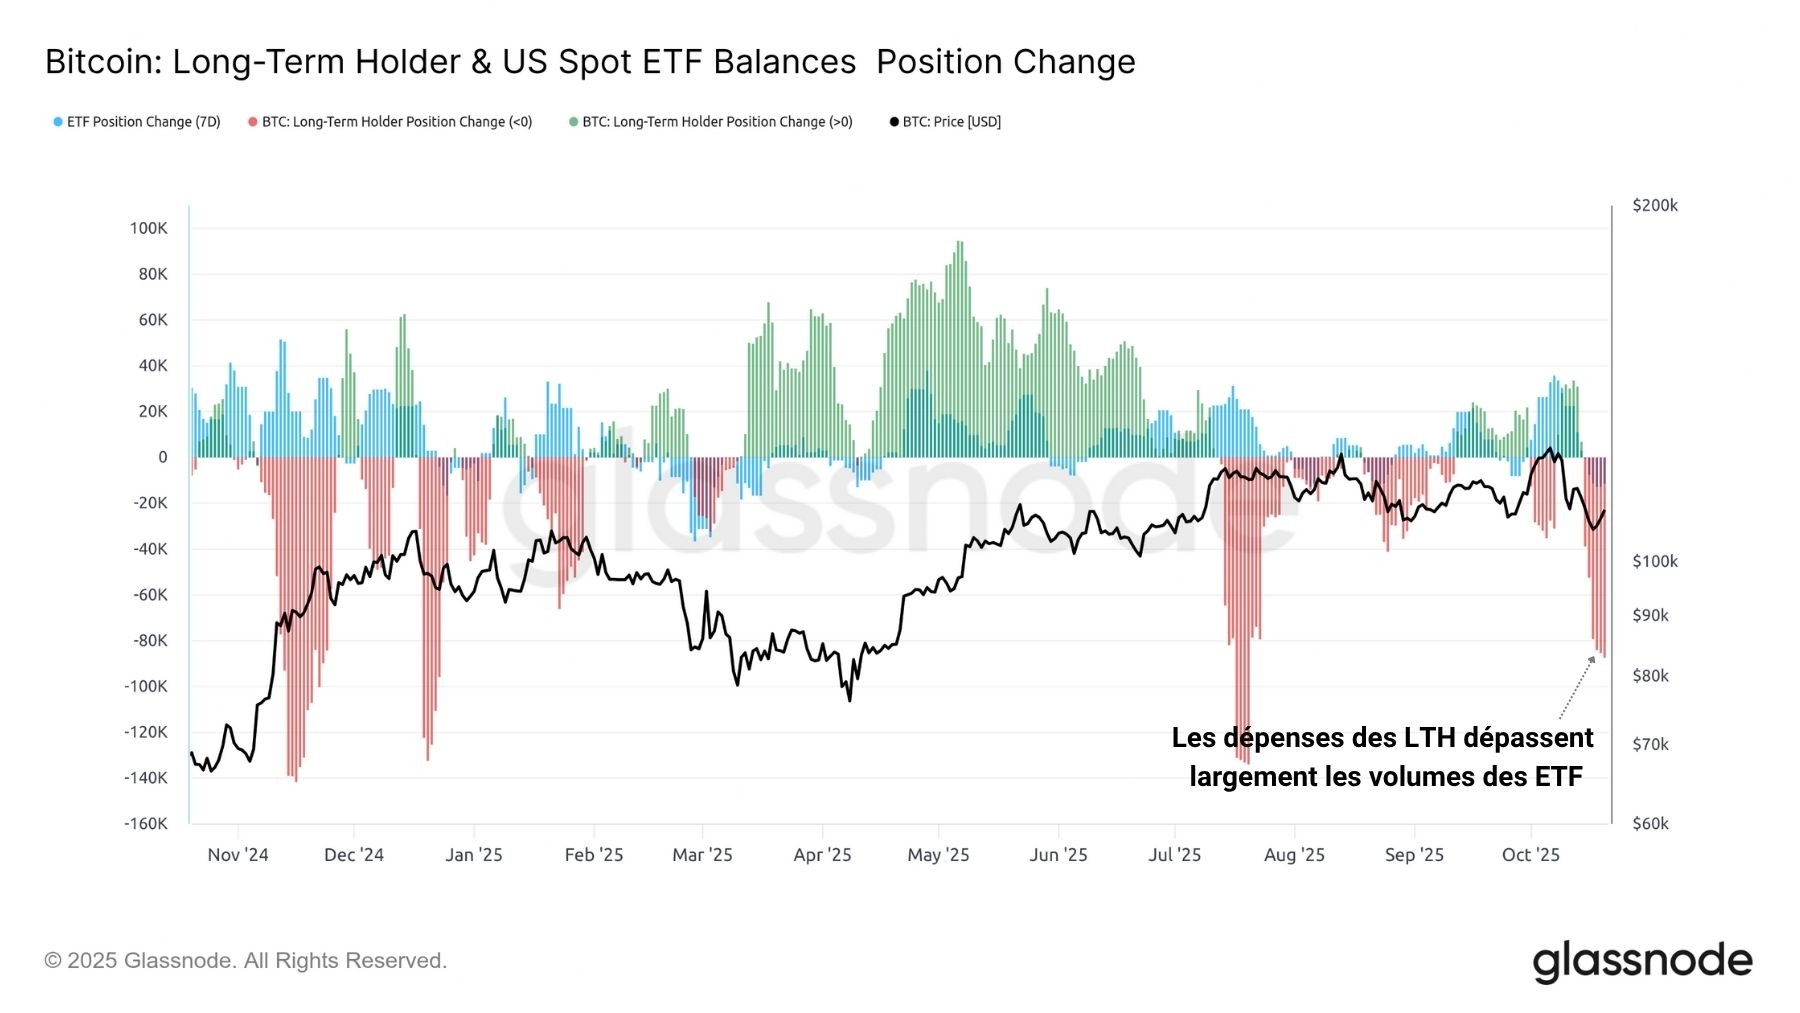
To better understand the significance of this selling pressure, the following chart compares weekly sales volumes of US Spot ETFs with those of LTHs.
With sales volumes exceeding 80,000 BTC over the last seven days, there is no doubt that LTH selling pressure currently represents a considerable burden that the market must absorb before it can hope for a bullish recovery.
Summary of this on-chain analysis of BTC
Ultimately, this week’s data indicates that the market is now navigating a context conducive to the formation of a local bottom.
Nearly 86% of short-term investors’ supply is held at a loss, a statistically low value that anchors the current context in the same profitability conditions as the local bottoms of September 2023, July 2024, and April 2025. However, long-term investors are selling heavily, which is weighing heavily on the market. Until this pressure is absorbed, a bullish recovery remains unlikely.