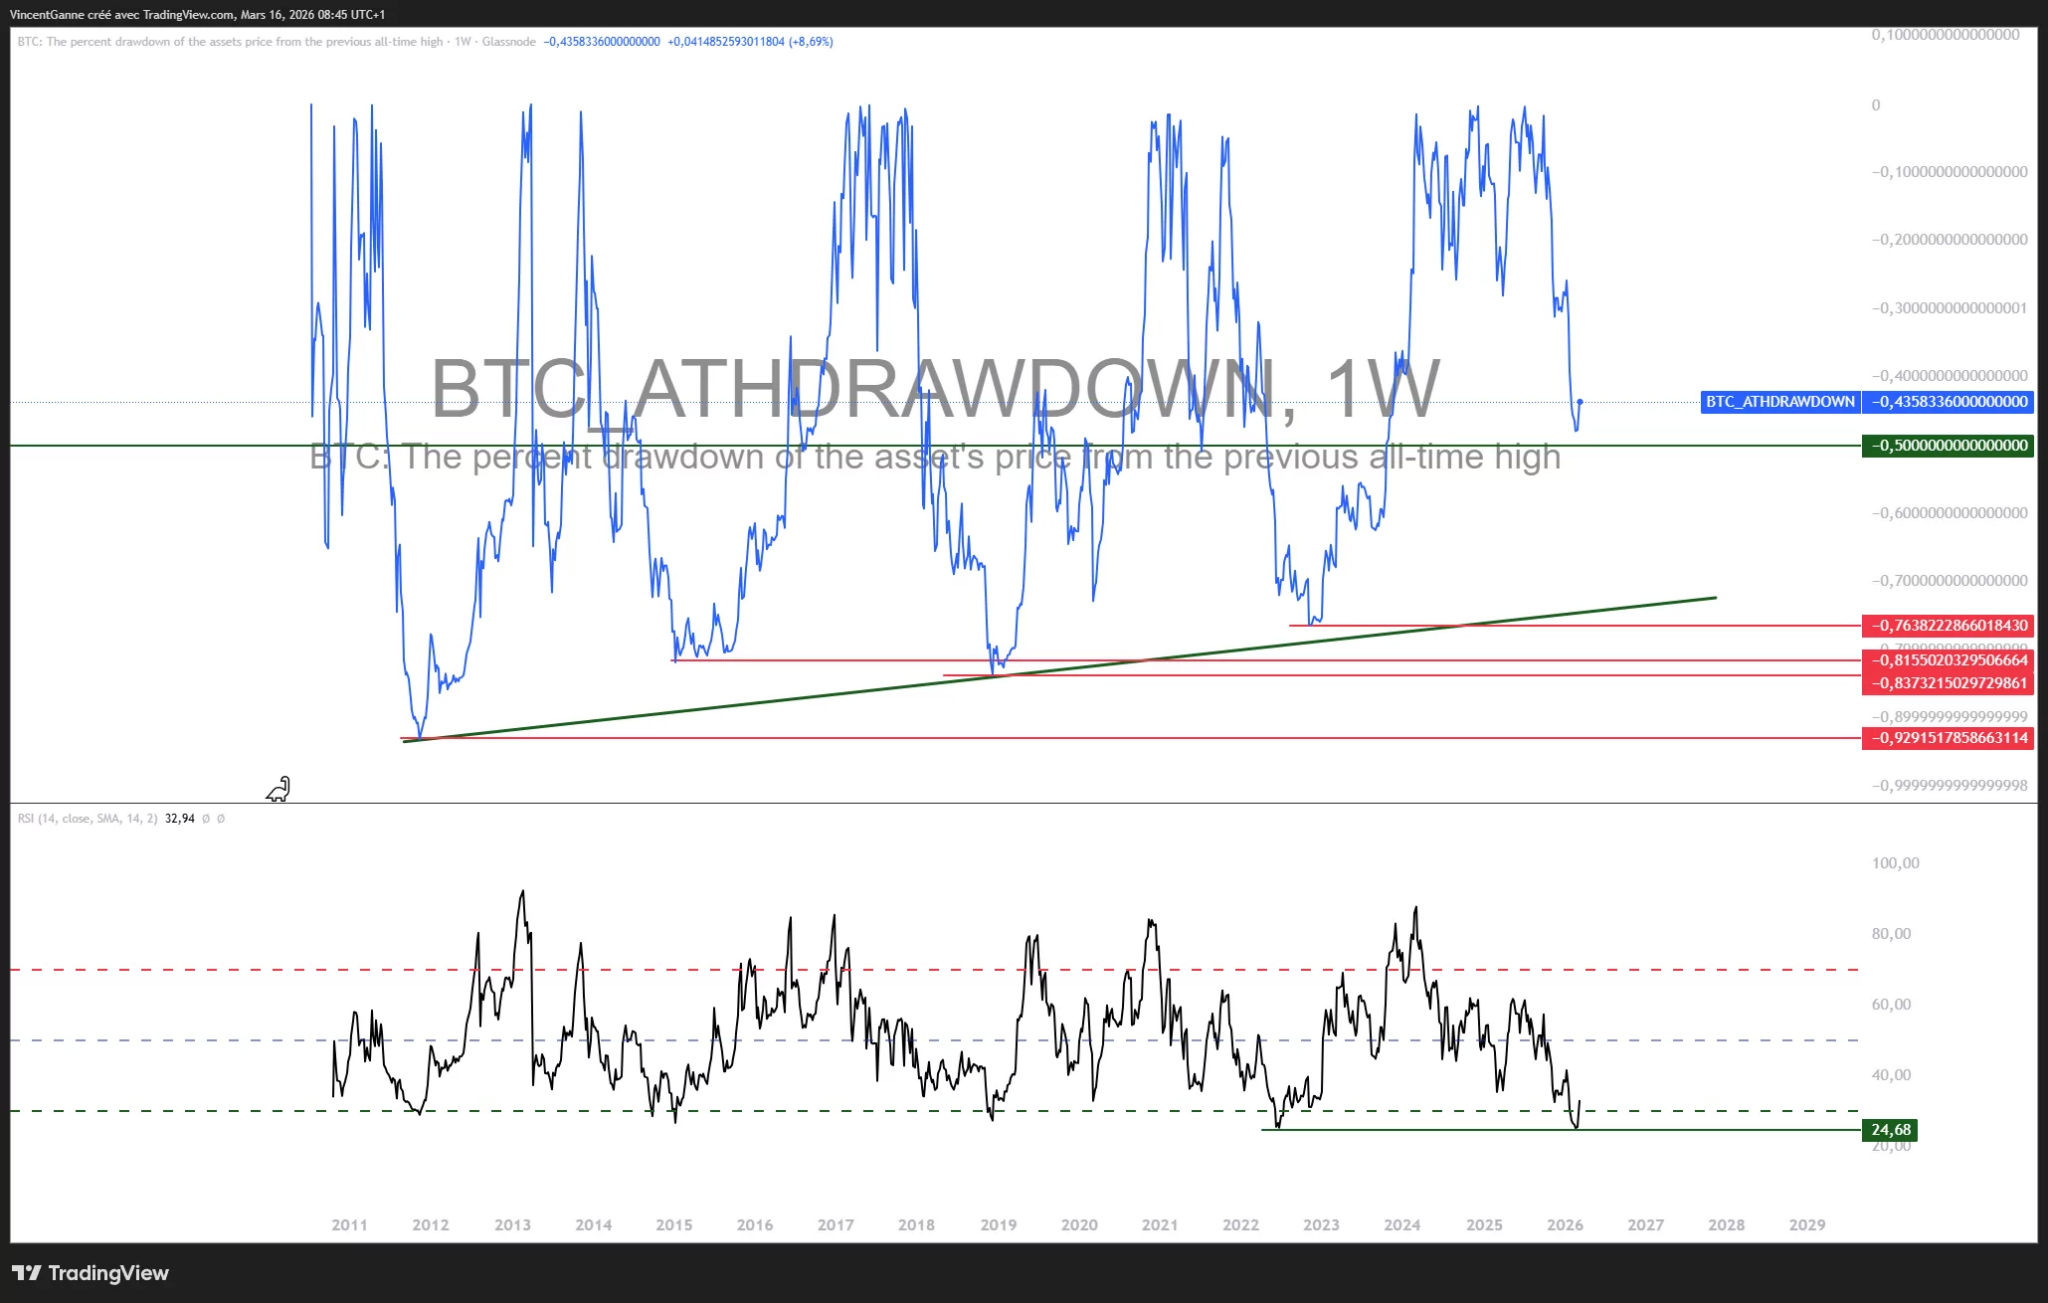
Since the start of U.S. and Israeli military operations against Iran on Saturday, February 28, risky assets in the stock market have been under pressure, particularly the equity market. But surprisingly, the price of Bitcoin has actually risen by 10%. Discover five logical explanations for this outperformance in this analysis by Vincent Ganne.
Bitcoin Holds Its Ground Despite the Conflict
First and foremost, recall how the Bitcoin price behaved when the war in Ukraine broke out on February 24, 2022. BTC managed to post a gain of more than 30% in the four weeks following the invasion of Ukraine, before eventually resuming its cyclical bear market trend that developed in 2022.
The current situation may seem similar, since the conflict broke out in late February 2026 and Bitcoin’s price is believed to be in the cyclical bear market described by the 4-year cycle.
Is Bitcoin repeating this “dead cat bounce” pattern? It’s very possible, but here are five other, more logical explanations that account for BTC’s current outperformance
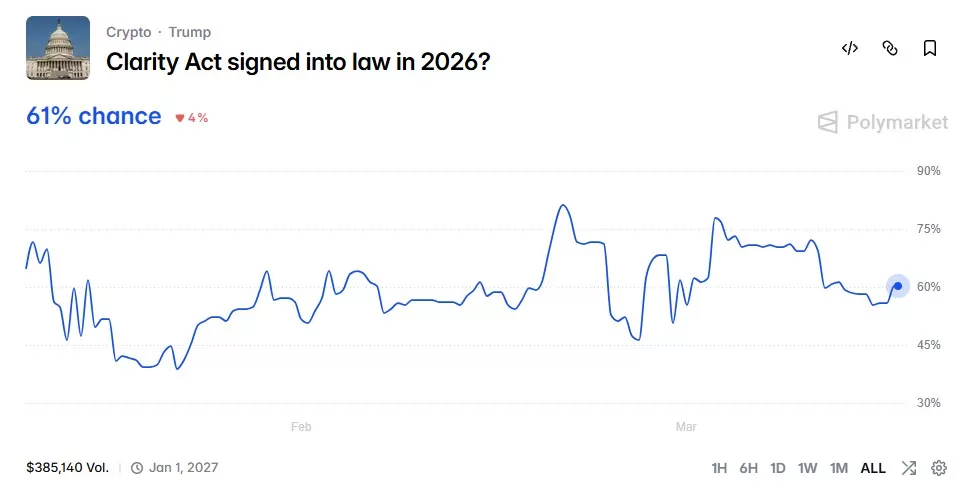
- The compromise that seems imminent (by the end of March) between banks and crypto players regarding stablecoin yields should finally allow the Clarity Act to pass in the U.S. Senate. This new U.S. crypto regulation will lay the groundwork for the next bull run;
- Before the conflict began, BTC’s drawdown from its ATH had already reached 50%, so it was significantly oversold—unlike the stock market;
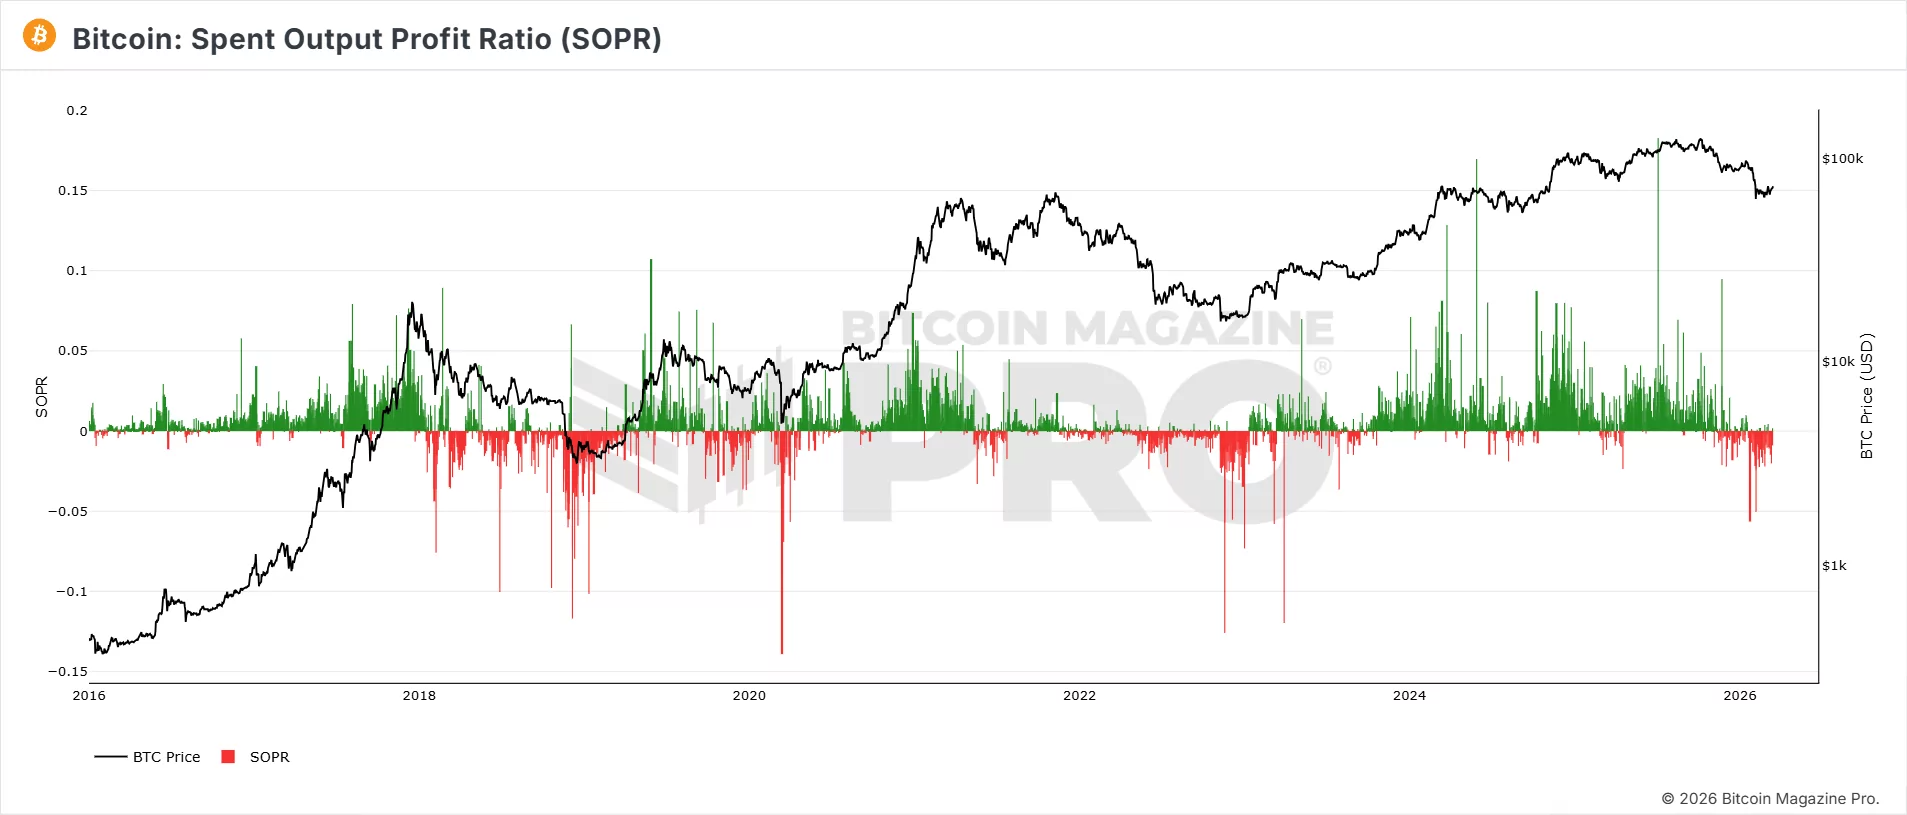
- The drop to 60,000 had triggered a phase of buyer capitulation close to historical levels typically seen at the end of a downtrend (see the SOPR);
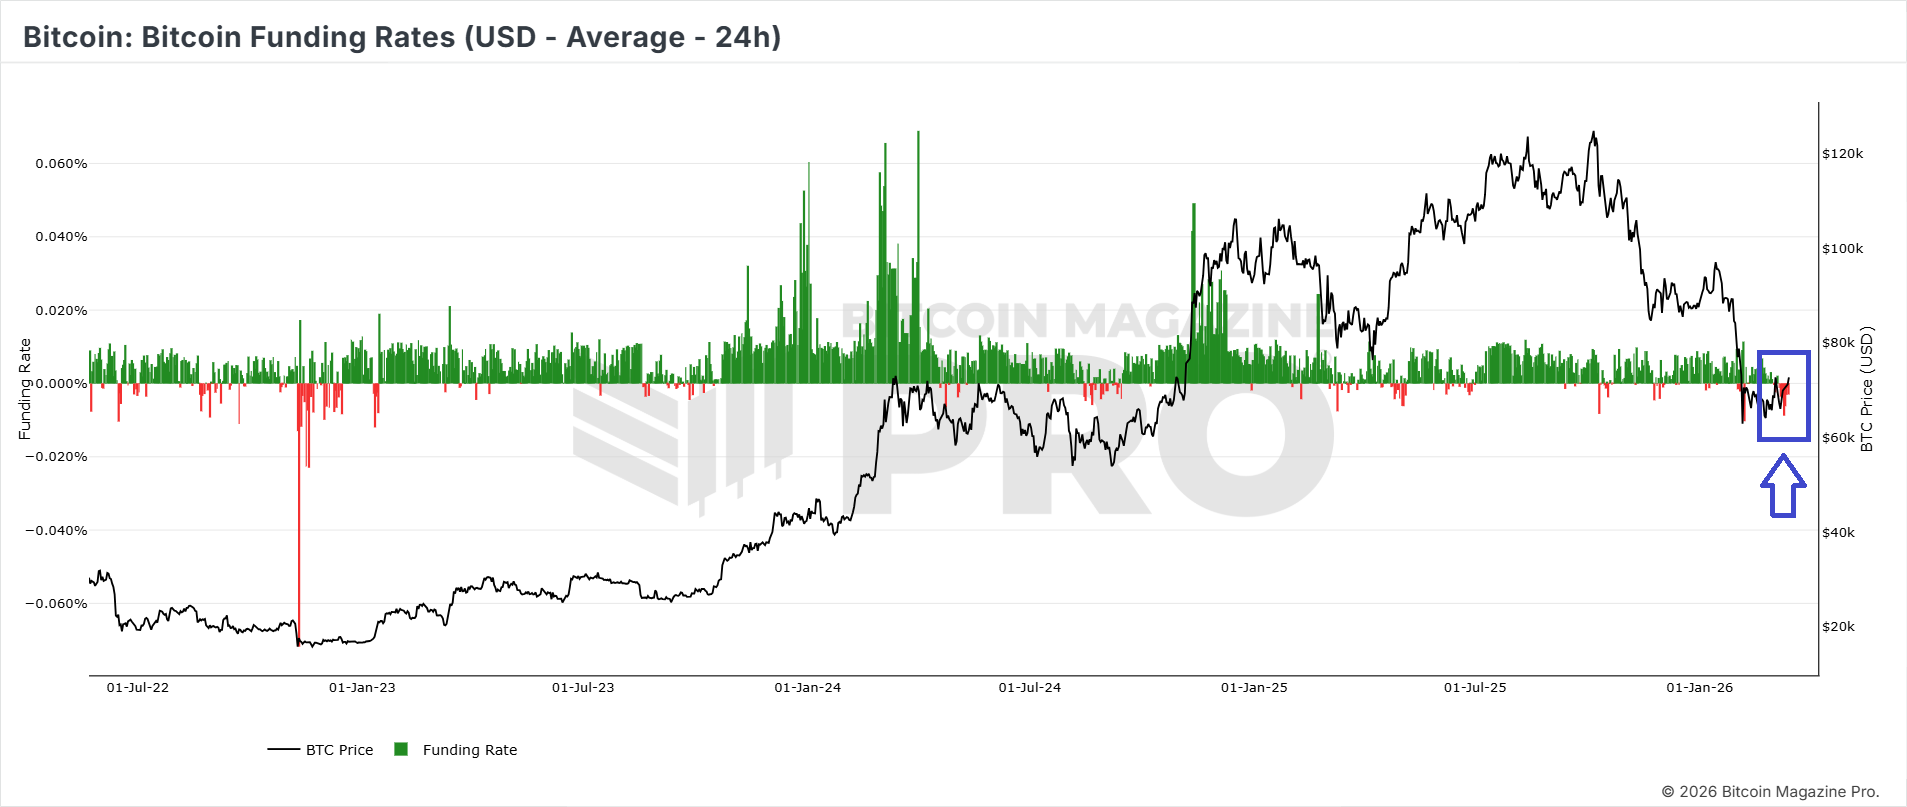
- Since the start of military operations on February 28, leveraged short positions have been largely dominant; the market often moves counter-trend to trigger the stops of the majority—in this case, the sellers’ stops;
- Finally, between 60,000 and 70,000, Bitcoin is at its average production cost per BTC; historically, this is a stabilization zone for the market
If we look at the market data, several indicators confirm this interpretation. Funding rates on perpetual contracts have been broadly neutral, or even negative, since the start of the crisis, meaning that short sellers have largely dominated speculative positioning.
In this type of scenario, even a modest price increase is often enough to trigger a series of short position liquidations, creating a “short squeeze” that automatically amplifies the price rally.
At the same time, on-chain data shows that the market has already gone through a classic capitulation phase. The SOPR (Spent Output Profit Ratio), which measures whether investors are selling their bitcoins at a profit or a loss, recently moved into negative territory.
Historically, these episodes often correspond to the final stages of a downtrend, when the last remaining weak-handed investors capitulate and sell at a loss. Once this purge is complete, the market becomes structurally stronger.
Finally, an analysis of the Bitcoin network’s production cost also provides insight. According to several models, the average cost of mining a bitcoin currently ranges between $60,000 and $70,000.
In previous cycles, the price of BTC has very often found a floor near this level, as selling sustainably below this threshold would put some miners in difficulty and gradually reduce supply in the market.
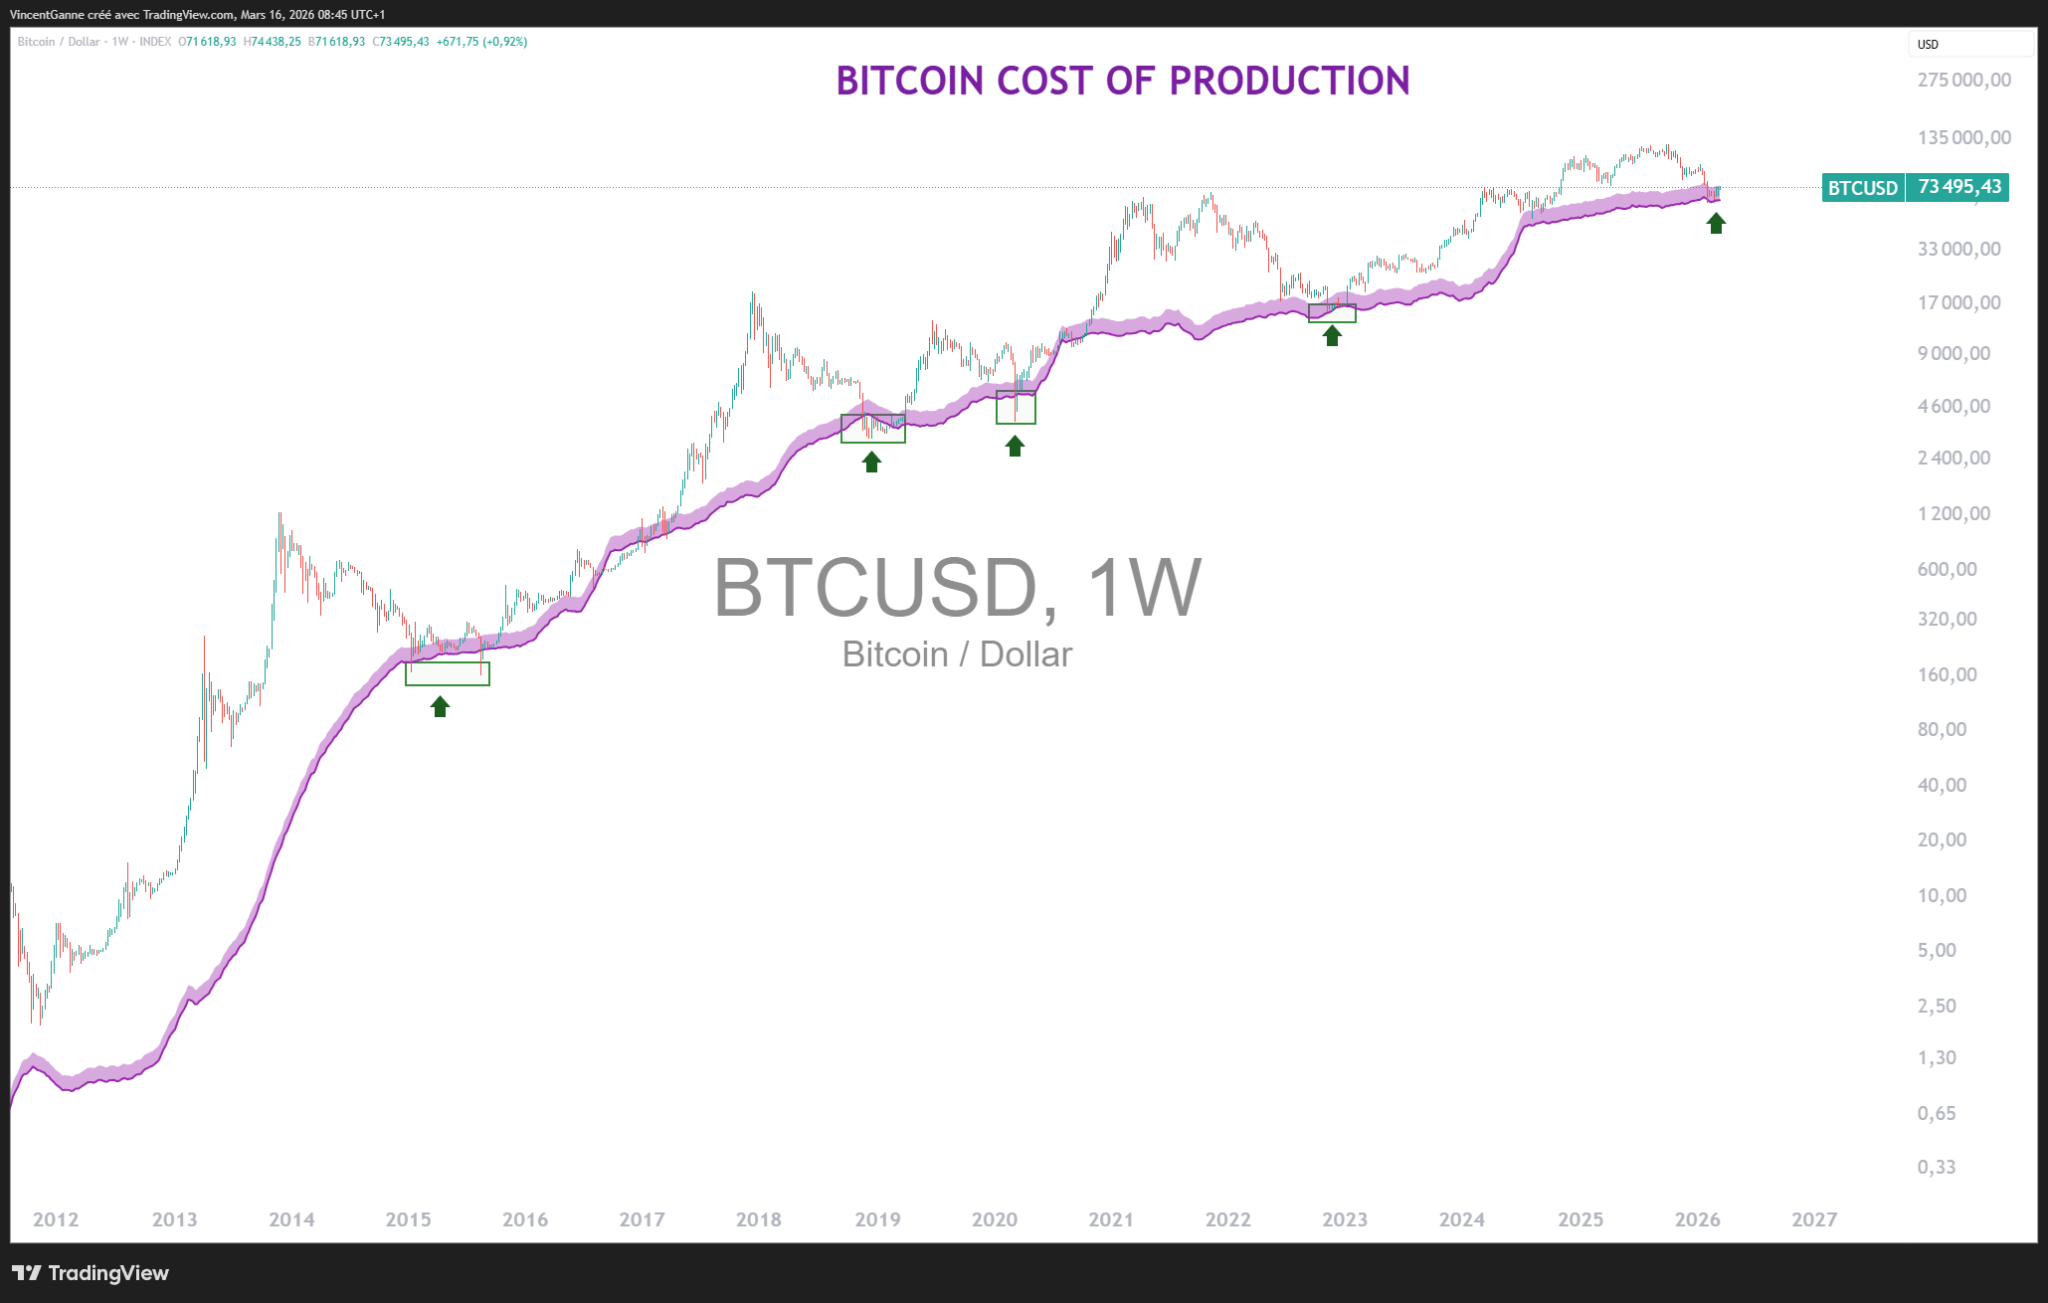
In other words, despite a highly tense geopolitical environment, Bitcoin is currently benefiting from a unique combination of factors: a market that has already been purged, excessively bearish speculative positioning, and a historically solid technical support zone. It is this combination that explains why, against all odds, BTC is managing to weather the storm for now.