
Bitcoin (BTC) remains in its range while Ether (ETH) confirms its trend change. What could be the next moves for the major crypto currencies in the market
Bitcoin (BTC) Technical Analysis
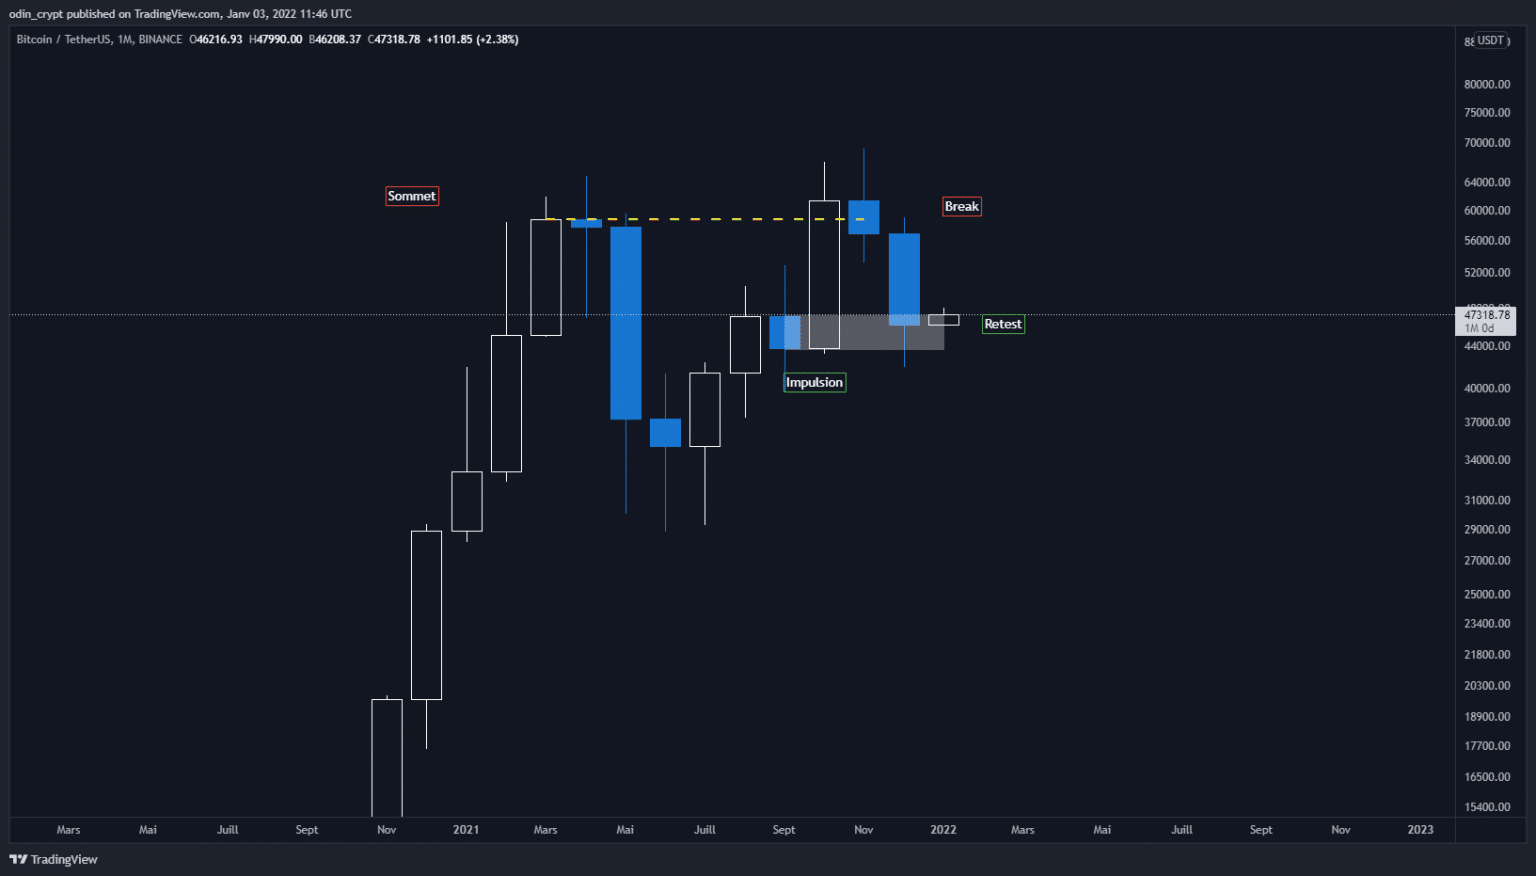
As usual, let’s start by analyzing the Bitcoin (BTC) price to open this article. We will start by looking at the monthly view. It gives us some interesting insights into what’s next.
We can observe a bullish continuation of the macro trend. Indeed, a first peak at $58,800 was formed between March and April 2020. This was followed by a correction and the establishment of a new low at $35,000. After that, the Bitcoin price stalled in the $43,000 – $47,000 area. This area served as an impetus before establishing a new high at $61,300.
Today, the price is revisiting this impulse zone. This is called the beginning of a move, and in a classic uptrend pattern it is a prime buying area. It allows the price to maintain a healthy and coherent structure.
To be clearer, the most aggressive speculators got out on this phase allowing strong hands to take their positions (or increase them).
Bitcoin (BTC) analysis in 1M
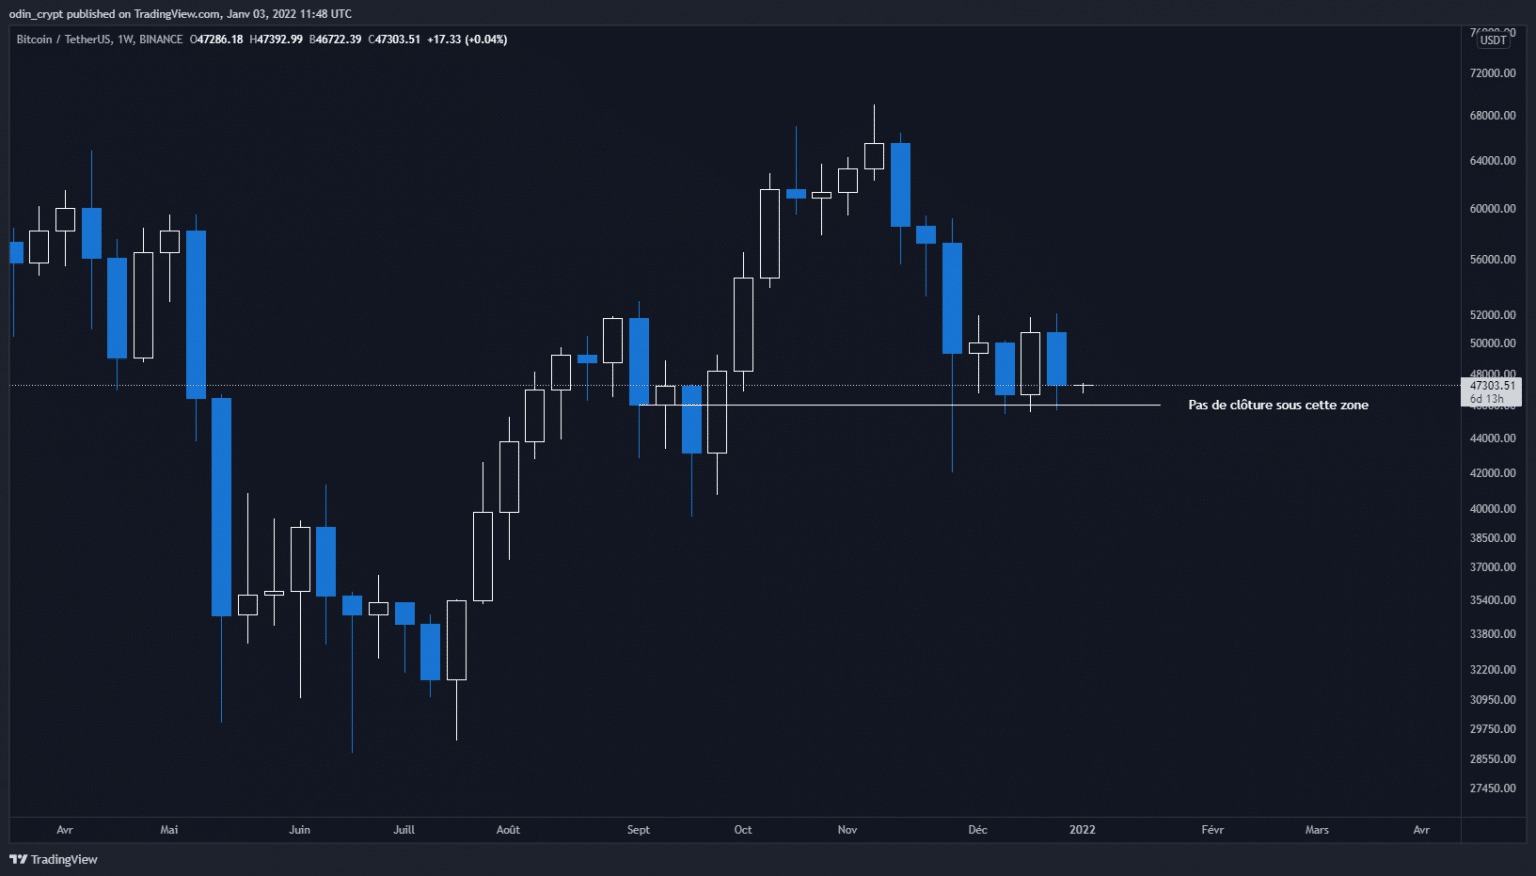
If we zoom in on the weekly view, we can see that the previously identified area is still valid. The $46,000 has still not been crossed on the downside at the close! We can therefore consider this point as a support or buy zone.
Bitcoin (BTC) analysis in 1W
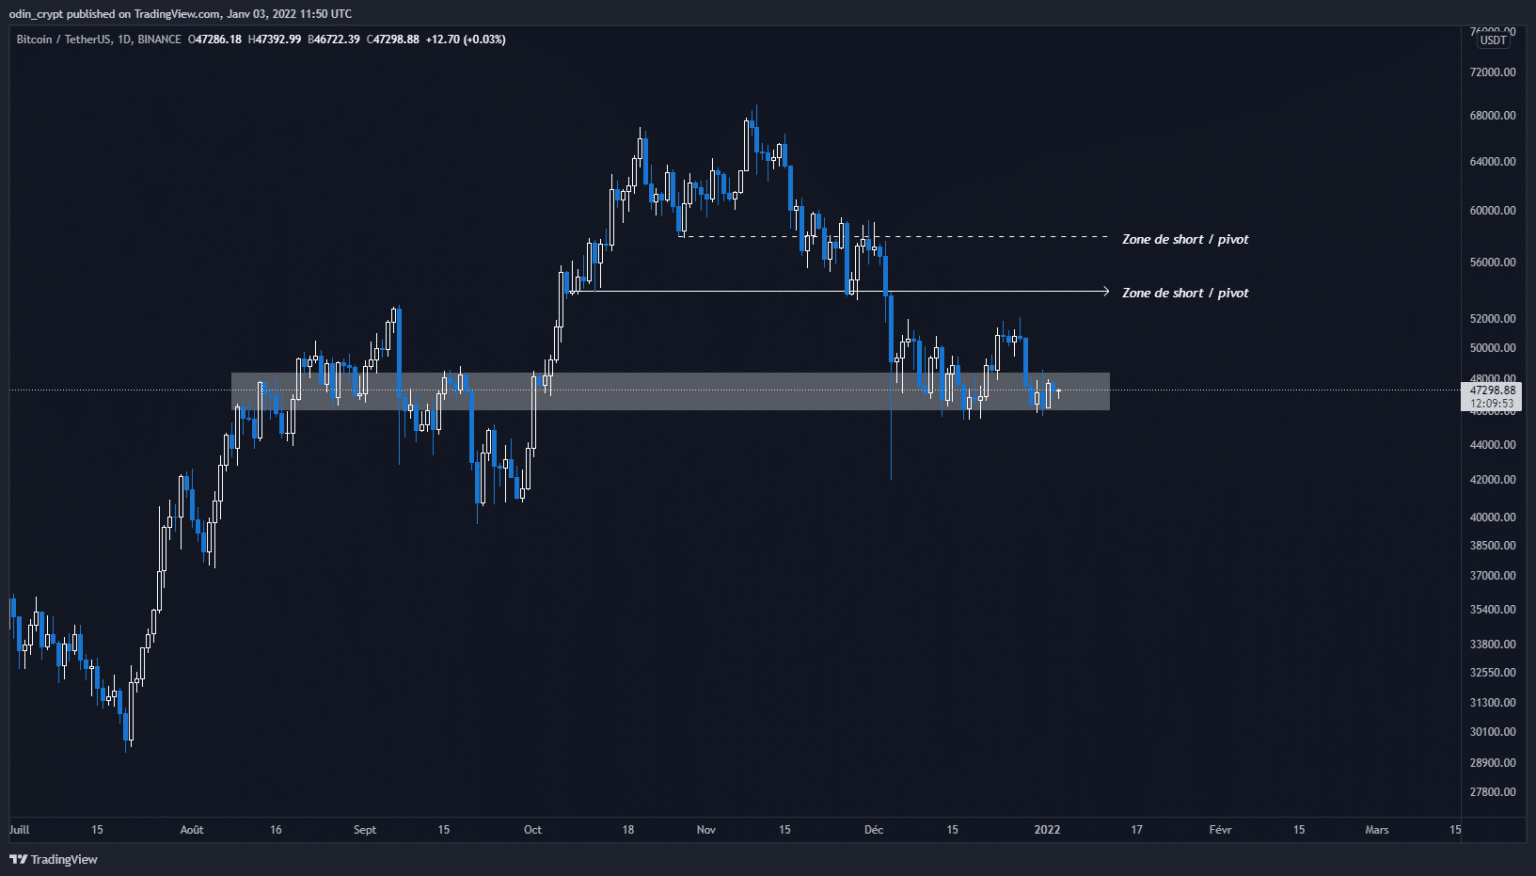
The daily view will elaborate on what we have just highlighted. The white area is a detailed view of the identified areas, highlighting the importance of the $46,000 – $48,300. As long as it is maintained, there is nothing to worry about. The macro theory of a higher than previous peak prevails.
Bitcoin (BTC) analysis in 1D
It is now more than interesting to look at the 4H view.
Why?
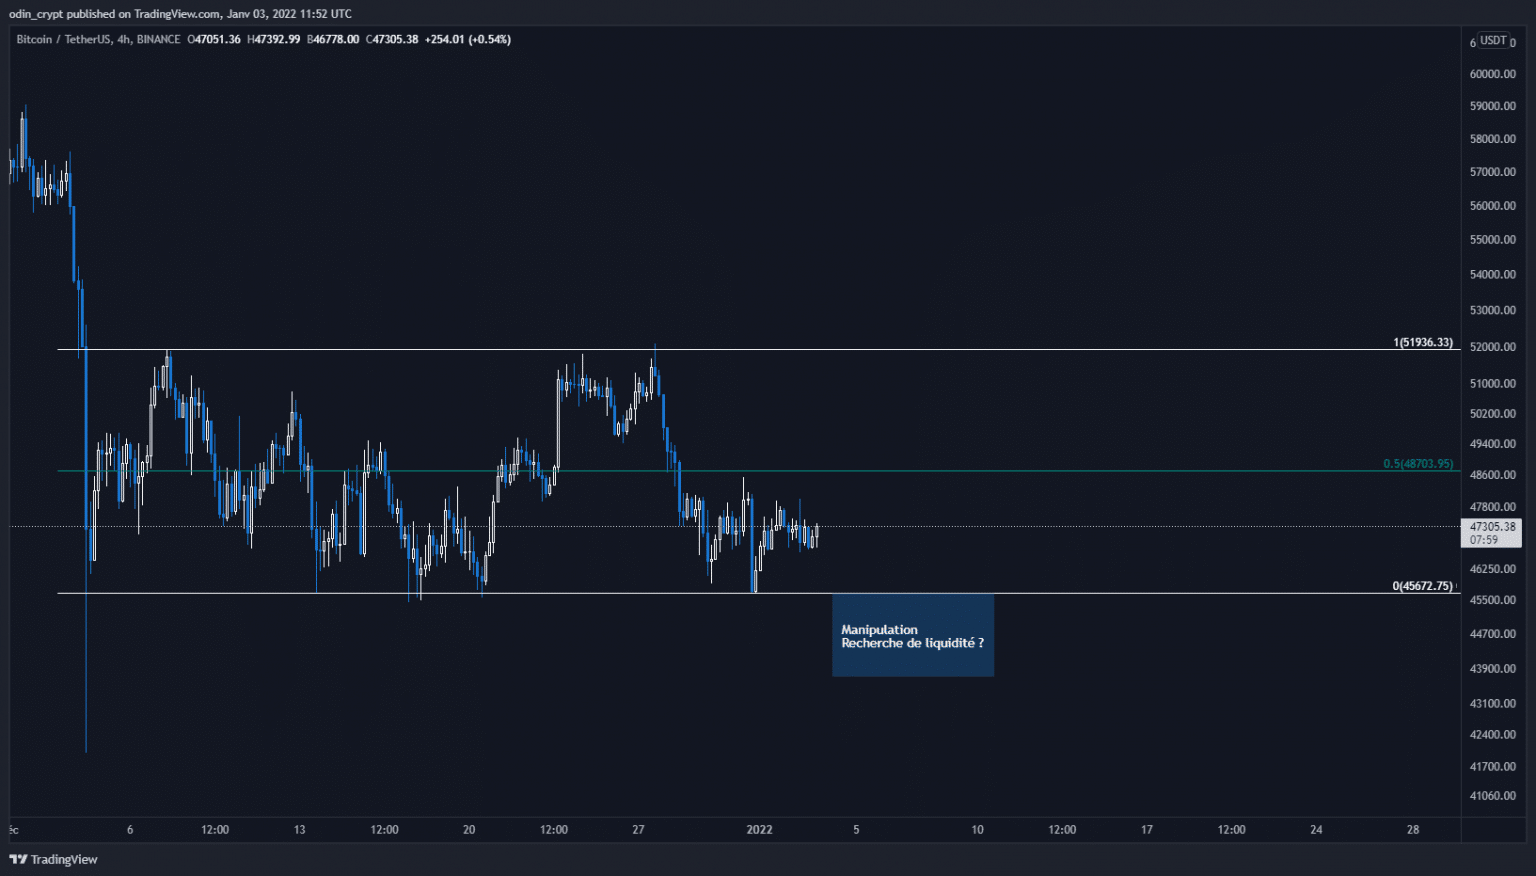
Quite simply, because it allows us to see the now very clear constitution of a lateralization phase (range). As mentioned last week, the range strategy remains valid. We buy the lower bound, to sell the upper bound.
Now that the market makers have made this range visible, they will use it to generate liquidity. To do this, they will steer the price in the opposite direction of the move they want to generate.
The technique is simple: if the next move is up, they will move the price down below the bottom of the range. This will create a snowball effect by triggering local stop-losses of weaker traders (market takers).
Thus, small portfolios will sell their positions to large portfolios before the latter buy massively, in order to change the price direction. So don’t be afraid of potential deviation, and only be alarmed if we lose the important points of the higher time units.
Bitcoin (BTC) analysis in 4H
Ether (ETH) technical analysis
On the Ether (ETH) side, the theory we mentioned last week seems to be getting clearer.
If we look at the monthly view, we can see that the price has not yet revisited its $3,420 area. The macro trend remains bullish, but the trend needs to correct its recent bullish excesses.
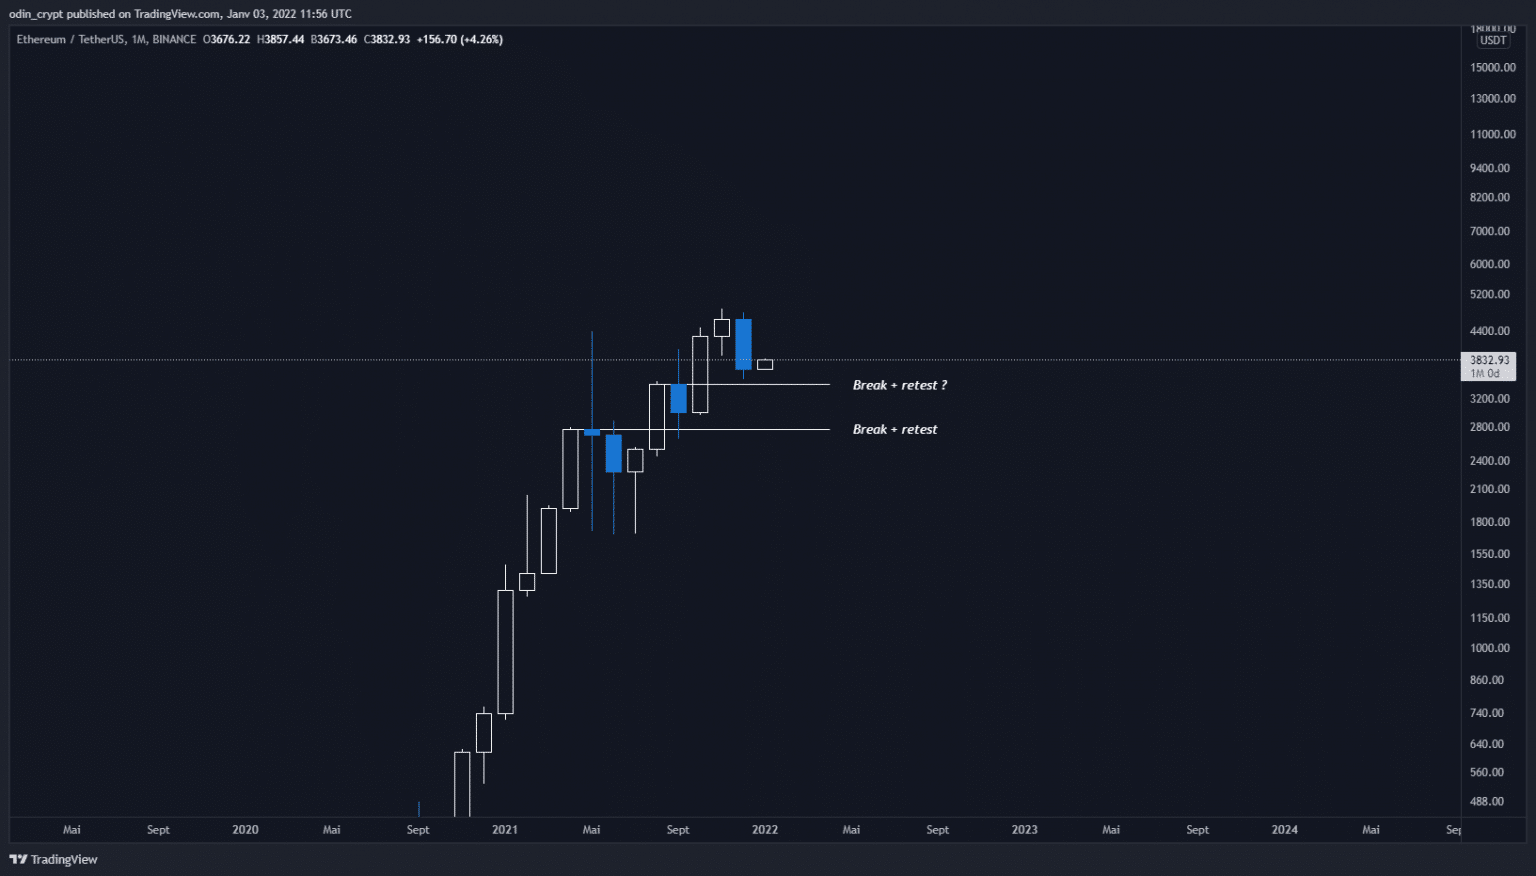
Ether (ETH) analysis in 1M
Let’s clarify a bit by zooming in on the weekly view.
The close had to be below $3,920 to maintain a strong uptrend. Otherwise, we had identified a larger retracement ahead. This is not dramatic, in the sense that the macro trend is still very much up for now.
This trend would be challenged if, and only if, the price closes below $3,000.
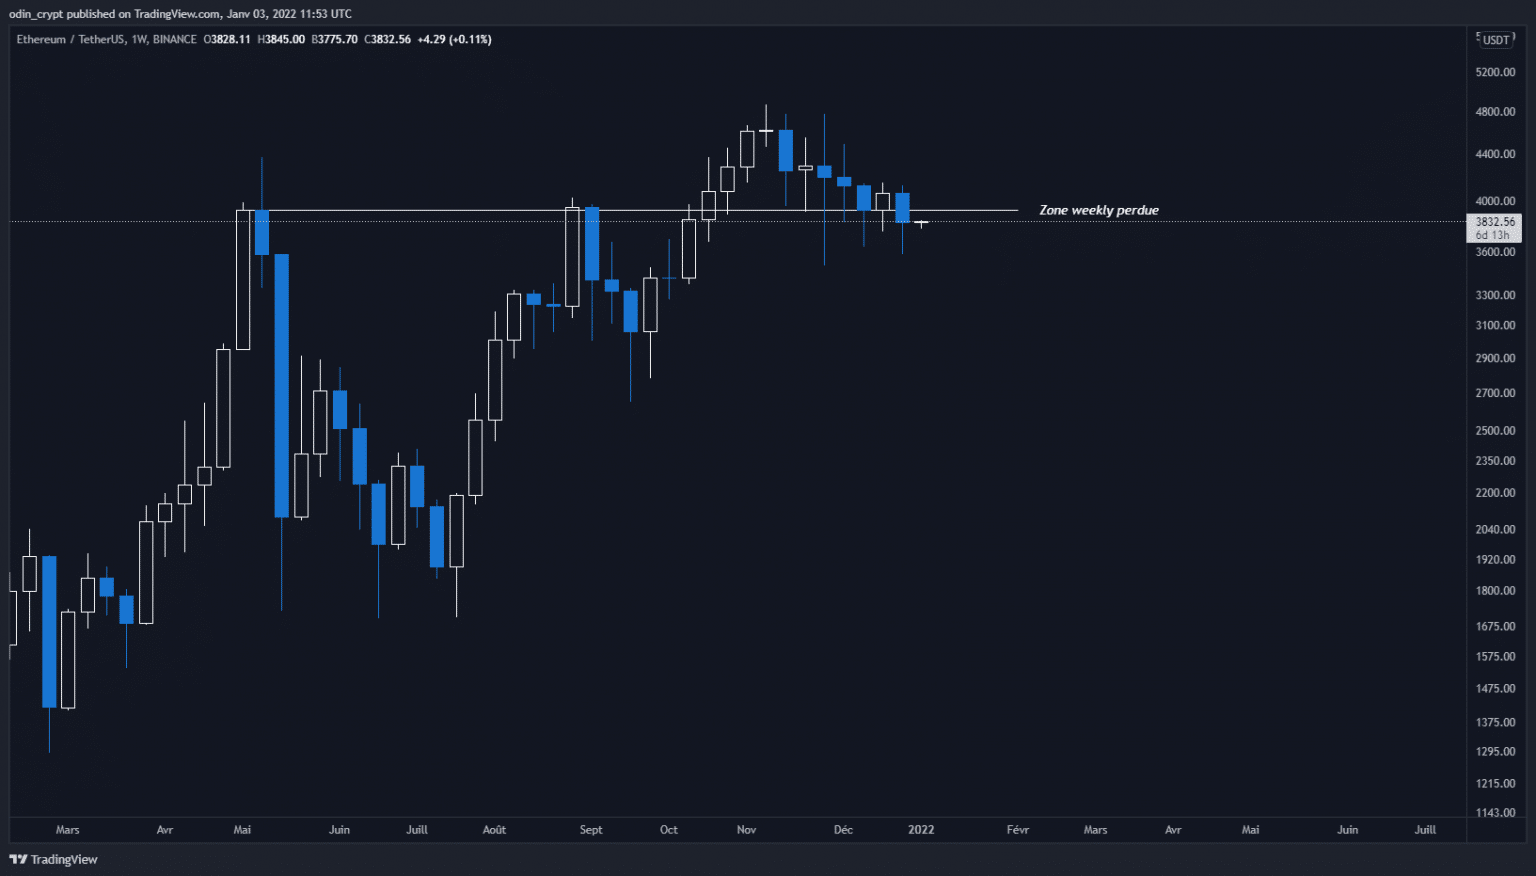
Ether (ETH) analysis in 1W
We’ll have to zoom in a bit more on the daily view to refine our observations. Last week we noted a bearish retest after losing the $3,000 – $4,000 area.
The Ether price established a new low at $3,800, creating a lower low than the previous ones, and starting a local downtrend. We note that this low has a new low on the $3,620 level. We are in the same configuration as last week, with a potential bearish retest.
What seems most logical to me at the moment is a rejection on the $3,820, to resume the downward path. The $3,400 – $3,100 area will be revisited and the price will take advantage of this to make its bullish impulse in this area.
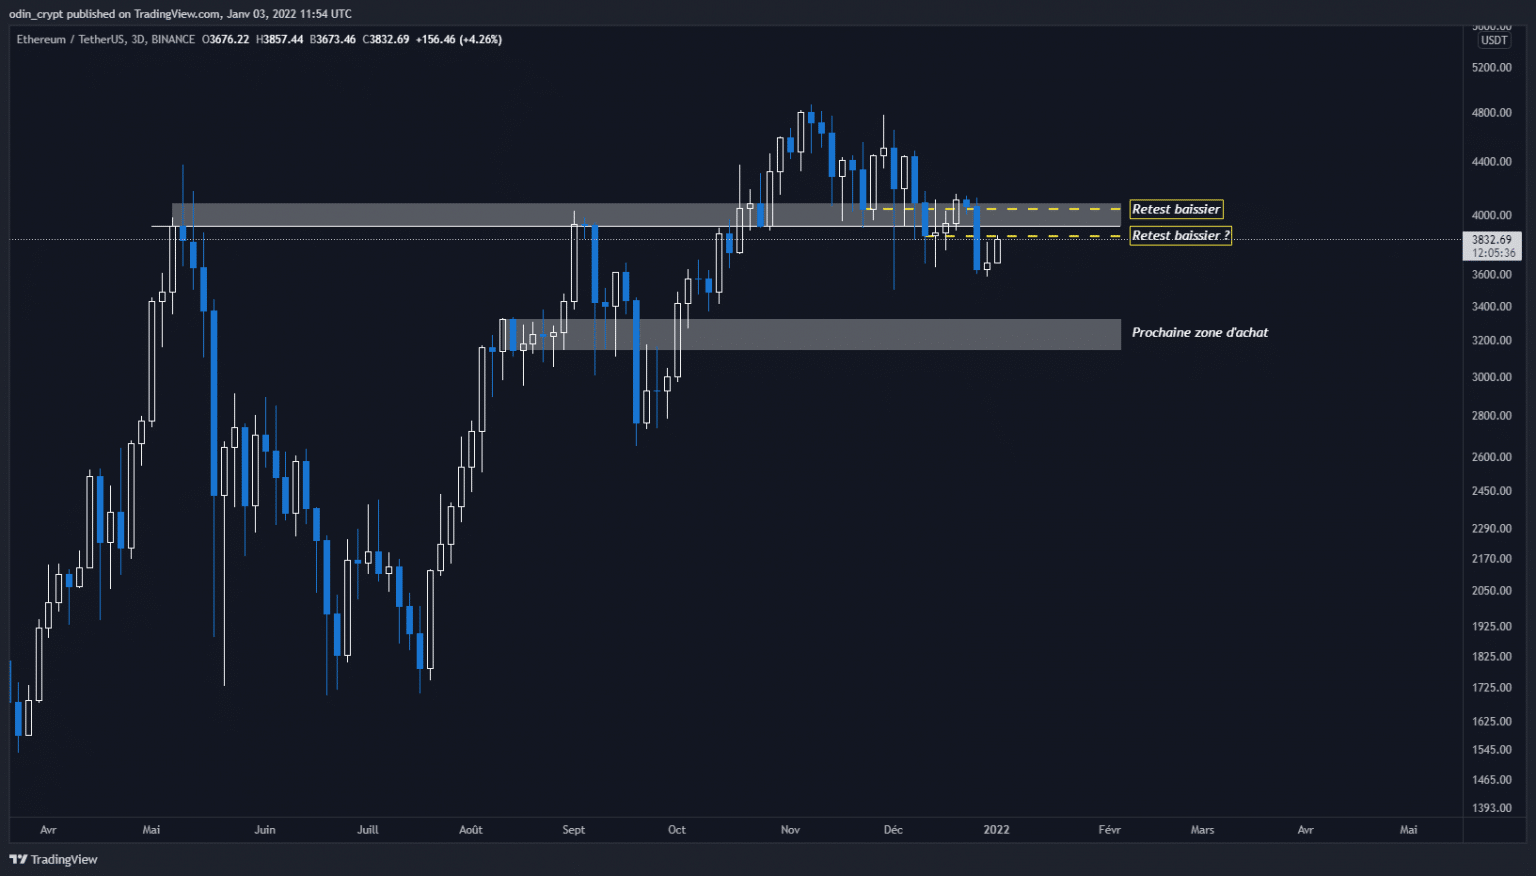
Ether (ETH) 3D analysis
In conclusion
It’s been a quiet week in the crypto-currency market. Bitcoin (BTC) is back to the bottom of its range established since December 4. We’ll have to be a bit more patient to see the next move, which looks like it will be bullish. We will probably see a bearish manipulation phase to get the last speculators out.
On the Ether (ETH) side, the price is well into a local downtrend. The preferred buying area is still $3,100 – $3,400. The macro trend remains bullish, however, and bullish retests should be taken as low-risk buying opportunities.
I would like to take this opportunity to wish you all my best wishes for the year 2022! It was cryptOdin to serve you.