
This week, Bitcoin (BTC) and Ethereum (ETH) have soared. But will this rebound last or is the correction near? Check out the targets to watch for the major cryptocurrencies.
BTC is still potentially moving in a Bear Flag on a daily basis
Despite a significant rise over the past few days, Bitcoin remains under resistance. Its price remains below the flat SSB (top of the cloud), as well as below the upper trendline of its ascending range
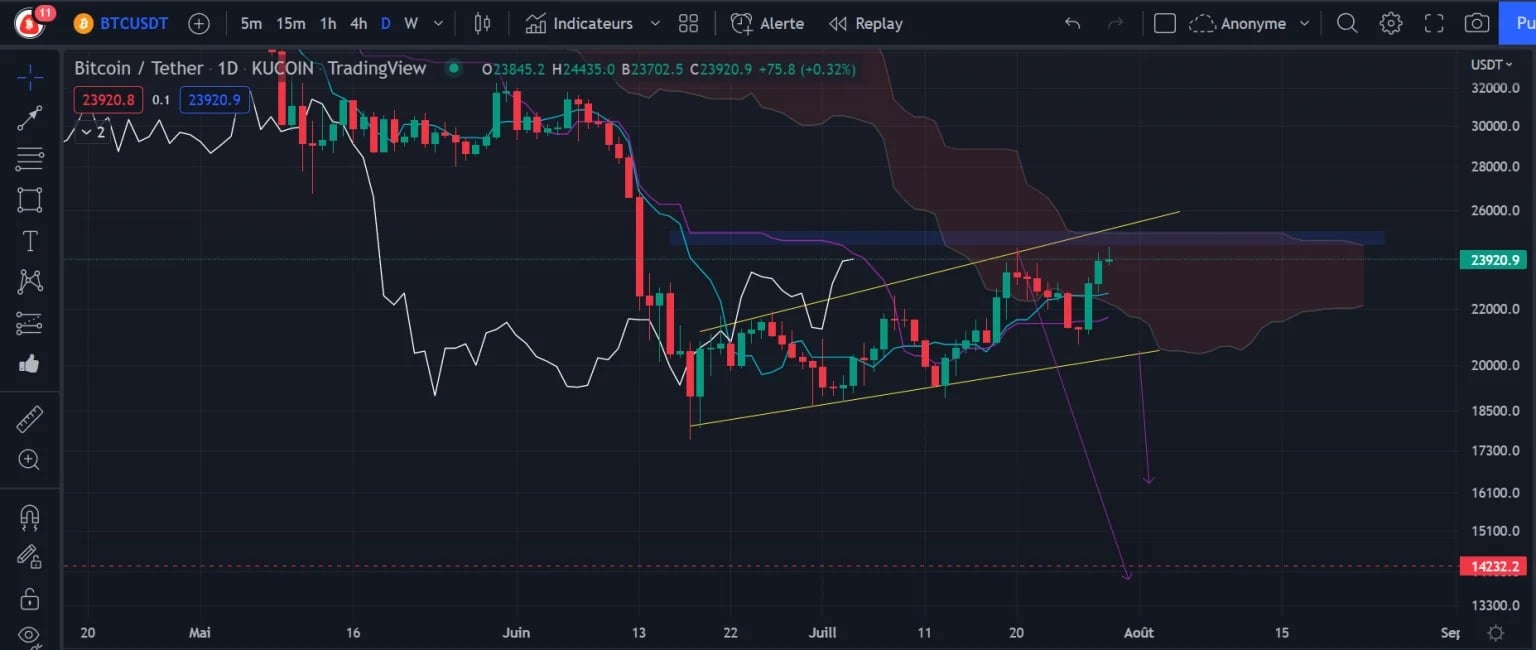
Figure 2: Bitcoin Daily Price Chart
To become truly bullish again in the short term, we will have to break back above the Daily cloud at $25,200 and then confirm this level as support. In the meantime, we remain in a potential Bear Flag with a target around $14,232 if the price were to break support at $20,500.
So, are we going to invalidate this bearish pattern or is this the beginning of a Bull Trap?
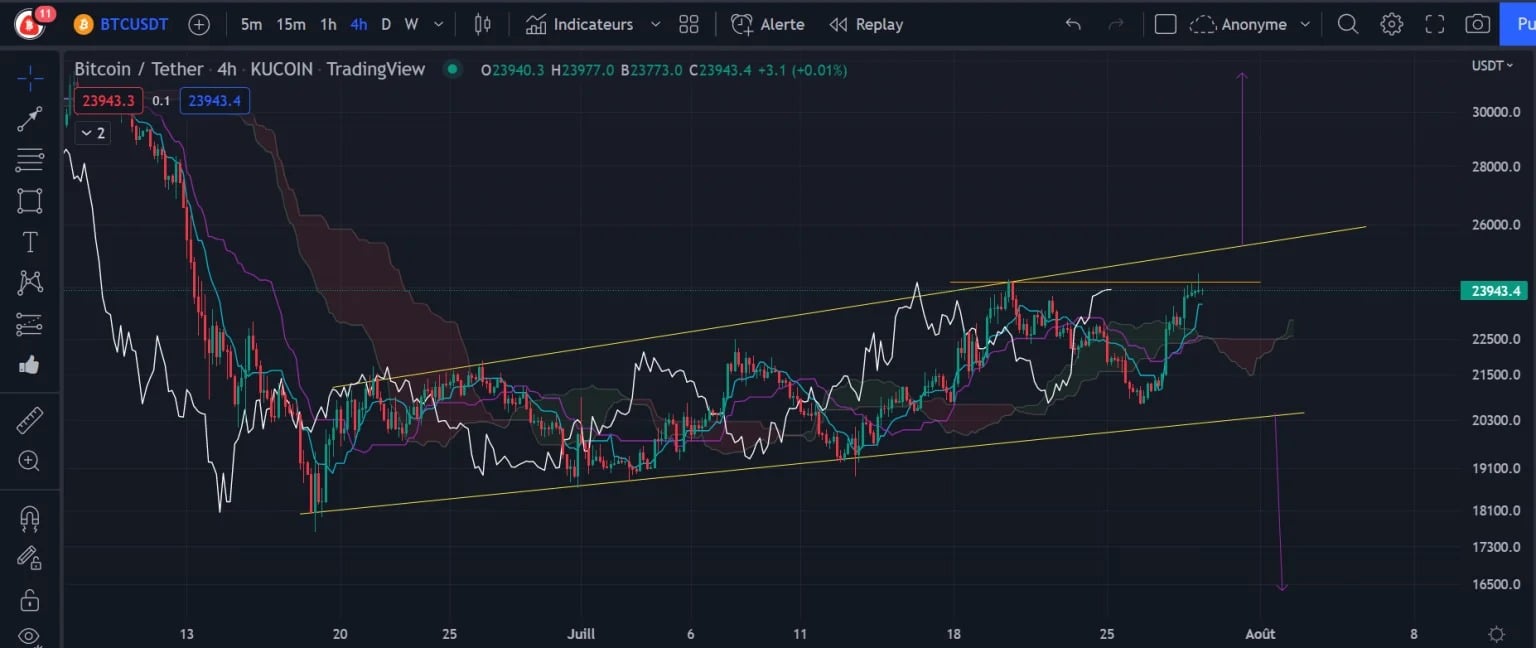
Figure 1: Bitcoin price chart h4
The breakout of the h4 pattern will set the tone for the next few days. If we break through it from the top, then the rise could continue up to about $31,000 (height of the pattern at its exit, carried over to the breakout point). This target would correspond to a return to the Kijun Weekly level.
Conversely, in the event of a break below $20,500, there is a strong probability that the price will return to around $16,600, which would also activate the daily Bear Flag target at $14,232.
Join our group composed of Vincent Ganne and our fundamental and onchain analysis experts on the Pain Grid. Our experts deliver daily exclusive information and analysis on the crypto market to optimize your knowledge!
Ethereum (ETH) is testing its resistance
With regards to the Ethereum (ETH) price, it finally hit our target at $1,726 which was activated in our previous analysis. So what are the next scenarios to watch out for
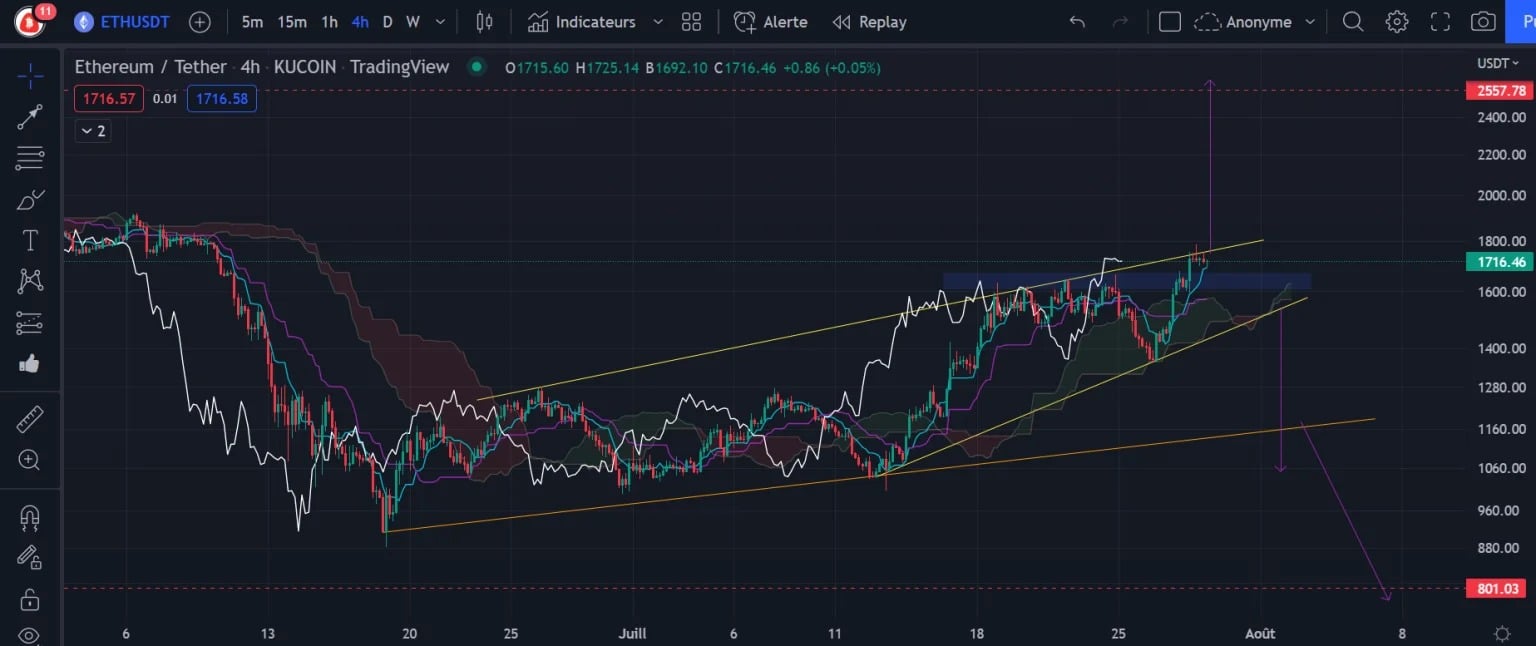
Figure 3: Ether price chart (h4)
While the price has managed to break out to the upside, it will be important to remain vigilant below this resistance at $1,800 as the ETH is now in an Ascending Bevel. This type of pattern more often breaks from below, so it is necessary to wait for the pattern to break before taking a position.
We would be in a profit taking zone here, with a potential return to around $1,200 (orange trendline). And this time, the risk would be to break through this support, with the price falling towards $800.
In the event that the price breaks through its resistance, then we could target a return to around $2,557. The break of the pattern and potential resistance is therefore something to watch out for.
In conclusion
Bitcoin and Ethereum are under resistance and we are rather in a profit-taking zone following a nice price surge. We now have to wait for breakouts to be confirmed, to know the direction the cryptos will take in the coming days.