
Bitcoin (BTC) and Ether (ETH) prices have bounced off their support areas, but the support areas are still compressing. How to approach this phase
Technical analysis of Bitcoin (BTC)
Last week, we were talking about increasing price compression, with a potential powerful move. A week later, the situation remains much the same.
What exactly is the situation? We take stock together.
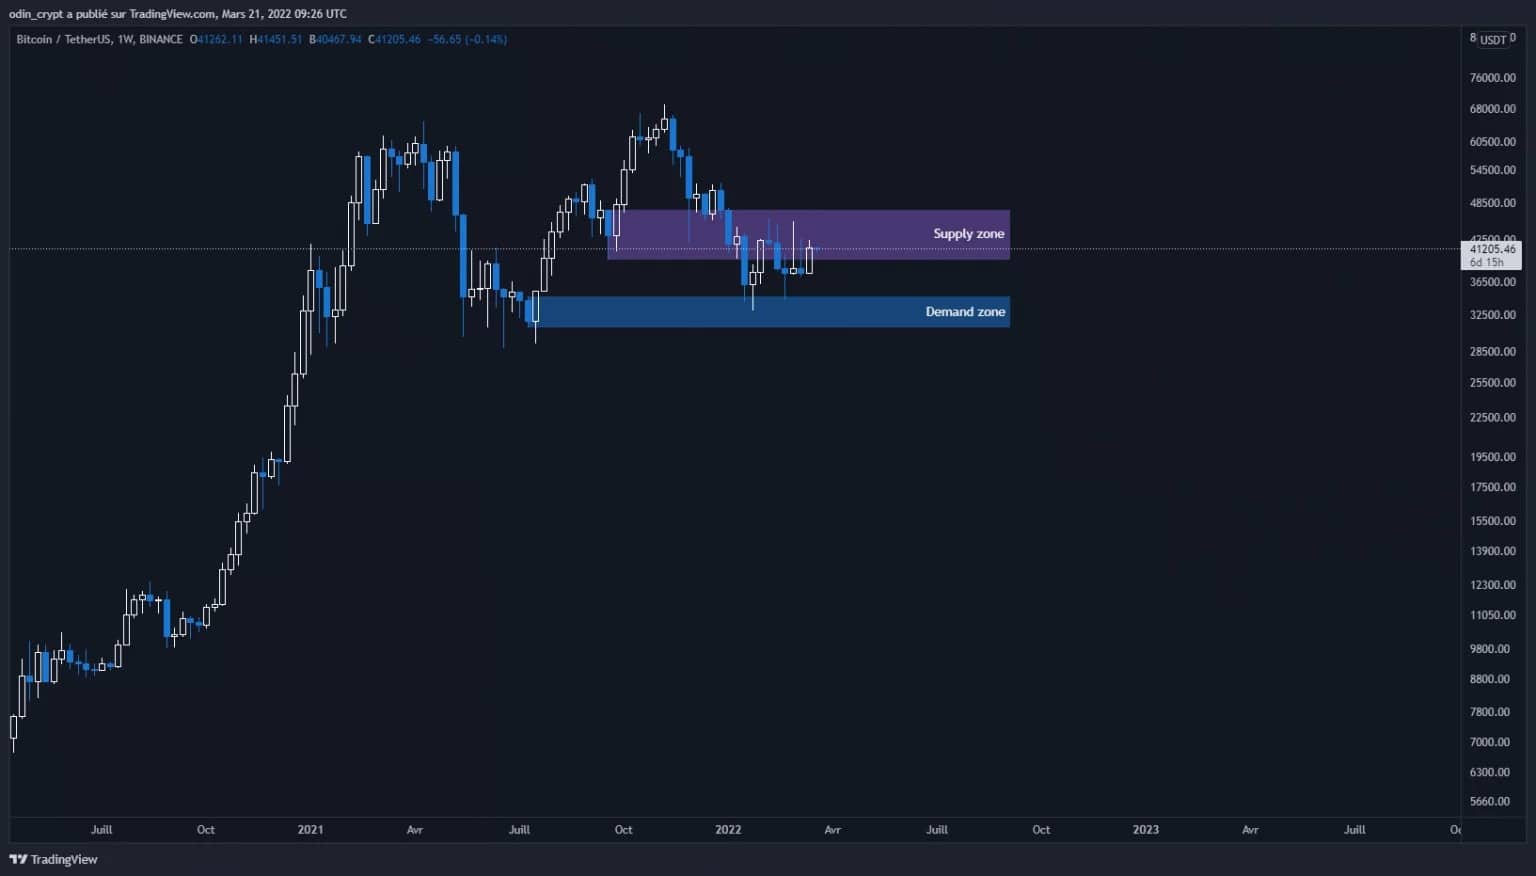
On the weekly view, the Bitcoin (BTC) price has indeed taken support from the demand zone as we had identified to return to our sell zone (supply). Between these two boundaries, a neutral (range) scenario prevails.
In this configuration, we cannot attest to a bullish recovery on this time unit. A weekly close above $43,000 would indicate a bullish recovery, and conversely a close below $31,500 would indicate a continuation of the bearish trend.
Bitcoin (BTC) analysis in 1W
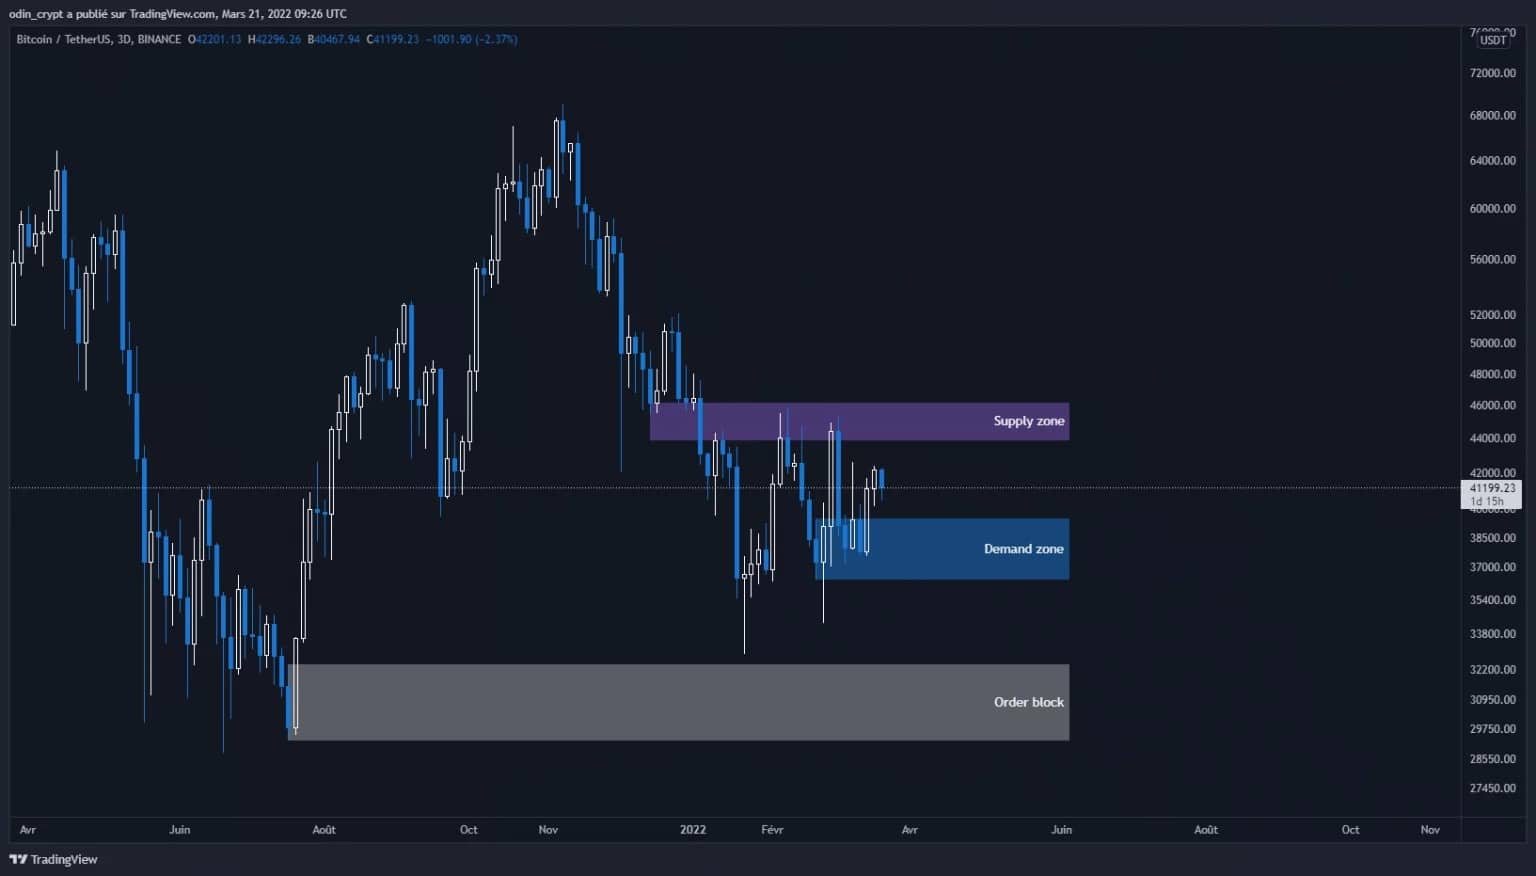
Now let’s look at the daily view (3 day grouping). Again, the price has once again gained momentum on the demand zone at $36,500 – $39,500. The sell zone at $44,000 – $46,000 has not yet been tested.
In this view too the price is in a neutral phase, moving erratically between these two bounds.
The scenario buyers want to see is a recovery from $46,000 with a bullish bounce on the latter to validate the structure. On the other hand, sellers want to validate a break of $36,500 with a bounce to validate the bearish continuation.
Bitcoin (BTC) 3D analysis
This neutral situation is clearly visible on the 4h view, with an ever increasing compression of volatility between the two buying and selling bounds. The price seems to be heading for its upper bound, with a perfectly identifiable local bullish structure (higher lows and highs than the previous ones).
Bitcoin (BTC) analysis in 4H
Ether (ETH) technical analysis
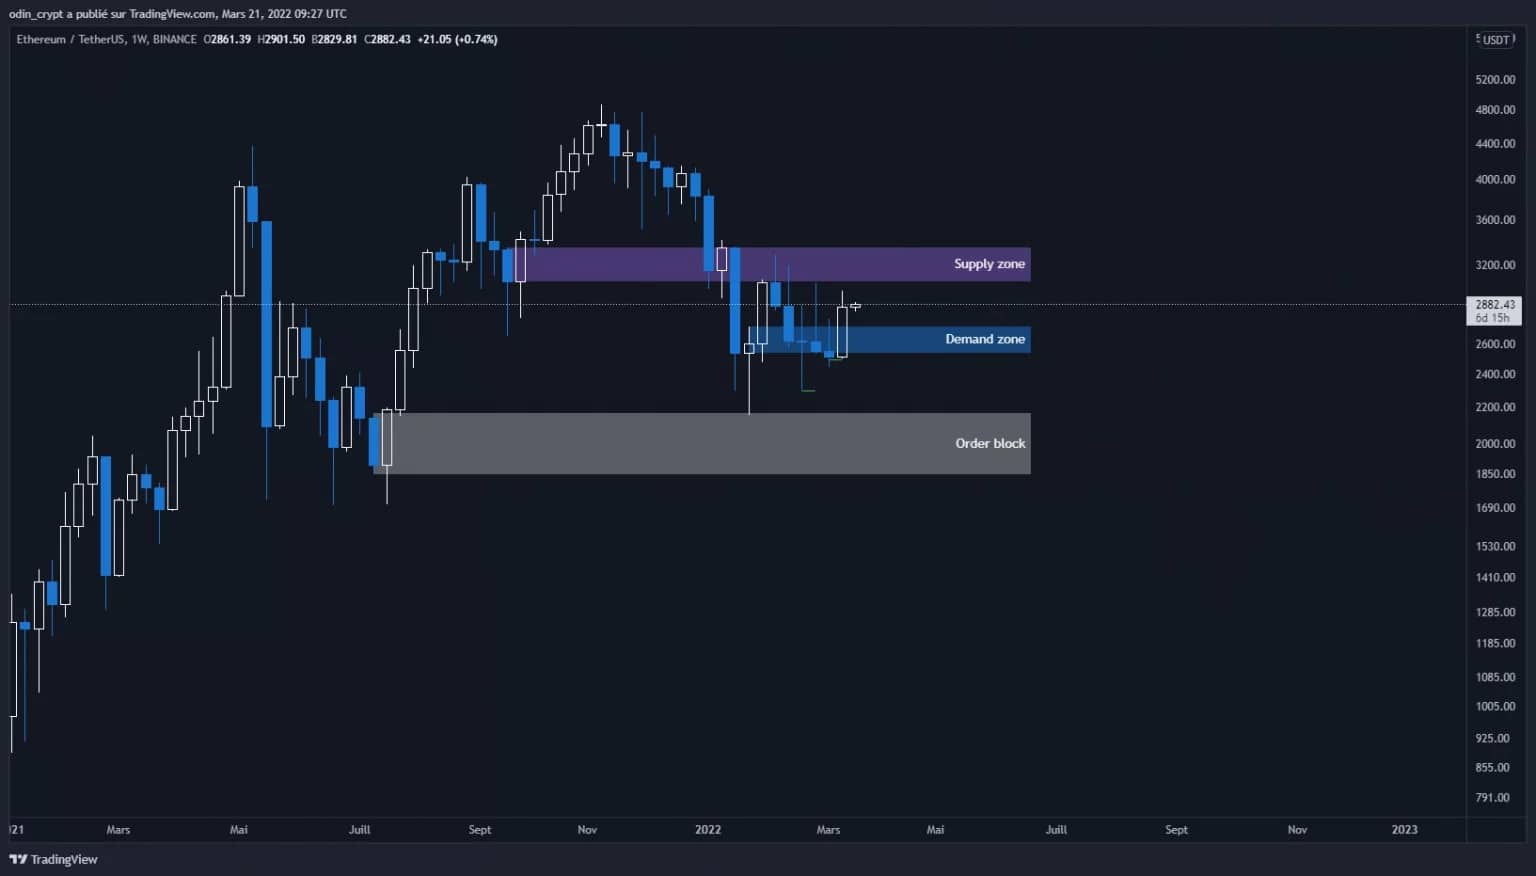
The price of Ether (ETH) is making a similar development. Indeed, the price is also stuck between its two buying and selling boundaries on the weekly view. The $2,500 – $2,750 level has played its role as a support, and the price seems to be heading towards the $3,000 – $3,300 selling zone. Continued volatility, like Bitcoin, is a sign of disinterest for many and a source of opportunity.
Ether (ETH) analysis in 1W
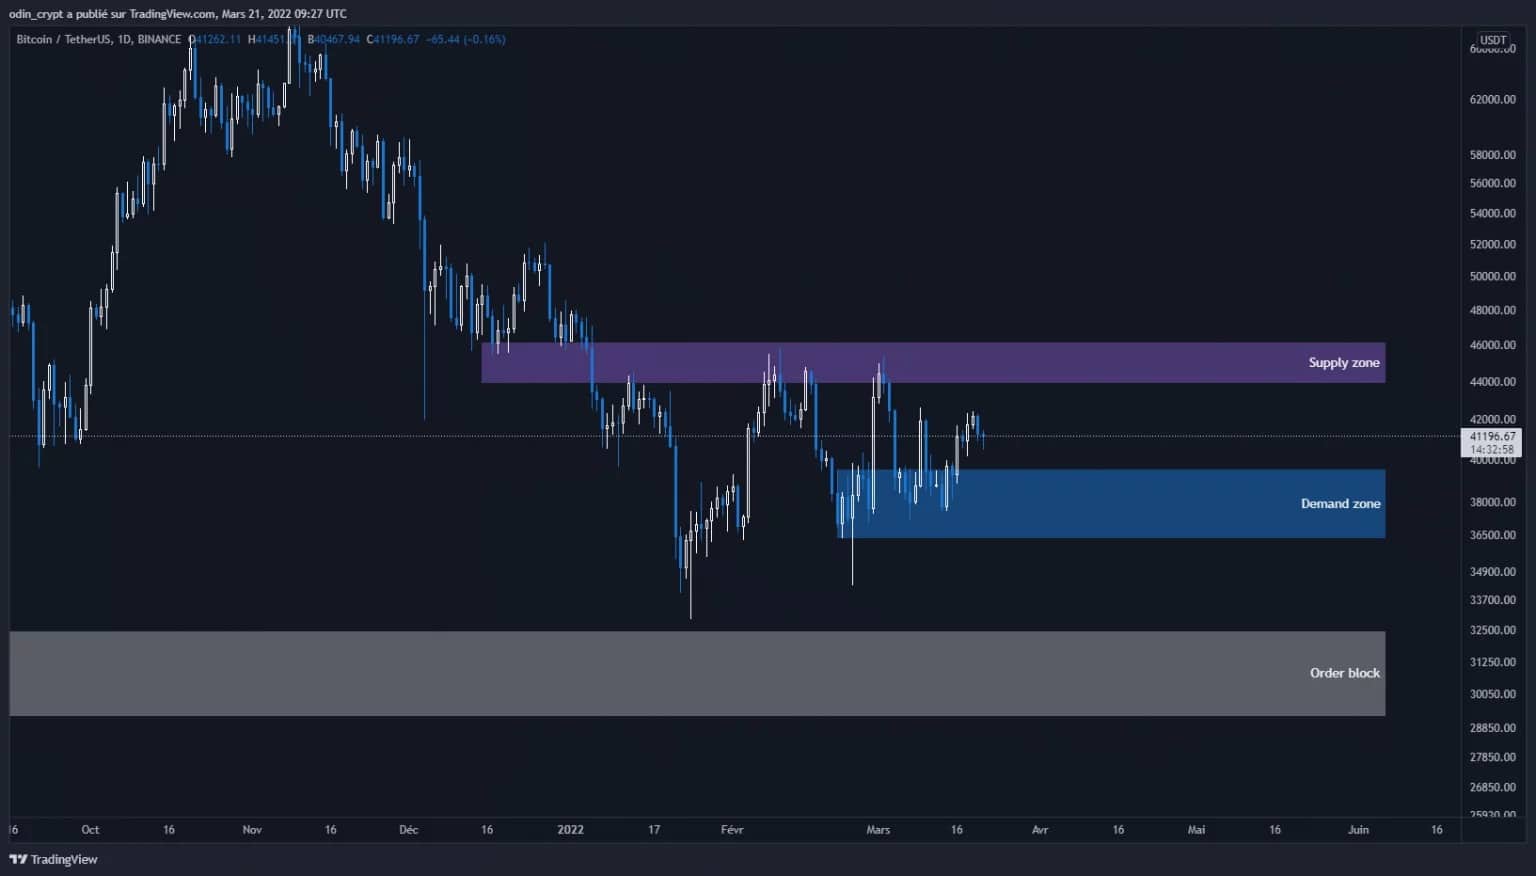
The daily view will give us more precision on the price evolution. The two zones previously identified remain valid, and we can see that the price is in an accumulation phase.
The information on this time unit shows us that the price of Ether has still not recovered from its last high of around $3,000. Yesterday’s close seems to be approaching it, but we’ll have to wait for a clear rejection, or breakout, before we can decide what to do next.
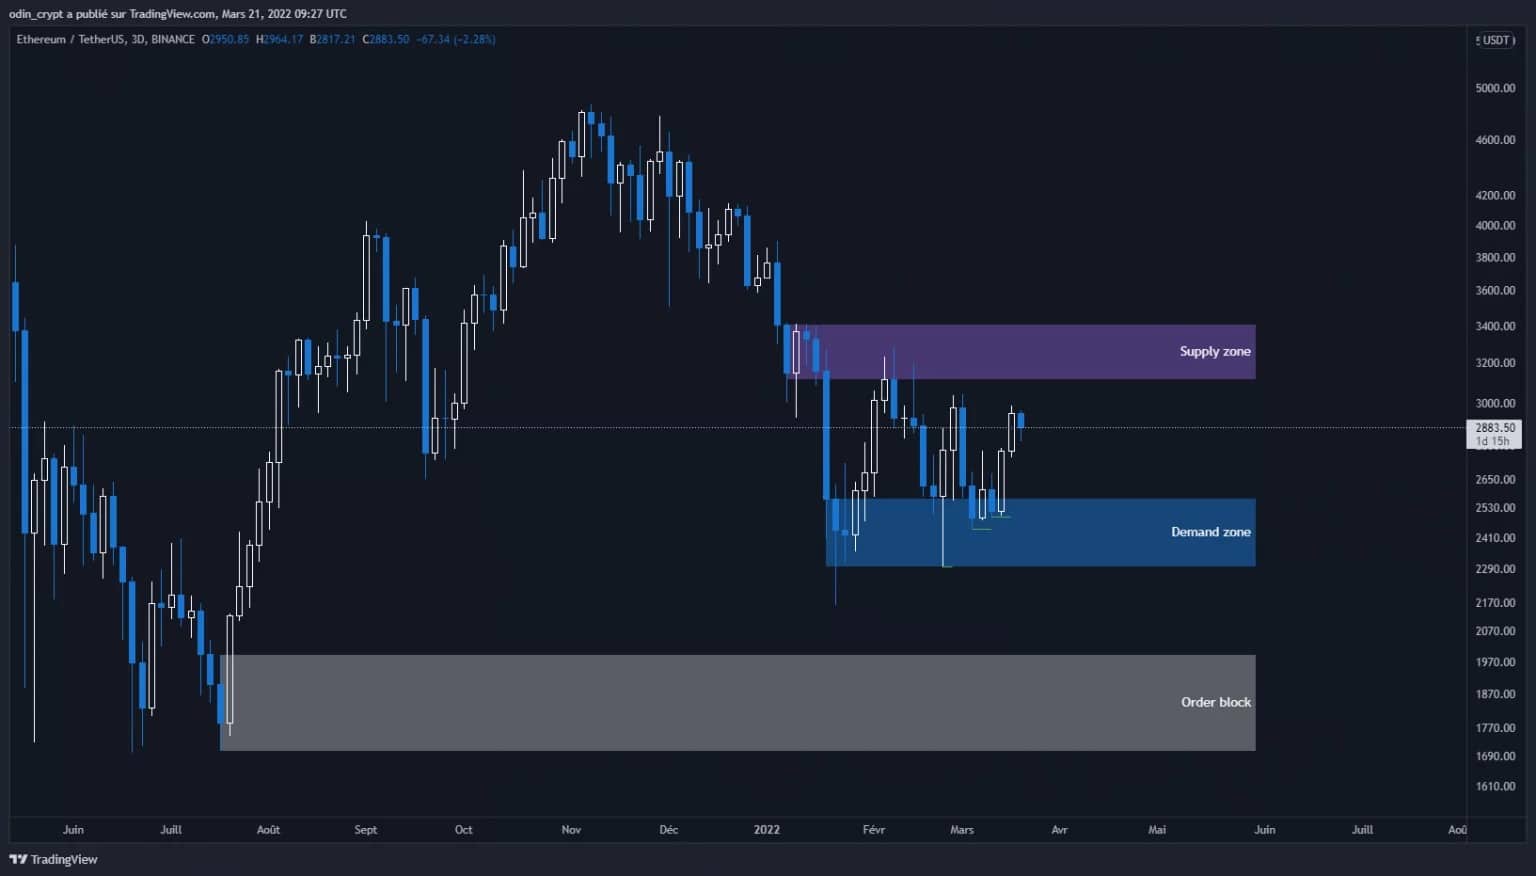
Ether (ETH) 3D analysis
On the 4h view, we can see this local trend pushing the price towards the last high. This gives us 2 easily identifiable points:
- A break of $3,050 on the 4h view would be an important first signal for the rise;
- A loss of $2,500 on the 4h view would be an important signal for further downside.
We’ll have to wait for confirmation as investors to buy, and for speculators like me, this offers opportunities for a one-day plan.
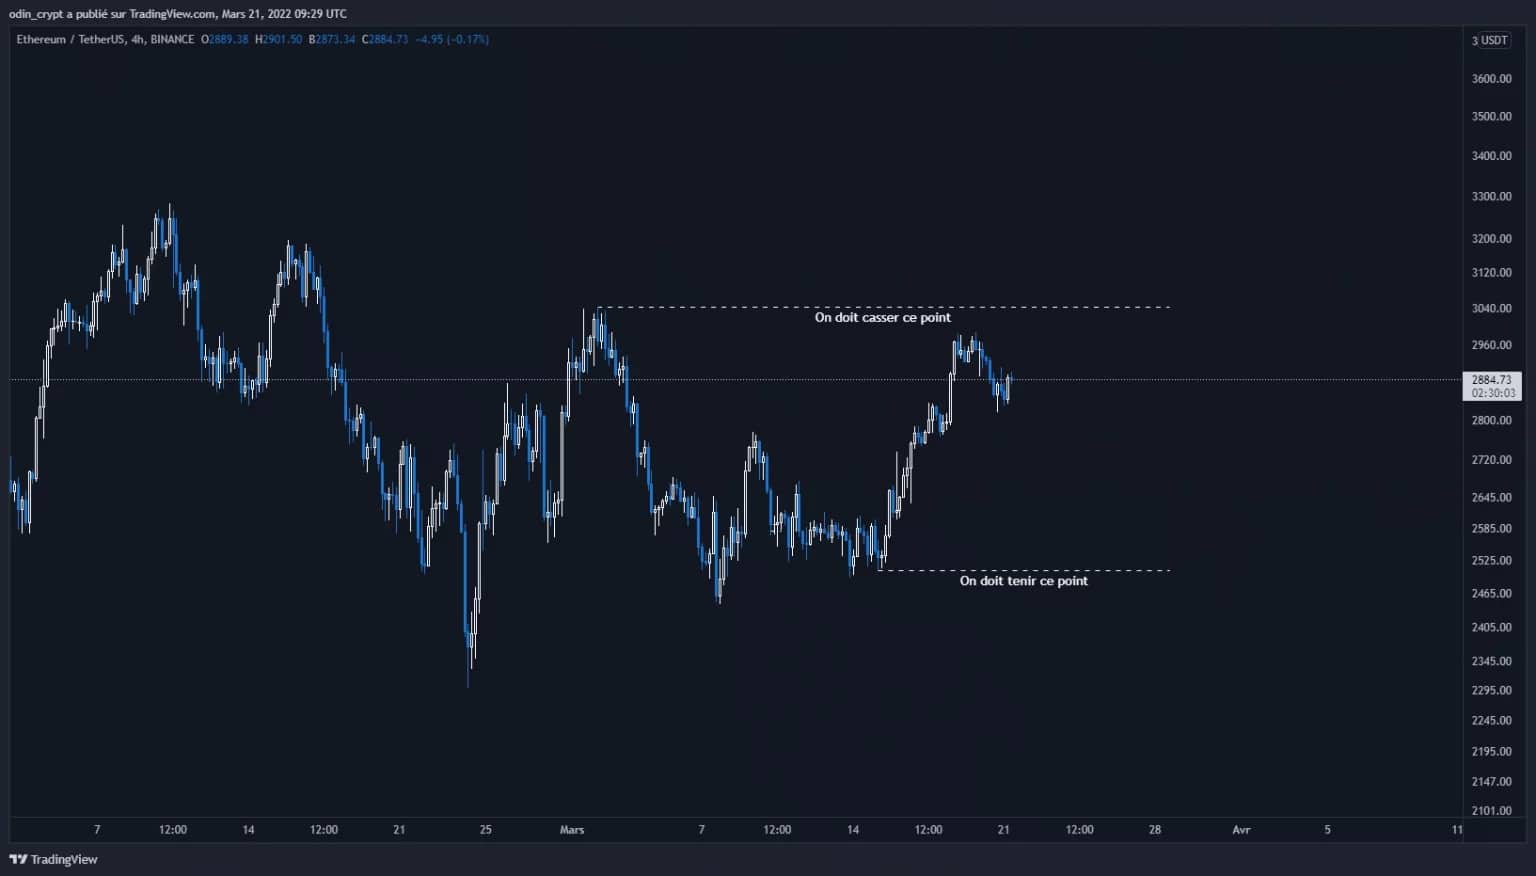
Ether (ETH) analysis in 4 hours
Cardano Technical Analysis (CTA)
Let’s review our analysis from February 14th. Indeed, I mentioned a scenario of bearish retracement for the price of Cardano (ADA), after a rise of 4000%.
As stated in that analysis, the $1,052 area did not support the price. A deeper retracement scenario is now underway.
The presence of a liquidity zone (imbalance) and a block of orders on the entire rise indicates that there is a very high probability of returning to this zone.
However, the long-term structure of the Cardano (ADA) will remain bullish. The first area of interest that I identify for buying is at $0.3 – $0.36. There are other lower areas that will act as pivot points, but I think the price will first bounce to $0.3 before resuming the downward path.
If you want to build a long term position, I suggest you use the different buying zones to build your position. This will smooth out your entry price and reduce your exposure to volatility.
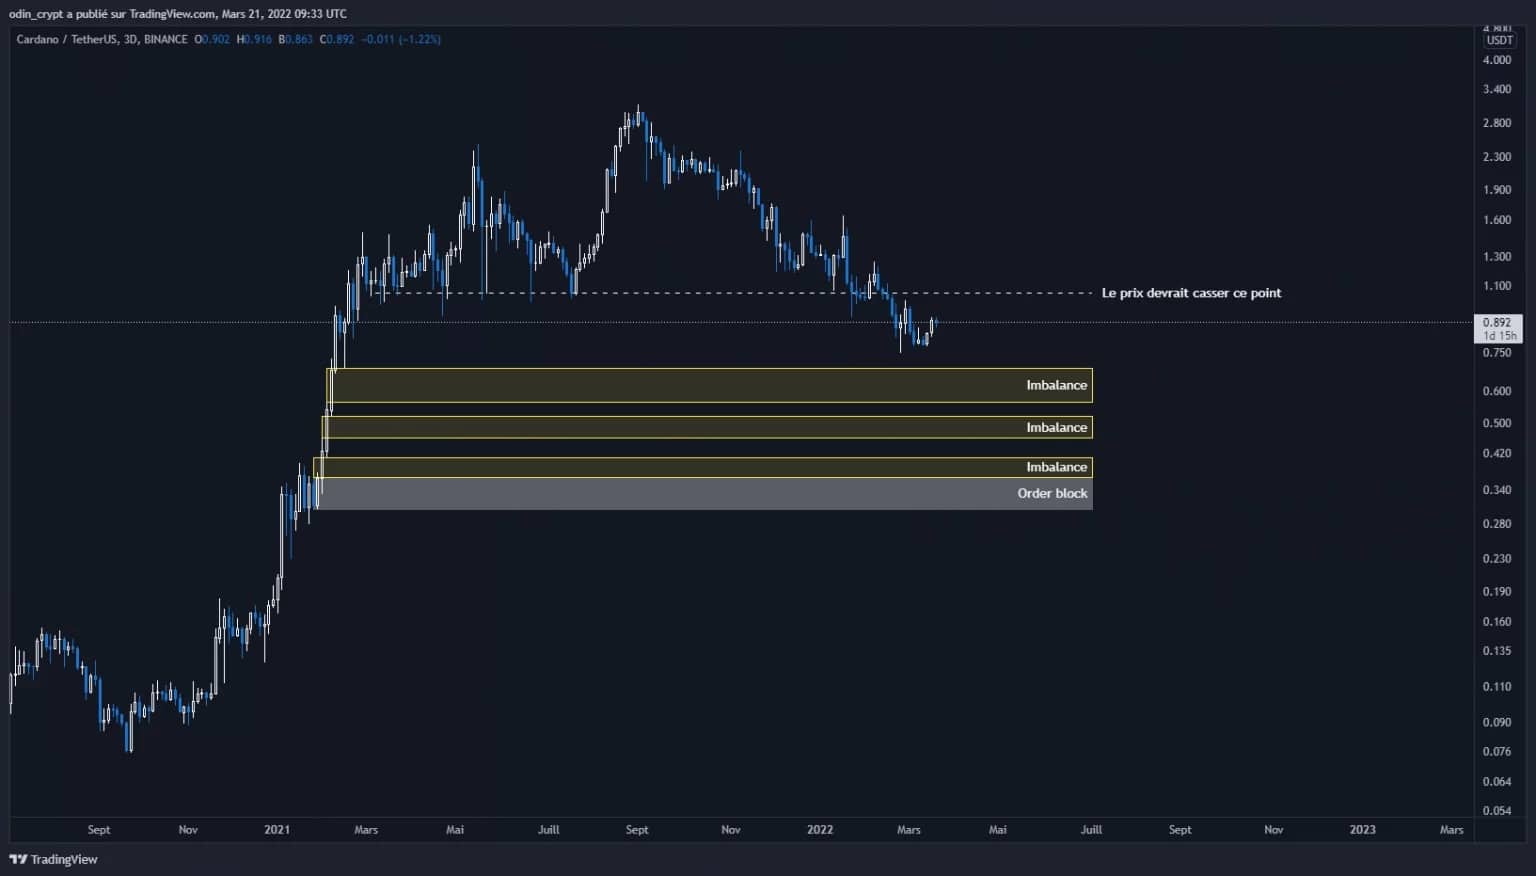
Cardano Analysis (ADA) in 3D
Conclusion
Bitcoin and Ether are once again in a neutral zone. Price movements are illiquid, development is slower, interest seems gone. The price of the 2 crypto currencies is nevertheless quietly heading towards their truth zones for the upside. If the price manages to retake these selling zones, a more impulsive move will occur. This will allow for buying on a future retracement.
On the Cardano (ADA) side, the bearish retracement scenario is now confirmed. The most interesting buying area at the moment is at $0.3 – $0.36. It will be possible to enter at this point with a medium term objective.